← Changelog

fig. grid
Changelog

Switch a chart to its numbers

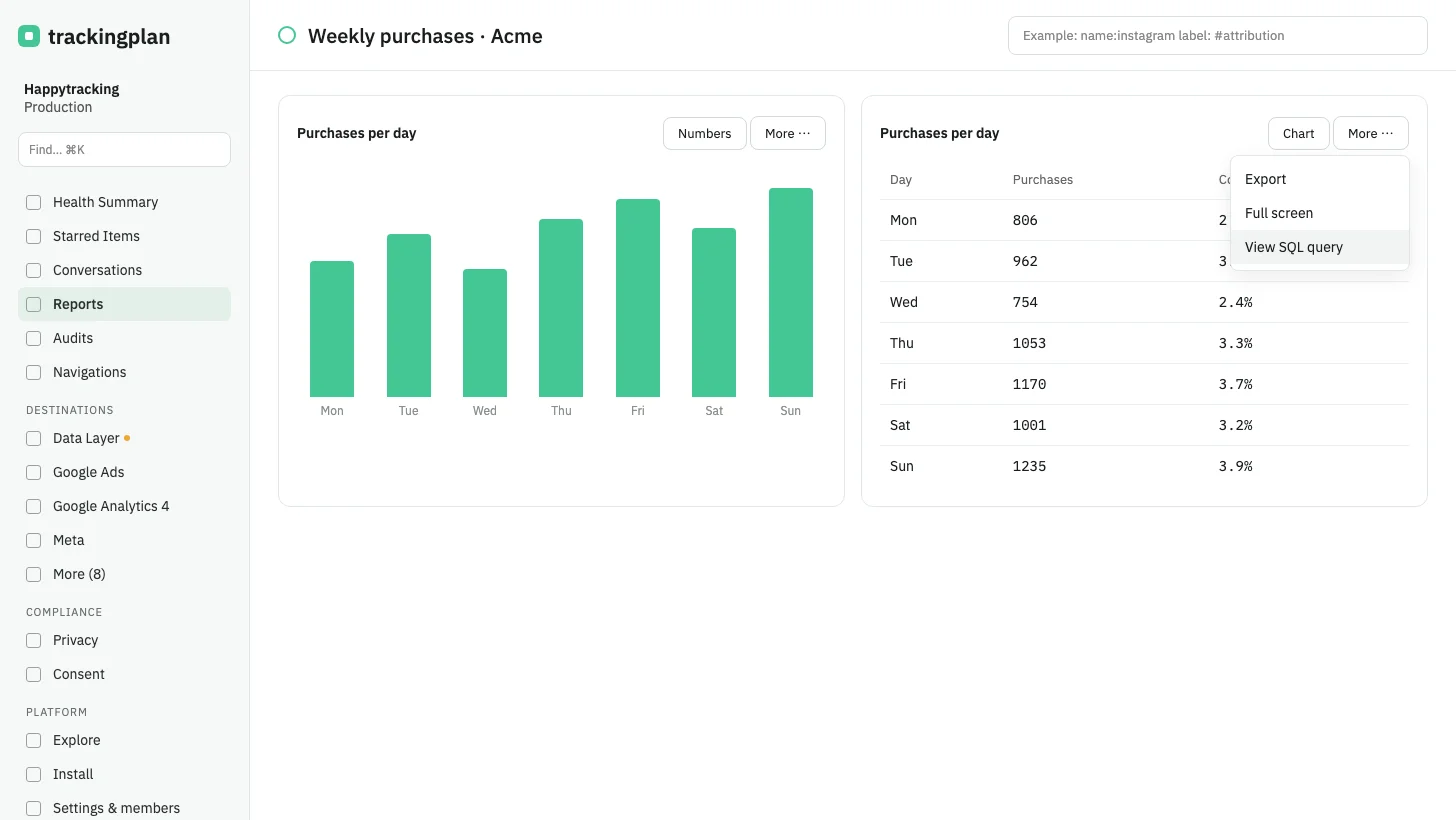
In a chart in a conversation, a report or an audit, one button switches between the chart and its numbers. View SQL query is in the More menu.

Released October 5, 2026 · 1 min read

In a chart in a conversation, a report or an audit, one button now switches between the chart and the numbers behind it. The button shows the view a click opens.

View SQL query is in the More menu, when the chart has a query. In a narrow layout, the More menu holds all three views.

Who it is for: anyone who needs the exact figure behind a bar, or wants to check how it was calculated.

Where: every chart in a conversation, a report or an audit. More on charts: Act on a chart or a table where it is.

Trackingplan

See everything. Miss nothing.

Your implementations audited around the clock with real-time, real-user data. Real-time alerts about errors or changes in your data, campaigns, pixels, privacy and consent. Let AI flag issues before they cost you.