← Changelog

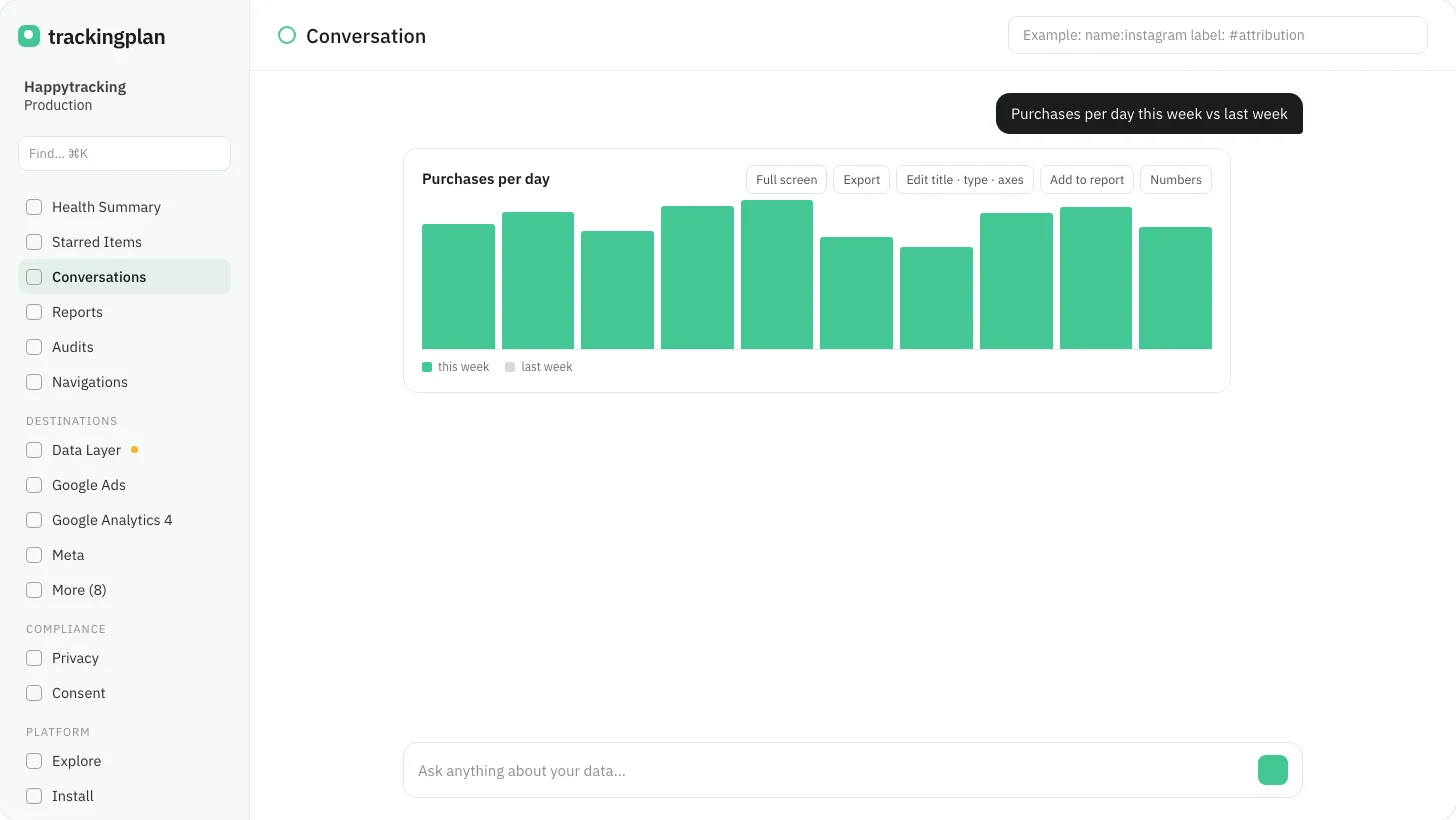
fig. bars
Changelog

Act on a chart or a table where it is

Any chart or table in an answer can be opened full screen, exported, edited (title, type, axes) and added to a report, without leaving the conversation.

Released September 12, 2026 · 1 min read

Any chart or table in an answer can now be worked on where it is: open it full screen, export it, edit its title, its type and its axes, and add it to a report.

Update, September 25: a new timeline chart shows when each destination loads on a page, when it fires and the milestones of the page. Update, October 3: a button switches from the chart to the numbers behind it.

Who it is for: anyone who used to screenshot a chart to put it in a deck.

Where: the toolbar on every chart and table in a conversation or a report.

Trackingplan

See everything. Miss nothing.

Your implementations audited around the clock with real-time, real-user data. Real-time alerts about errors or changes in your data, campaigns, pixels, privacy and consent. Let AI flag issues before they cost you.