
“Marketing agency KPIs” can mean two lists. One measures the agency as a business: margin, utilization, retention. The other is what the agency reports to each client about their campaigns. This post covers the second, and closes with the few agency KPIs that depend on whether the tracking works.
The rule for both is the same. A KPI goes in front of a client only after it has passed a check.
Early adopters of enhanced conversions saw a median conversion-rate increase of 5% on Search and 17% on YouTube, according to Google’s article on enhanced conversions. Same bids, same creative, same budget. What changed was how much of the conversion signal reached the platform. A large share of what a client reads as performance is measurement.
Why one KPI comes from several platforms
U.S. internet advertising revenue reached $258.6 billion in 2024, up 14.9% from the year before, according to the IAB and PwC Internet Advertising Revenue Report. Search took $102.9 billion, social $88.8 billion, and retail media $53.7 billion.
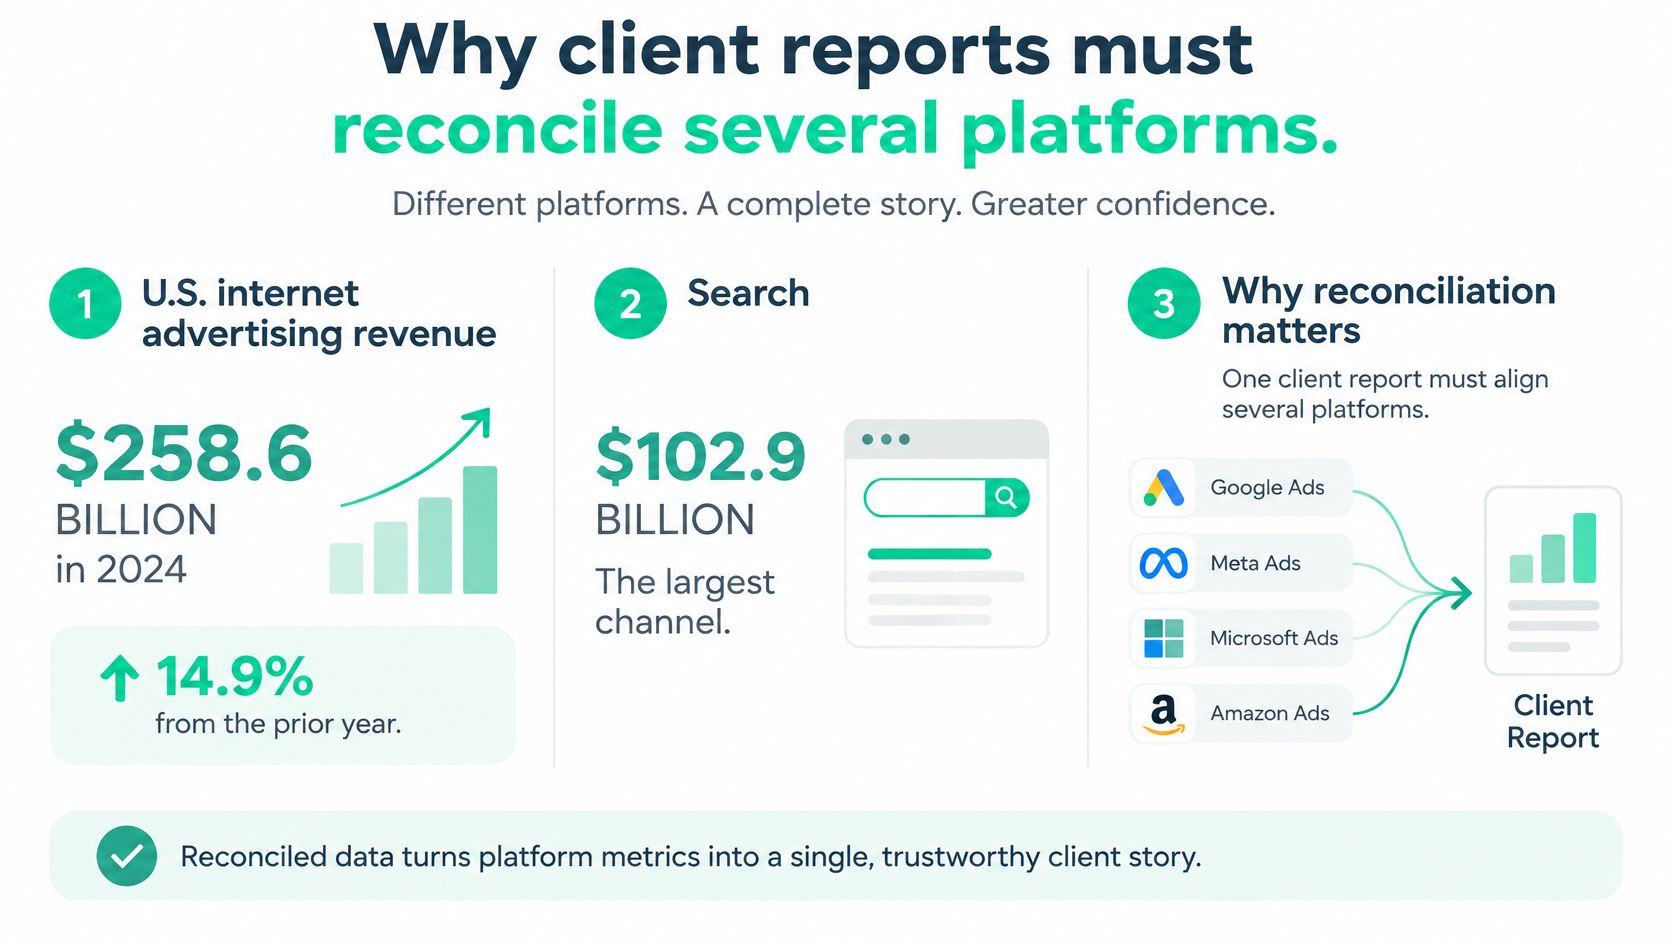
For an agency, that split has one consequence. A client’s spend rarely sits in one place, so a single KPI like CPA is built from several systems: the ad platforms, the analytics tool, the CRM or the order system. Those numbers only line up on the same date range, in the same currency, and against the same definition of a conversion.
Write six definitions for each client before you compare a single result: conversion, revenue, attribution window, currency, date range and deduplication. A unified marketing measurement setup holds together only when those come first.
The ten client KPIs and the check each one needs
Ten rows are enough. A report built on these ten, each one past its check, tells a client more than a forty-tile dashboard nobody can verify.
| KPI | What it measures | Source | Check before reporting |
|---|---|---|---|
| Spend | Money paid to each ad platform | Ad platform billing | Matches invoices in the same currency |
| Clicks and CTR | Ad interactions and their share of impressions | Ad platform | Clicks over impressions matches the platform’s own CTR |
| Platform conversions | Conversions the ad platform credited | Google Ads, Meta Ads, TikTok Ads | Counting method and window stated |
| Analytics conversions | Key events recorded in the web analytics tool | GA4 | Same event and timezone as the platform row |
| Backend orders or leads | Sales or leads recorded by the business | CRM, order system | Transaction ID on every row |
| Conversion value | Revenue credited to conversions | Ad platform, order system | Currency and tax treatment match |
| CPA and ROAS | Cost per conversion and return on spend | Calculated | Numerator and denominator use one conversion source |
| Match rate and EMQ | Events matched to people, and Meta’s Event Match Quality score out of 10 | Meta Events Manager | Checked again after every release |
| Deduplication rate | Share of Meta Pixel and Conversions API events counted once | Meta Events Manager | Browser eventID equals server event_id |
| Consent coverage | Share of sessions with a recorded consent signal | CMP, Consent Mode | Split by market and device |
Where these KPIs usually break
Platform conversions and analytics conversions are two rows, not one. They never agree, and an average of the two belongs to no system. Report both, each with its counting method and window next to it.
CPA and ROAS hide mixed sources. If spend comes from Google Ads and value comes from Shopify, the ROAS is a hybrid. It can still be useful, but it has to say so. Numerator and denominator come from one source, or the figure carries a label.
Match rate and Event Match Quality fail for different reasons. Match rate is the share of events tied to a person. EMQ scores the customer parameters behind that match. A high event volume with a weak score means Meta receives events it can’t use for attribution.
Consent coverage needs a denominator you can explain. Sessions with a recorded consent signal, per market and device, on the website and server-side tags. App traffic stays out of that figure.
Label every KPI: observed, modeled or unverified
Every number in the report carries one of three labels:
- Observed: straight from a platform export or a CRM record that passed its check.
- Modeled: includes platform modeling or an estimate for lost signal. The report names the model.
- Unverified: the check failed or hasn’t run yet. The report says why in one sentence.
Put the label beside the number, not in a footnote. A client who has to hunt for it reads the number as fact.
If a KPI can’t pass its check this month, publish it with the label. Deleting the row is what turns a small tracking defect into a trust problem three months later.
When ad platform KPIs and analytics disagree
Say a client’s Google Ads account shows 410 conversions for the month, GA4 shows 356 purchases, and the order system shows 380 paid orders. Nothing is broken. Google’s help center explains why GA4 and Google Ads conversion totals differ: the two can apply different counting rules, attribution settings and conversion windows.
The direction of the gap tells you what to look for:
- Platform conversions fall while orders hold steady: a tag stopped firing, consent signals are being lost, an offline import failed, or a setting drifted.
- Platform conversions rise above orders: a duplicate firing, or a counting method that credits more than one conversion per session.
For every primary conversion, write down the event name, transaction ID, counting method, attribution window, timezone and currency. When conversions also arrive through an API or server-side Google Tag Manager, the transaction_id is what stops one sale from counting twice. Quantify the gap in conversions and in revenue, because a percentage alone gives the client nothing to act on. This post on the GA4 vs ad platform conversion gap covers the causes one by one.
Meta has the same problem between the Pixel and the Conversions API. Meta’s dataset quality documentation sets the rule: the two copies of an event share an event name, and the browser eventID equals the server event_id. Track the deduplication rate the dataset reports, not raw Pixel and API volumes side by side.
Trackingplan watches these signals on real traffic. It checks every conversion, UTM and consent signal across the ad platforms, spotting lost match rate, missing value and CAPI double-counting, across 170+ analytics and ad providers. Scheduled checks run daily or weekly, gaps come quantified in money, and each finding goes to whoever owns the tag, with the evidence linked. Trackingplan doesn’t bid, manage budgets or change campaigns; it checks the data the bidding learns from.
How consent changes conversion KPIs
Most clients read a fall in reported conversions as a fall in demand. Sometimes it is. Often the report just stopped seeing what it used to see.
The wider effect is documented. A 2025 study found that a privacy-policy change reduced predicted targeting efficiency, and that tracking opt-outs can shrink audiences, weaken retargeting and leave attribution less complete, as set out in this CRESSE research paper. None of that says the client’s creative got worse.
So the consent KPIs answer a narrower question: which part of the drop is lower demand, and which part is lower visibility?
- Consent rate by market and device. A blended rate hides the market where the drop happened.
- Observed and modeled conversions as two figures. The client sees how much of the total came from a model.
- Recovered conversions. The share brought back through enhanced conversions or a CRM import.
When observed conversions drop and observed plus modeled holds, the loss is visibility. When both fall, demand is the likelier story. Trackingplan monitors consent on websites and server-side tags, not in mobile apps, so app traffic stays out of that comparison.
The agency’s own KPIs that depend on tracking
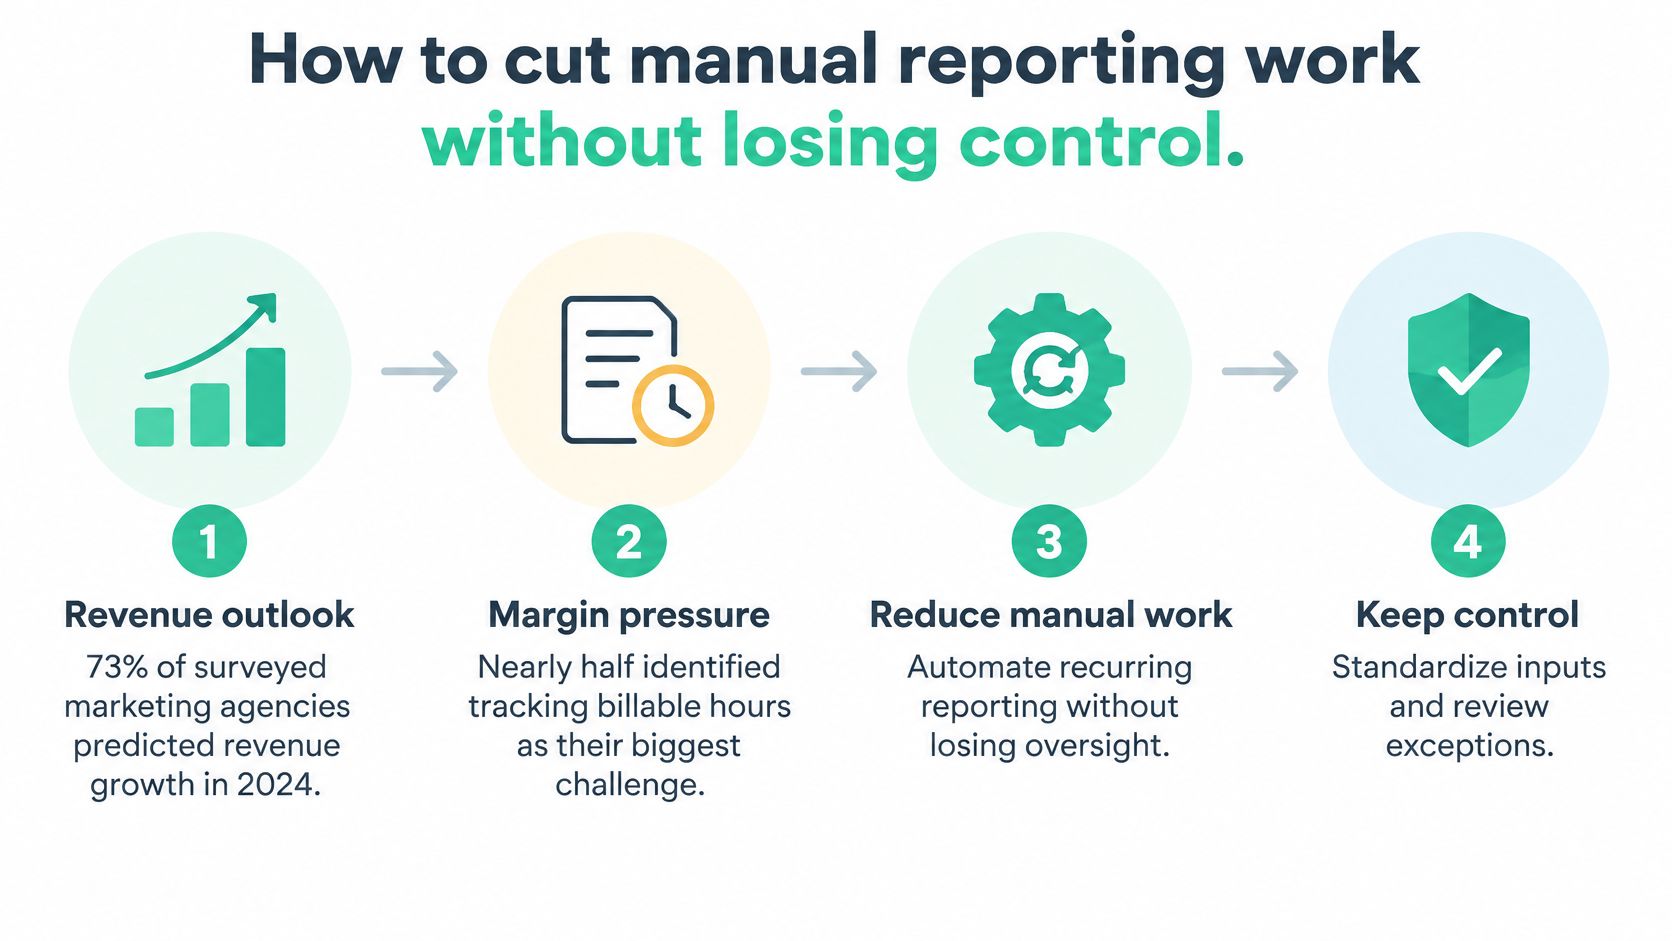
The business list belongs in the same conversation, because reporting eats margin. According to AgencyAnalytics, 73% of surveyed agencies predicted revenue growth in 2024, and nearly half named tracking billable hours as their biggest challenge. That pressure is also why how agencies choose reporting software comes down to what can be checked automatically.
Four agency KPIs move with the quality of the tracking:
- Hours of manual data checks per client per month. The work nobody wants to bill for.
- Incidents the client found first. Every one costs more trust than it costs to fix.
- Time from a broken tag to its fix. Measured from the release, not from the day someone noticed.
- Share of client KPIs labeled observed. The higher it is, the less time the monthly review spends on arguing about the numbers.
The first one is the easiest to measure. On Top Media saves approximately 25–30 hours a month in manual data quality tasks, and Elogia puts its savings at 12 hours a month.
For agencies, Trackingplan sends one digest per client every morning, routes alerts to the team that owns each account, and keeps every client in one workspace with reusable event specifications. More on that on the agencies page. For what goes around these KPIs in the report itself, the sections and the cadence, see this guide to client reporting.
FAQ
What KPIs should a marketing agency report to clients?
Ten cover most accounts: spend, clicks and CTR, platform conversions, analytics conversions, backend orders or leads, conversion value, CPA and ROAS, match rate and Event Match Quality, deduplication rate, and consent coverage. Each one needs a stated source and a check it has to pass before it goes into the report.
Why don’t ad platform conversions match GA4?
The systems count differently. Google explains that Google Ads and GA4 can apply different counting rules, attribution settings and conversion windows, so the same purchase can be counted once in one system, several times in another, or credited to a different touchpoint. Report both figures side by side, each with its counting method and window.
What KPIs should a marketing agency track for itself?
Besides margin, utilization and retention, track the ones that depend on tracking: hours spent on manual data checks per client, incidents the client found before the agency, time from a broken tag to its fix, and the share of client KPIs that passed their check.