
Learn how to calculate mean time to resolution, benchmark performance, and apply tactics to reduce MTR in your analytics operations.
You know the feeling. A dashboard looks wrong, the marketing team is asking why today's numbers don't match yesterday's, and the analyst on call is bouncing between logs, tickets, and Slack threads trying to figure out whether the issue is in the tag, the schema, or the pipeline. Meanwhile, every extra hour the incident stays open makes the reporting messier, the stakeholders less confident, and the fix harder to trust.
That's why mean time to resolution matters so much in analytics and observability work. It's not just a support metric, it's a measure of how long your data stays unreliable before someone gets it back under control. For teams that depend on clean dashboards and trustworthy event data, slow resolution isn't a minor delay, it's a direct hit to decision-making and credibility. If you're already thinking about data observability, this overview of data observability is a useful companion to the metric itself.
Introduction
A broken tracking setup rarely announces itself neatly. One missing property, one schema mismatch, or one late-night deployment can ripple through reports, attribution, and experiment results before anyone fully understands what changed. By the time the issue lands in a ticket, the core question isn't just what broke, it's how long the problem will stay open while people wait for a trustworthy answer.
Mean time to resolution, or MTTR, is the metric that helps teams answer that question in a disciplined way. In support and incident work, it usually means the average elapsed time from issue detection or ticket creation to final resolution, and guidance treats it as an end-to-end measure that includes investigation, escalations, waiting on replies, and closure verification (Palo Alto Networks on MTTR). For analytics teams, that matters because a tracking bug doesn't stop hurting you the moment someone spots it, it keeps distorting reporting until the fix is verified.
The practical value is straightforward. A team that standardizes this metric can compare incidents consistently, spot slow phases in the workflow, and avoid pretending a partial fix counts as real recovery. That's especially useful when the same broken event or pixel issue is visible across QA, analytics, growth, and engineering. Clean measurement gives those teams one shared language for how quickly truth returns to the dashboard.
Understanding the Key Concepts of Mean Time to Resolution
A tracking issue can look minor at first. One missing property, one schema mismatch, or one late-night deployment can ripple through reports, attribution, and experiment results before anyone fully understands what changed. By the time the issue becomes a ticket, the question is not only what broke, but how long the team will be waiting for a trustworthy answer.
Mean time to resolution is an end-to-end lifecycle metric. It begins when an issue is detected or a ticket is created, and it ends only when the issue is fully resolved and verified. In plain language, the clock does not stop when someone says, “We found the bug.” It stops when the service, dashboard, or tracking flow is back in a state you can trust.

Why the start and end points matter
MTTR functions like a service window in a repair shop. The window does not close when the mechanic replaces the part, it closes after the test drive confirms the car works. The same idea applies to observability and analytics QA, because a broken tracking tag remains broken until the event fires correctly and the downstream data looks clean.
This definition is what makes the metric useful for QA work. It captures how long a schema mismatch, missing pixel, or pipeline failure stays unresolved, not just how long the fix itself takes (Palo Alto Networks on MTTR). If a team only measures repair time, it can hide waiting periods, handoffs, and verification delays that still distort reporting.
Practical rule: if your team has not agreed on when the clock starts and stops, your MTTR numbers are not comparable.
What the metric includes
Published guidance treats MTTR as a full-resolution measure that covers investigation, escalations, waiting on replies, repair, and closure verification. That is why the number is more useful than a simple fix-duration estimate. It reflects the full incident lifecycle, not a vague “time spent working.”
For analytics teams, that scope matters because resolution often depends on more than engineering effort. A tracking plan may need to be checked, event names may need to be confirmed, and QA rules may need to be enforced before anyone can say the issue is closed. Teams that use automated tracking plan enforcement can shorten the path from detection to verified truth, since broken instrumentation is caught against a shared standard instead of being debated case by case. That same discipline also supports FCR strategies for Shopify, because clearer definitions reduce back-and-forth when teams need to confirm what “fixed” means.
In analytics operations, the best MTTR is not the shortest possible fix, it is the shortest time to verified truth.
A simple way to think about it
You can picture the metric as a timeline with three visible stages, investigation, remediation, and closure. The first stage identifies what happened, the second changes the broken thing, and the third confirms that downstream data or service behavior is back to normal. That is why MTTR is a reliable KPI only when every team uses the same boundaries.
Standardizing those boundaries matters across QA, analytics, growth, and engineering. If one team stops the clock at code deployment and another stops it only after dashboards are checked, the numbers will never line up. Shared definitions keep the metric honest, and they make it easier to compare incidents without arguing about which version of “resolved” a team used.
For a closer look at how teams move from symptom to cause, this root cause analysis guide is a useful reference alongside the metric itself.
Comparing Mean Time to Resolution with Related Metrics
People often use MTTR as if it means one thing everywhere. It doesn't. In some contexts it means resolution, in others repair, response, or recovery, which is exactly why teams get confused when they compare numbers across support, SRE, and security workflows (Traversal on MTTR ambiguity).
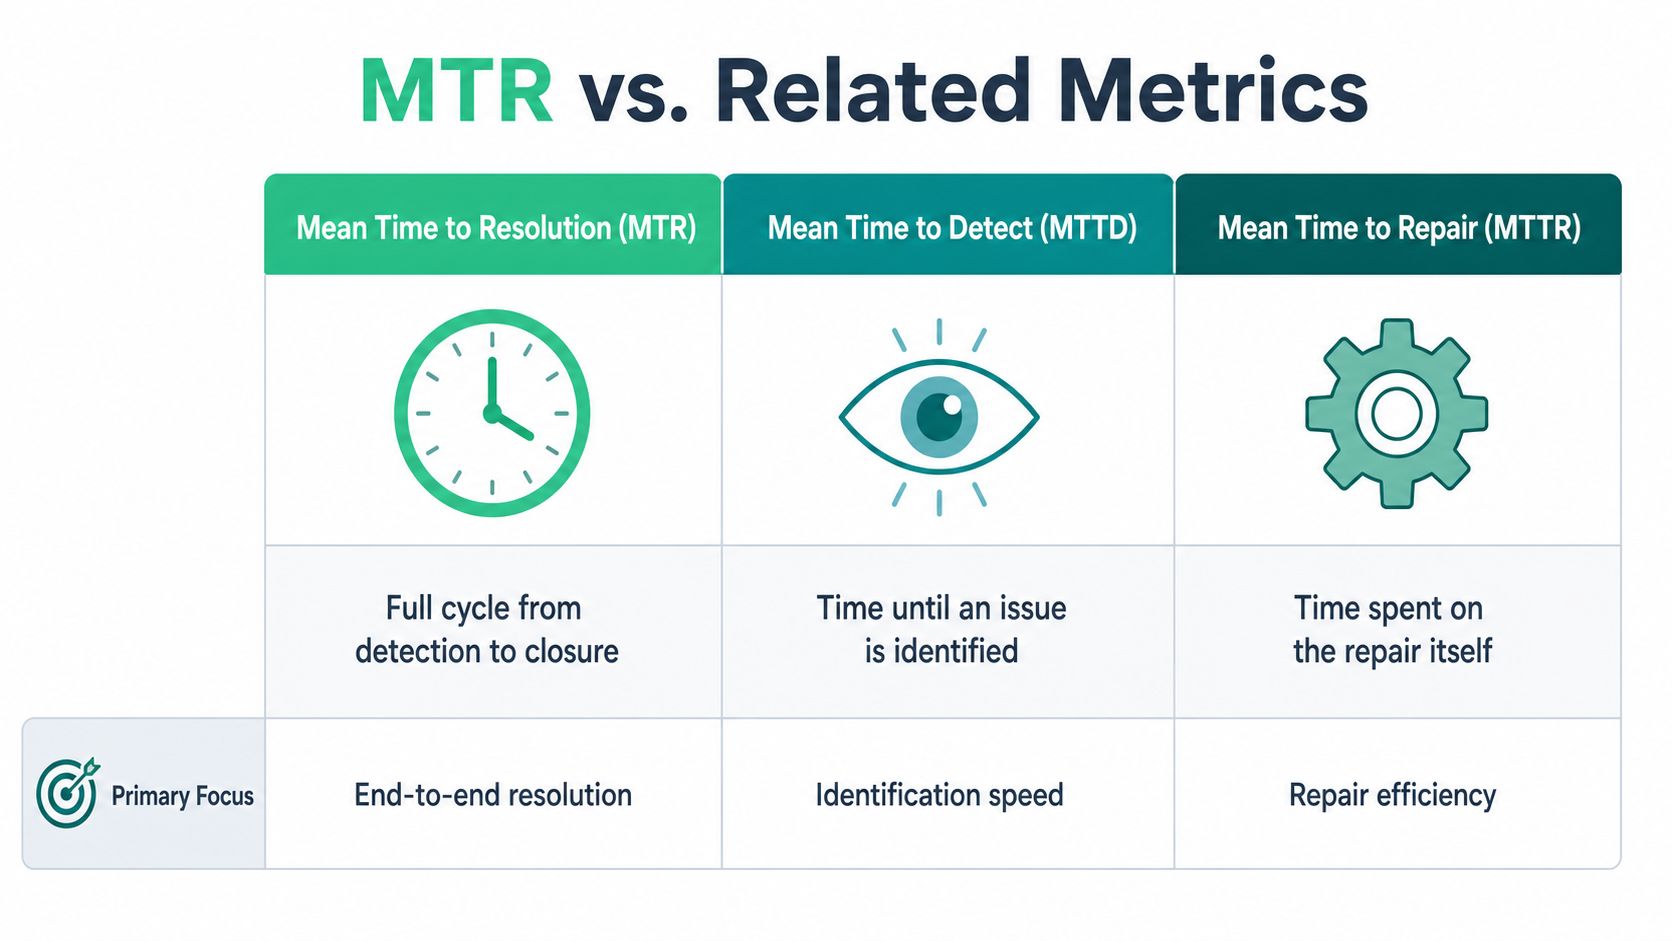
The metric family is related, not interchangeable
Mean Time to Detect (MTTD) measures how long it takes to notice that something is wrong. Mean Time to Repair focuses on the repair work itself. Mean time to resolution is broader, because it includes the full path to verified closure, not just diagnosis or the hands-on fix. Atlassian separates MTTA and MTTF from MTTR for exactly this reason, since they have different start and end points (Atlassian incident KPIs).
Here's the simplest way to keep them straight.
| Metric | What it measures | Why teams use it |
|---|---|---|
| MTR | Full cycle from detection to closure | End-to-end resolution |
| MTTD | Time until an issue is identified | Identification speed |
| MTTR | Time spent on the repair itself | Repair efficiency |
A lot of confusion starts when one team logs from first alarm and another logs from ticket open. That's not a minor detail, it changes the number. Mature incident programs standardize the trigger point, resolution criteria, and severity segmentation before they use MTTR for SLA or reliability decisions (Catchpoint MTTR glossary).
Why terminology changes the story
A team can appear to improve if it shifts the clock. For example, if one group starts measuring after acknowledgment instead of detection, the reported time shrinks even if customers still wait just as long. That's why the article that sounds “most precise” isn't always the one that helps operations most. Precision only helps if everyone uses the same measurement boundaries.
For analytics teams, FCR thinking is useful too. If you're trying to keep issues from bouncing between channels or owners, this FCR strategies for Shopify piece offers a good parallel on reducing handoff friction and closing issues cleanly.
Useful distinction: faster acknowledgment is nice, but it's not the same as faster resolution.
How to apply the distinctions
Use MTTD when your question is, “How fast do we know?” Use repair-focused MTTR when you need to study fix effort. Use mean time to resolution when leadership wants to know how long the customer-facing problem remained unresolved. In observability and analytics QA, that last version is usually the one that best matches real impact.
Formula for Mean Time to Resolution and Real Calculation Examples
The standard formula is simple. Mean time to resolution = total resolution time ÷ number of incidents (Atlassian incident KPIs). The hard part is making sure every incident in the numerator and denominator follows the same definition of “start,” “stop,” and “resolved.”
A small batch example
Suppose your analytics team handles three tracking incidents in a week. One takes 40 minutes, another takes 55 minutes, and the last takes 65 minutes. Add them together, and you get 160 minutes. Divide by 3, and the average resolution time is 53.3 minutes.
That number is only meaningful if each incident was measured from the same starting point. If one ticket starts at the first alert, another at the analyst's acknowledgment, and a third at the engineer's first log review, the average becomes less about operations and more about inconsistent bookkeeping.
A larger batch with an outlier
Now suppose your team resolves five incidents in a month. Their durations are 18 minutes, 24 minutes, 31 minutes, 35 minutes, and 190 minutes. The total is 298 minutes, and the average is 59.6 minutes. That one long incident drags the mean upward, which is exactly why the distribution matters as much as the average.
New Relic advises teams to keep the definition stable over time, exclude noisy outliers deliberately, and track MTTR by severity, service, and time of day because a single overall average can hide operational reality (New Relic on improving MTTR). In analytics QA, that advice matters because one severe pipeline outage can mask a pattern of smaller recurring tracking issues.
What to do with the result
Use the average as a directional indicator, not a verdict. A high value may mean the team needs better triage, better ownership, or stronger validation after a fix. A low value may still hide slow recoveries for the incidents that matter most.
If you want MTTR to drive improvement, calculate it the same way every time, then break it down by severity instead of trusting one blended average.
A companion metric like average handle time can help support teams understand effort at the ticket level. If you're comparing incident work with service workflows, the SnapDial AHT guide is a useful reference point for how duration metrics behave in customer operations.
Data Sources Pitfalls and Industry Benchmarks
Good MTTR starts with good timestamps. If your team relies on manual time entry, inconsistent ticket fields, or copied notes from chat threads, the average can drift away from reality fast. Accurate measurement depends on ticketing every alarm, automating ticket creation, and recording the full window from first alarm to last clear, not someone's best memory of what happened (INOC on mean time to resolution).
Clean data first, then compare benchmarks
The best sources are usually the ones closest to the incident itself, ticketing systems, alert logs, and observability platforms. Those systems record the moments you need without forcing people to reconstruct the timeline later. A good practice is to treat manual timestamps as a fallback, not as the primary source of truth.
The benchmark picture is uneven, and that's the point. MetricNet's widely cited global data point, referenced by Kayako, reports an average desktop IT support incident resolution time of 8.85 business hours, with observed organizational ranges from 0.6 hours to 27.5 hours (Kayako on time to resolution). Another benchmark in that same source cites a global average resolution time of 24 hours, which makes a one-day cycle a common planning baseline.
| Industry or context | Mean Time to Resolution |
|---|---|
| Desktop IT support average | 8.85 business hours |
| Observed organizational range | 0.6 hours to 27.5 hours |
| Global average planning baseline | 24 hours |
Why one average isn't enough
A single MTTR value hides too much. A team can look fine on paper while one service repeatedly fails or one severity class keeps dragging on. That's why the metric is more useful when you segment it by service, time of day, or severity instead of reading one blended average as a full picture (New Relic on improving MTTR).
For analytics infrastructure, this becomes a governance issue, not just a support issue. If a broken event stays open too long, it distorts reporting before anyone notices the trend. The metric then reflects how fast your organization corrects data quality problems before they spread through dashboards and decisions.
Rule of thumb: if the data source needs a human to remember the timestamp, it's probably too fragile to trust on its own.
For teams that want a more structured view of tracking hygiene, this data quality best practices guide is a helpful companion to the operational side of MTTR.
Strategies and Tools to Reduce Mean Time to Resolution
The fastest teams don't just work harder during incidents, they remove avoidable steps before the incident gets messy. Accurate MTTR measurement depends on precise logging and automation, and the same automation helps reduce the actual resolution time too (INOC on mean time to resolution). In observability and analytics QA, that means alerting on the right signal, creating the ticket automatically, and making the incident visible to the people who can fix it.
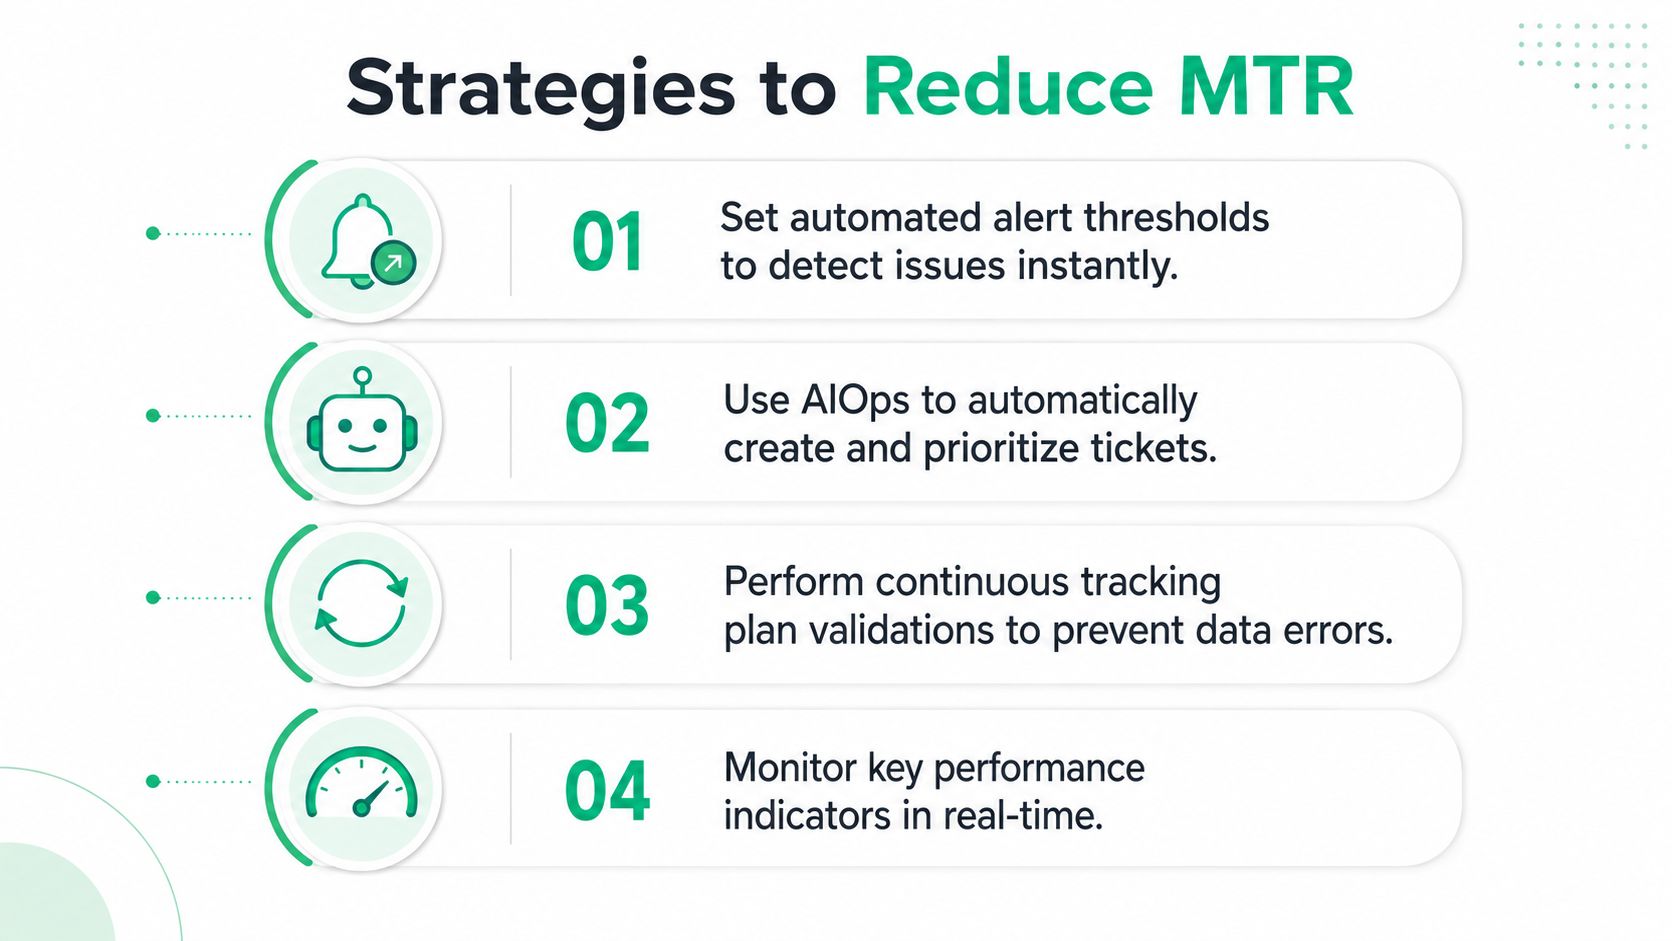
Automate the detection layer
Start with alert thresholds tied to service level indicators, not arbitrary thresholds that page people for noise. New Relic explicitly recommends using SLIs and automated incident remediation to reduce resolution time (New Relic on improving MTTR). In analytics QA, that means catching broken event volume, schema drift, or missing destination traffic as soon as the signal changes instead of waiting for a downstream report to look off.
Reduce the handoff tax
INOC recommends ticketing every alarm, automating ticket creation, and eliminating manual time entry so short, self-resolving outages still appear in the record (INOC on mean time to resolution). That advice matters because a lot of incident time disappears into coordination, not repair. When the alert already creates the case and routes it to the right owner, no one wastes ten minutes figuring out who should start.
Use continuous validation for analytics issues
A tracking plan that validates events continuously gives QA and data teams a practical way to shrink resolution time. Trackingplan is one option here, because it continuously discovers implementations and flags tracking problems in real time through alerting and anomaly detection, which helps teams spot broken or missing events faster and shorten the path from detection to fix. That same workflow reduces the manual audit burden that usually slows analytics incident response.
Keep the incident visible
Real-time dashboards, Slack or Teams alerts, and shared incident channels cut down on context switching. They also help root-cause analysis move faster because the same team sees the same evidence at the same time. If your response process still depends on scattered screenshots and private DMs, your MTTR is probably hiding a communication problem as much as a technical one.
For teams modernizing incident handling more broadly, this incident response automation guide is a practical complement to the tactics above.
The goal isn't to make humans faster at copying data from one place to another. The goal is to remove the copying entirely.
Conclusion
Mean time to resolution works best when everyone agrees on what the clock measures, where it starts, and what counts as resolved. Once that's standardized, the metric becomes far more useful than a vague average, because it shows how long incidents really affect customers, dashboards, and decisions. The teams that improve it consistently are the ones that clean up definitions, measure from reliable timestamps, and use automation to remove needless delay.
That's the key advantage of applying MTTR to analytics QA. You get a number that reflects how quickly broken data turns back into trusted data, and that gives support, analytics, and engineering one shared target. If you standardize the definition and tighten the workflow, resolution stops being a guess.
Trackingplan helps teams detect analytics and tracking issues in real time, keep a live tracking plan, and reduce the time it takes to move from alert to verified fix. If you want to shorten incident lifecycles and protect dashboard trust, visit Trackingplan and see how it fits into your observability workflow.