Discover what is data observability and how it shields analytics from silent errors with practical steps, pillars, and ROI-ready guidance.
In simple terms, data observability is an organization's ability to fully understand the health and state of data in its systems. It answers not just if data is broken, but also why, where, and how, providing end-to-end visibility into your entire analytics pipeline. This proactive approach helps teams detect and resolve issues before they impact business decisions.
Understanding Data Observability in Plain English

Let's cut through the jargon. Think of your company's data ecosystem as a complex car engine. Traditional data monitoring is like your basic "check engine" light—it flashes on to tell you something is wrong, but offers no specifics. You’re left guessing what the actual problem is.
Data observability, on the other hand, is like the advanced diagnostic report a modern mechanic pulls. It doesn’t just show a generic warning; it pinpoints the exact sensor that failed, why it failed, and what other systems are now at risk. It's this deep contextual awareness that separates observability from simple monitoring, giving you the full picture needed to diagnose and fix problems fast.
Why Data Observability Matters Now
In a world driven by data, silent issues can poison your analytics and lead to flawed decisions. Broken tracking events, unexpected schema changes from a new app release, or faulty third-party marketing tags can go unnoticed for weeks, quietly corrupting your most critical reports. By the time you spot the problem on a dashboard, the damage is already done.
This is where the true value of data observability shines. It shifts your team’s focus from being reactive to proactive. Instead of asking if something is broken, your teams can understand:
- Why an issue occurred by tracing it to the root cause.
- Where in the pipeline the problem originated.
- How the issue impacts downstream dashboards and tools.
This capability is so critical that the global cloud data observability market is projected to see a USD 17.5 billion growth opportunity by 2035, with a compound annual growth rate of 26.8%. This explosive growth is fueled by the widespread move to cloud systems and the absolute need for trustworthy analytics pipelines, with 96% of IT leaders expecting their observability budgets to grow or hold steady.
Data observability is fundamentally about restoring trust in your data. It gives you the confidence that the metrics you rely on for strategic decisions—from campaign attribution to product analytics—are accurate and reliable.
The importance of robust data pipelines, enabled by observability, becomes crystal clear when looking at industries like data analytics in financial services, where data integrity is paramount. Ultimately, it’s a practice that strengthens your entire analytics foundation, much like solid data governance for analytics establishes clear rules for data usage.
The Five Pillars of a Resilient Data Observability Framework
To really get what data observability is all about, you need to break it down into its core components. While the term might sound a bit complex, any solid framework is built on five foundational pillars. These pillars work together, a lot like our own senses, to give you a complete and intuitive feel for the health of your data.
They turn abstract data flows into a tangible system you can actually monitor, diagnose, and ultimately trust. Once you get a handle on these five areas, you'll find yourself moving beyond just reacting to broken dashboards and start proactively managing the health of your entire analytics ecosystem, from end to end.
Let's dive into each one.
1. Metrics and Freshness
At the most basic level, observability kicks off with key metrics. This pillar is all about the numbers—the quantitative side of your data—giving you a quick pulse check on its behavior and timeliness. Think of it as the vital signs monitor for your data pipelines.
Freshness is a huge one. It answers a simple but critical question: how up-to-date is my data? If your marketing team is making decisions based on a "daily" report that hasn't actually updated in three days, your data is stale. Those decisions are being made based on a false reality.
Volume is another key metric. A sudden, weird drop in the number of events being recorded—or a massive, unexpected spike—is almost always a red flag for a big problem. For instance, if your user_signup event volume plummets by 90%, it could be a sign that the signup button is broken on your app's latest release. Keeping an eye on these metrics is your first line of defense against data downtime.
2. Metadata and Schema
If metrics are the vital signs, then metadata is the DNA. This pillar is all about monitoring the structural integrity of your data. The schema is the blueprint that defines how your data is organized—things like table names, column names, and data types. Any change to this blueprint that isn't planned or documented can unleash widespread chaos.
Imagine a developer renames a field from user_email to email_address in a backend database. It seems like a small tweak, but it instantly breaks every single downstream report, dashboard, and marketing automation that depended on the old field name. The data pipeline might keep running, but the data it's delivering is now incomplete or just plain wrong.
A robust data observability platform automatically keeps an eye on these schema changes. It acts like a guardian, alerting you the second a developer’s change is about to wreck your critical marketing funnel report. What could have been a week-long mystery becomes a five-minute fix.
3. Lineage
Data lineage is arguably the most powerful pillar of them all. It’s like a GPS for your data. It gives you a complete, end-to-end map of your data's entire journey, showing you exactly where it came from (upstream sources) and where it’s going (downstream destinations like dashboards and reports).
When a KPI on a C-suite dashboard suddenly looks off, the first question is always, "Where did this number even come from?" Without lineage, you’re stuck manually tracing its origins, a painful process that can take days or even weeks.
With lineage, you basically have a superpower. You can trace that faulty KPI on your Tableau or Power BI dashboard all the way back through its entire journey—through transformation jobs, data warehouses, and ingestion pipelines—to the root cause. Maybe it was a faulty API call or a misconfigured tracking event. This visibility is non-negotiable for rapid root-cause analysis and a cornerstone of effective data quality monitoring.
4. Logs
Logs give you the story behind the data events. While metrics tell you what happened (e.g., event volume dropped), logs can help you understand why. They are simply detailed, time-stamped records of events, errors, and system operations that happen inside your data infrastructure.
For developers and engineers, logs are absolutely indispensable for debugging. When a data pipeline fails, a quick look at the logs might reveal an "access denied" error, a failed database connection, or a timeout issue. This information is crucial for pinpointing the exact technical fault behind a data quality problem.
5. Incidents
The final pillar, Incidents, pulls everything together. It's all about managing the detection, alerting, and resolution process. An incident is any event that disrupts or degrades the quality of your data, and this pillar focuses on putting observability into action.
An effective incident management system does more than just send a generic alert. It makes sure the right alert goes to the right person at the right time, packed with all the necessary context from the other four pillars. For example:
- A schema change alert should be routed directly to the engineering team.
- A UTM parameter anomaly should go straight to the marketing team.
- A stale dashboard warning should notify the analytics team.
By connecting detection to action, this pillar transforms data observability from a solo effort into a collaborative and efficient practice across the entire organization.
How Data Observability Directly Impacts Your Bottom Line
While the technical pillars of data observability are crucial, its real value is measured in dollars and cents. The whole point of getting a handle on your data's health is to see a direct, positive impact on your company's financial performance. It's the bridge that connects clean data to a healthy bottom line.
Think about it. Faulty data creates a ripple effect of expensive mistakes. For marketers, a tiny error in a UTM parameter can misattribute thousands of dollars in ad spend, making successful campaigns look like duds. For analysts, weeks can be lost just trying to manually validate data, which delays critical business insights and slowly erodes any trust in the reports they produce.
These seemingly small issues snowball into significant financial drains and missed opportunities. This is where data observability flips the script, moving teams from a reactive, costly firefighting mode to a proactive, value-driven one.
From Wasted Spend to Maximized ROI
Let's walk through a common nightmare scenario. Your marketing team launches a major campaign, but a broken checkout_completed event goes unnoticed for days. By the time someone finally spots the weird dip on a dashboard, you've already lost a ton of invaluable conversion data. You can't accurately measure the campaign's ROI, and your remarketing audiences are now incomplete.
This is a classic case of "data downtime," and its cost is immense. A data observability platform is designed to stop this from ever happening by providing:
- Real-time anomaly detection: The system would have immediately flagged the sudden, unnatural drop in
checkout_completedevents. - Contextual alerts: An alert would be sent straight to the marketing and development teams via Slack or email, getting the right eyes on the problem instantly.
- Root-cause analysis: Instead of a frantic investigation, teams could see that the event broke right after a specific app release, letting them roll out a fix in minutes, not days.
By catching these issues right at the source, observability turns what would have been wasted ad spend into profitable campaigns. It ensures every single marketing dollar is accurately tracked and optimized.
The infographic below shows how the core components of observability work together to prevent these kinds of costly problems.
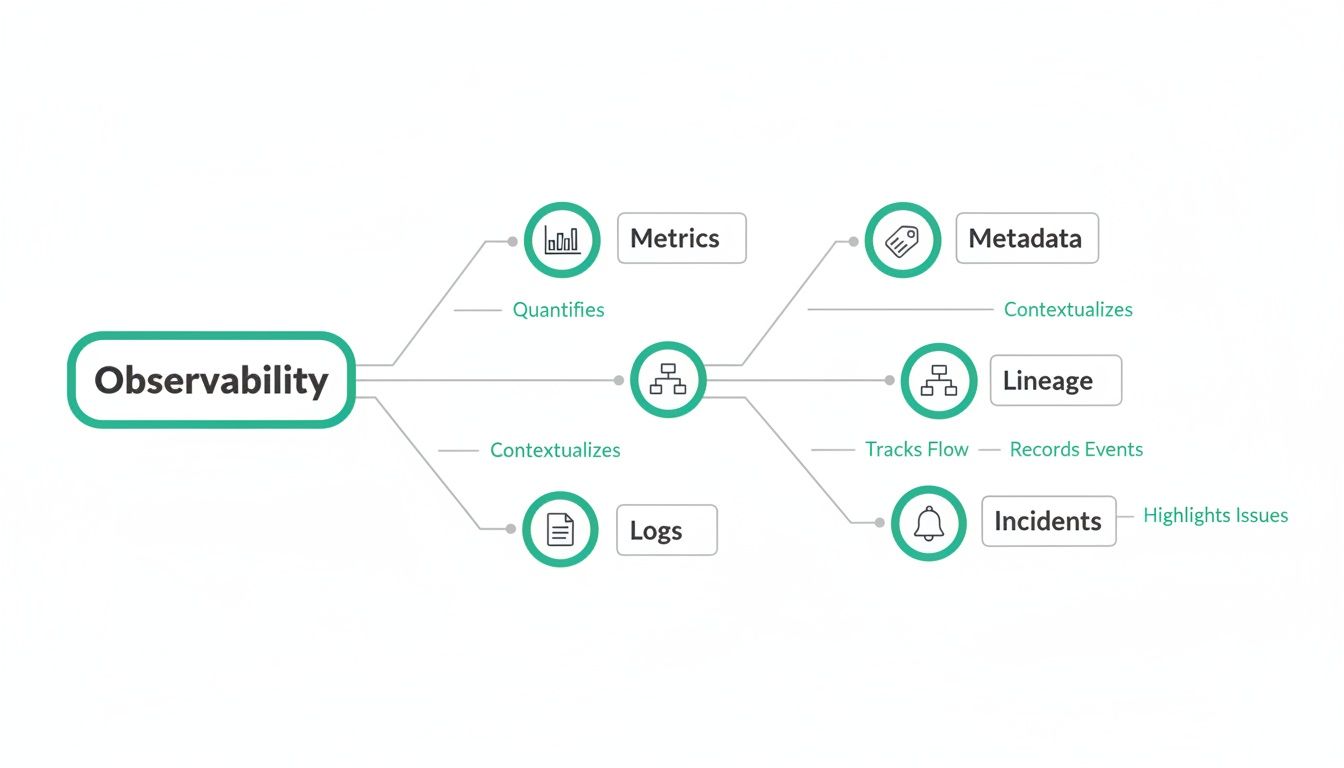
This map illustrates how metrics, metadata, lineage, and incident management all feed into a complete picture of your data's health, which is the key to preventing expensive data downtime.
Empowering Teams to Deliver Value Faster
Data observability isn't just about preventing losses; it's a massive productivity booster that fuels faster innovation. Developers can ship code with confidence, knowing that if a change has an unintended downstream impact on analytics, it will be caught immediately. The fear that a minor update might silently break a critical dashboard for the C-suite simply disappears.
For analysts, this means they get their most valuable resource back: time. Instead of spending their days playing detective and hunting for the source of bad data, they can focus on what they were hired to do—deliver the strategic insights that move the business forward. This, in turn, builds trust across the entire organization, because executives can finally rely on the accuracy of the data they use for major decisions.
The market's rapid growth reflects this clear ROI. The observability platform market is on track to hit USD 13.9 billion by 2034, with these solutions expected to make up 72% of the market share by 2025. This isn't just hype; it's a clear signal that companies are demanding unified tools that cut through siloed monitoring and deliver tangible business value. You can read more about the trends shaping the observability platform market to get a better sense of this industry-wide shift.
Your Practical Roadmap to Implementing Data Observability
Getting started with data observability isn't some massive, multi-quarter IT project. It's really more of a gradual shift in how your team thinks, powered by the right tools. The best part? You can start this journey in minutes and see real, tangible value from day one.
This roadmap will walk you through a simple, phased approach to building a solid observability practice. Forget about complicated manual setups and tests that break with every new release. Modern platforms like Trackingplan automate all the heavy lifting, so you can focus on finding insights, not wrestling with infrastructure.
Phase 1: Discover and Map Your Analytics Landscape
You can't protect what you can't see. So, the very first step is to get a complete, bird's-eye view of your entire analytics ecosystem. We're talking about everything—from the events firing on your website and apps to all the marketing tools and analytics platforms that receive that data.
A modern observability tool handles this discovery process for you automatically. All it takes is adding a lightweight script to your site or using an SDK in your app, and the platform immediately starts mapping every single data point. It automatically identifies all your analytics and marketing tags, figures out their configurations, and shows you exactly how data is flowing between them.
This process creates a living, always-current inventory of your entire analytics implementation. Finally, you have a single source of truth, getting rid of the guesswork and outdated spreadsheets that no one trusts. This first step alone brings immense clarity to what’s actually happening in your live environment.
Phase 2: Prioritize Your Critical Data Flows
Let's be honest: not all data is created equal. While mapping gives you the full picture, the next move is to zero in on what truly matters to your business. Sit down and identify the user journeys and business KPIs that are absolutely non-negotiable for success.
These critical flows often include things like:
- User Registration: The
user_signupevent and all its associated properties. - E-commerce Checkout: The entire funnel, from
add_to_cartall the way topurchase_completed. - Lead Generation: The form submissions that keep your sales pipeline full.
- Key Feature Engagement: The core interactions that make your product valuable to users.
By prioritizing these data flows, you can focus your monitoring efforts where they’ll have the biggest business impact. It’s all about making sure your most important data is also your most protected data, delivering an immediate return on your investment.
Phase 3: Implement Automated Monitoring and Alerting
With your landscape mapped out and your priorities set, it's time to turn on the automated watchdog. This is where data observability really shines. A platform like Trackingplan continuously monitors your data streams in real-time, checking them against the structure you expect.
This isn’t about setting up fragile, manual thresholds that you have to constantly update. The system uses machine learning to automatically spot anomalies in data volume, flag unexpected schema changes, and catch tracking bugs the second they go live.
You’ll get actionable alerts on the kinds of issues that constantly break analytics, such as:
- Schema Mismatches: A developer changes a property name from
productIDtoproduct_id, and you know about it instantly. - UTM Errors: Your marketing team launches a campaign with a typo in a UTM tag, and it gets flagged before it corrupts your attribution reports.
- Missing Events: A critical
purchaseevent suddenly stops firing after a new app release.
These alerts are sent straight to your team through the tools they already live in, like Slack, Microsoft Teams, or email. This is how you shift your organization from a reactive state—finding broken dashboards weeks after the fact—to a proactive one where you’re fixing issues in minutes.
Phase 4: Evolve with Proactive Governance
The final phase is about turning observability from a simple monitoring tool into a proactive governance engine. The insights you get from continuous monitoring should feed directly back into your development and analytics processes, helping you maintain a perfect tracking plan for the long haul.
For example, when the platform flags a new, undocumented event, it becomes an opportunity. You can either approve it and formally add it to your tracking plan or flag it as rogue code that needs to be removed. This loop ensures your analytics implementation stays clean and perfectly aligned with your business goals.
Ultimately, this roadmap shows that answering the question "what is data observability" is a practical and incremental process. It starts with getting visibility, focuses on what’s important, automates detection, and nurtures a culture of data quality. This is how you ensure your data remains a trustworthy asset you can rely on for growth.
Real-World Data Disasters Solved by Observability
The true test of any technology is how it performs in the wild. When you ask what is data observability, the best answers come not from definitions, but from real-world scenarios where it turns potential chaos into controlled, quick resolutions.
Let's walk through three all-too-common data disasters that businesses face every day. These stories highlight the massive gap between traditional, reactive data quality checks and the proactive, automated oversight that modern observability delivers.
Scenario 1: The Silently Broken Retention Metric
Picture this: your product team just shipped a new app update. On the surface, everything seems fine. But two weeks later, an analyst notices a key retention dashboard is nosediving. Panic sets in. Is there a new bug causing users to churn, or is something else wrong? The team scrambles, spending days digging through logs and comparing reports while the clock ticks.
The Observability Solution:
A data observability platform would have caught this issue within minutes of the app release. The system, which continuously monitors all analytics events, would immediately detect an anomaly: the session_start event, critical for measuring retention, stopped firing for a specific user segment on the new app version.
Instead of a frantic, multi-day investigation, the team gets an instant, automated alert pinpointing:
- The Anomaly: A sudden 95% drop in
session_startevents. - The Root Cause: The event broke specifically on iOS version 3.4.1, which was part of the latest deployment.
- The Impact: All downstream tools relying on this event for retention analysis are now receiving bad data.
With this clear, actionable insight, the development team can immediately roll back the change or push a hotfix. A problem that could have skewed strategic decisions for weeks is resolved in hours.
Scenario 2: The Rogue PII-Collecting Tag
A marketing partner asks you to add their new third-party tag to your website for campaign tracking. Your team adds the script, and everything appears to work as intended. What no one knows is that the script is quietly scraping form fields and collecting sensitive user data—including email addresses—and sending it to an unauthorized third-party server.
This is a compliance nightmare waiting to happen, exposing your company to massive GDPR or CCPA fines and irreparable reputational damage. To grasp the gravity of such issues, it's useful to consider lessons learned from public incidents, like those covered by a data breach observatory.
Data observability acts as your automated privacy watchdog. It continuously scans your data traffic for patterns that match personally identifiable information (PII) and flags any unauthorized data collection.
The Observability Solution:
An observability platform with automated PII detection would flag this violation instantly. The moment the rogue tag started collecting email addresses, the system would trigger a high-priority security alert. The alert would specify which tag was responsible, what PII it was collecting, and where it was sending the data. Your privacy and security teams can then block the tag immediately, preventing a major data breach before it even begins.
Scenario 3: The Inconsistent Campaign UTMs
Your marketing team launches a huge, multi-channel campaign across Google Ads, Facebook, and email. The goal is to drive traffic to a new landing page and measure the ROI of each channel. But due to manual errors, the UTM parameters are a mess: utm_source=google is used alongside utm_source=Google-Ads, and utm_campaign=spring-sale is mixed with utm_campaign=spring_sale_2025.
When the analytics team tries to build an attribution report, the data is fragmented and unusable. It’s impossible to get a clear picture of which channel is performing best, leading to wasted ad spend and flawed strategic planning.
This scenario is incredibly common, and the pain it causes is felt far and wide. It's no surprise that the enterprise data observability software market, valued at USD 1.5 billion in 2025, is projected to hit USD 3.6 billion by 2035. This growth reflects the urgent need to solve undetected issues like schema mismatches and UTM errors that automated platforms are built to find.
The Observability Solution:
A platform like Trackingplan allows you to define and enforce naming conventions for your UTMs. The moment a user lands on your site with a non-compliant parameter, the system flags it in real time. The marketing team receives an alert showing the exact incorrect UTM and its source, allowing them to fix it immediately. This ensures every dollar of marketing spend is attributed correctly from day one.
These examples show how data issues silently creep into even the most well-run organizations. The table below summarizes how observability shifts the response from a manual, reactive fire drill to an automated, proactive solution.
Common Data Disasters and Their Observability Solutions
Ultimately, these scenarios demonstrate that data observability isn't just about finding problems—it's about finding them before they impact the business. It’s the difference between flying blind and having a full instrument panel to navigate your data ecosystem with confidence.
Frequently Asked Questions About Data Observability
As teams start to dig into data observability and what it can do for them, a lot of practical questions pop up. It's one thing to understand the theory, but moving to real-world implementation brings up common concerns and a few misconceptions. This section answers some of the most frequent questions we hear, giving you the clarity needed to take the next step.
Below, we’ll get into the nitty-gritty of how data observability fits into your current stack, who should be managing it, and how you can get started without kicking off a massive, resource-draining project.
How Is Data Observability Different from Data Quality Tools?
This is a great question, and it gets to the heart of a major shift in how we manage data. While both are aimed at improving data integrity, they approach the problem from completely different angles.
Think of it like this: traditional data quality tools are like a scheduled health check-up. They run batch jobs—maybe once a day—to scan data that’s already sitting in your warehouse. They’re looking for things like null values or formatting errors in a specific table. It's useful, but it’s reactive. You’re finding problems long after they’ve happened and potentially already caused damage.
Data observability, on the other hand, is like wearing a real-time heart rate monitor during a workout. It’s proactive and continuous, watching the entire data pipeline from the moment data is created on your app or website all the way to its destination. It’s built to catch issues the second they happen, not hours or days later.
The core difference is the focus: data quality tools inspect data at rest, while data observability tools watch over the entire data journey in motion. This proactive, end-to-end view is what allows teams to prevent bad data from ever reaching their dashboards in the first place.
Do We Need to Hire More Data Engineers to Manage This?
Not at all. In fact, it's quite the opposite. While your data engineers are absolutely critical for building and maintaining the core infrastructure, modern data observability platforms are designed to democratize data governance. The whole point is to empower the people who actually use the data every day—like marketers, product managers, and analysts—to take ownership of its health.
Platforms like Trackingplan are built to automate the heavy lifting:
- Discovery and Mapping: Automatically discovering every single analytics event and where it's going, without anyone needing to manually document it.
- Anomaly Detection: Using machine learning to spot issues, so engineers don’t have to spend their time setting up and tweaking hundreds of manual alert rules.
- Actionable Alerts: Sending clear, context-rich alerts directly to the right team. A UTM issue can go straight to the marketing team, while a schema change alert goes to the developers.
This frees up your data engineers to focus on high-impact projects instead of constantly firefighting data issues. It means marketers can finally validate their own campaign tracking and analysts can trust the numbers they're reporting, without filing a ticket for every little question.
How Can We Start Without a Massive Project?
The thought of rolling out yet another platform can feel overwhelming, but the beauty of a good data observability tool is that you can start small and prove its value almost immediately. You don't have to boil the ocean.
A great way to begin is by focusing on one, single, high-impact user flow.
- Choose a Critical Flow: Pick a journey that’s absolutely vital to your business. The e-commerce checkout process or the new user sign-up funnel are perfect examples.
- Implement Monitoring: Set up your observability tool to monitor just the events tied to that specific flow. This often takes only a few minutes.
- Demonstrate Value: Within days, you'll almost certainly uncover hidden problems—a missing property on an
add_to_cartevent, an inconsistent naming convention, or a broken step in the funnel.
Fixing just one of these issues provides a clear, measurable win. For instance, ensuring your purchase event and all its properties are tracked perfectly gives you immediate confidence in your revenue reporting and ROI calculations. That quick win builds momentum and makes a powerful case for expanding observability to other parts of the business. You can watch this video to learn how to solve data quality issues in your analytics on a specific flow.
How Does This Help with Data Privacy and GDPR?
Data observability plays a surprisingly critical—and proactive—role in data privacy and compliance. In today's complex digital world, new tools and third-party scripts are added all the time, often creating blind spots where sensitive data can be accidentally collected and sent to places it shouldn't go.
A data observability platform acts as your automated privacy watchdog. It constantly scans all outbound data traffic, looking for patterns that match personally identifiable information (PII) like email addresses, names, or phone numbers.
If a new third-party tag or a snippet of faulty code starts collecting PII and sending it to an unauthorized destination, the platform will immediately:
- Detect the Leak: Identify the exact piece of sensitive data being exposed.
- Pinpoint the Source: Show you precisely which script or tag is responsible.
- Send an Alert: Notify your security and privacy teams in real time.
This gives you the power to shut down potential data breaches before they become a real problem, helping you maintain compliance with regulations like GDPR and CCPA. It transforms privacy from a reactive, audit-based headache into a proactive, continuous process.
Ready to stop flying blind and start trusting your data? Trackingplan offers a fully automated data observability platform that installs in minutes and delivers value from day one. Get a single source of truth for your analytics and start fixing data issues today.