
The End of Analytics Fire Drills
Monday morning. Paid search looks weak, Shopify orders look normal, and the CMO wants an answer before the budget meeting. Within minutes, the same pattern starts. Marketing checks campaign links. Analytics inspects tags. Engineering reviews the last release. Nobody is stalling, but everyone is rebuilding the same context by hand.
That is the true cost of analytics incidents in marketing and growth teams. The broken event or bad schema is only the trigger. The bigger failure is the operating model around it.
In a typical response, people jump across Google Tag Manager, browser requests, consent settings, event schemas, destination logs, and reporting tools just to answer a basic question: is the business performance changing, or did measurement break? That manual triage slows campaign decisions, wastes analyst hours, and turns a fixable tracking problem into a leadership escalation.
Security and IT teams learned this lesson years ago. They stopped treating recurring incidents as one-off investigations and started treating them as workflows. The same approach applies here. Broken tracking, attribution corruption, schema drift, and accidental PII collection are different from security incidents, but the response pattern is similar enough to automate usefully.
For analytics teams, the practical takeaway is simple. Define the incidents that happen again and again. Detect them continuously. Attach the context an analyst would otherwise have to gather manually. Route the issue to the right owner with the first response steps already prepared.
That shift matters because marketing data incidents rarely fail loudly. A checkout event can drop only on Safari. A tag can fire before consent only in one region. A campaign can keep spending while attribution imperceptibly degrades for three days. Teams that rely on someone spotting a strange chart are choosing delayed detection as their default.
A good starting point is automated analytics monitoring that catches tracking errors early. The goal is not to replace analysts. It is to stop using senior people as human polling systems.
Practical rule: If an issue recurs and the first three response steps are predictable, put those steps into an automated workflow.
Defining the Modern Analytics Incident
Most incident response content still assumes the incident lives in infrastructure or security tooling. That leaves a big blind spot for analytics teams. Existing guidance often doesn't address noisy, cross-stack environments like web, app, and marketing systems, where the incident is a data-quality failure rather than a breach, as discussed in Cynet's guide to automated incident response.
What counts as an analytics incident
In practice, an analytics incident is any tracking, measurement, or governance failure that makes downstream data untrustworthy or unsafe to use.
That includes obvious breakage, like a missing purchase event. It also includes quieter failures that are harder to spot in a dashboard review.
- Broken collection: A tag stops firing, an SDK update drops events, or server-side forwarding fails.
- Schema drift: An event still arrives, but the event name, property type, or required parameter changes.
- Attribution corruption: UTMs are malformed, overwritten, or missing, which distorts channel reporting.
- Privacy and consent failures: A tag sends PII, fires without valid consent, or routes data to the wrong destination.
- Rogue changes: New events appear without approval, duplicate parameters start flowing, or old tracking reappears after a release.
Traditional IT incidents vs modern analytics incidents
This distinction matters because it changes what “good response” looks like. In analytics, the first challenge is often root-cause isolation across several dependent tools, not merely acknowledging an alert.
That's why teams need monitoring designed for silent failures, like systems that detect silent tracking errors, rather than generic uptime alerts alone.
A dashboard can stay green while the underlying measurement is already wrong. That's why analytics incidents need their own playbooks.
Core Components of an Automation Engine
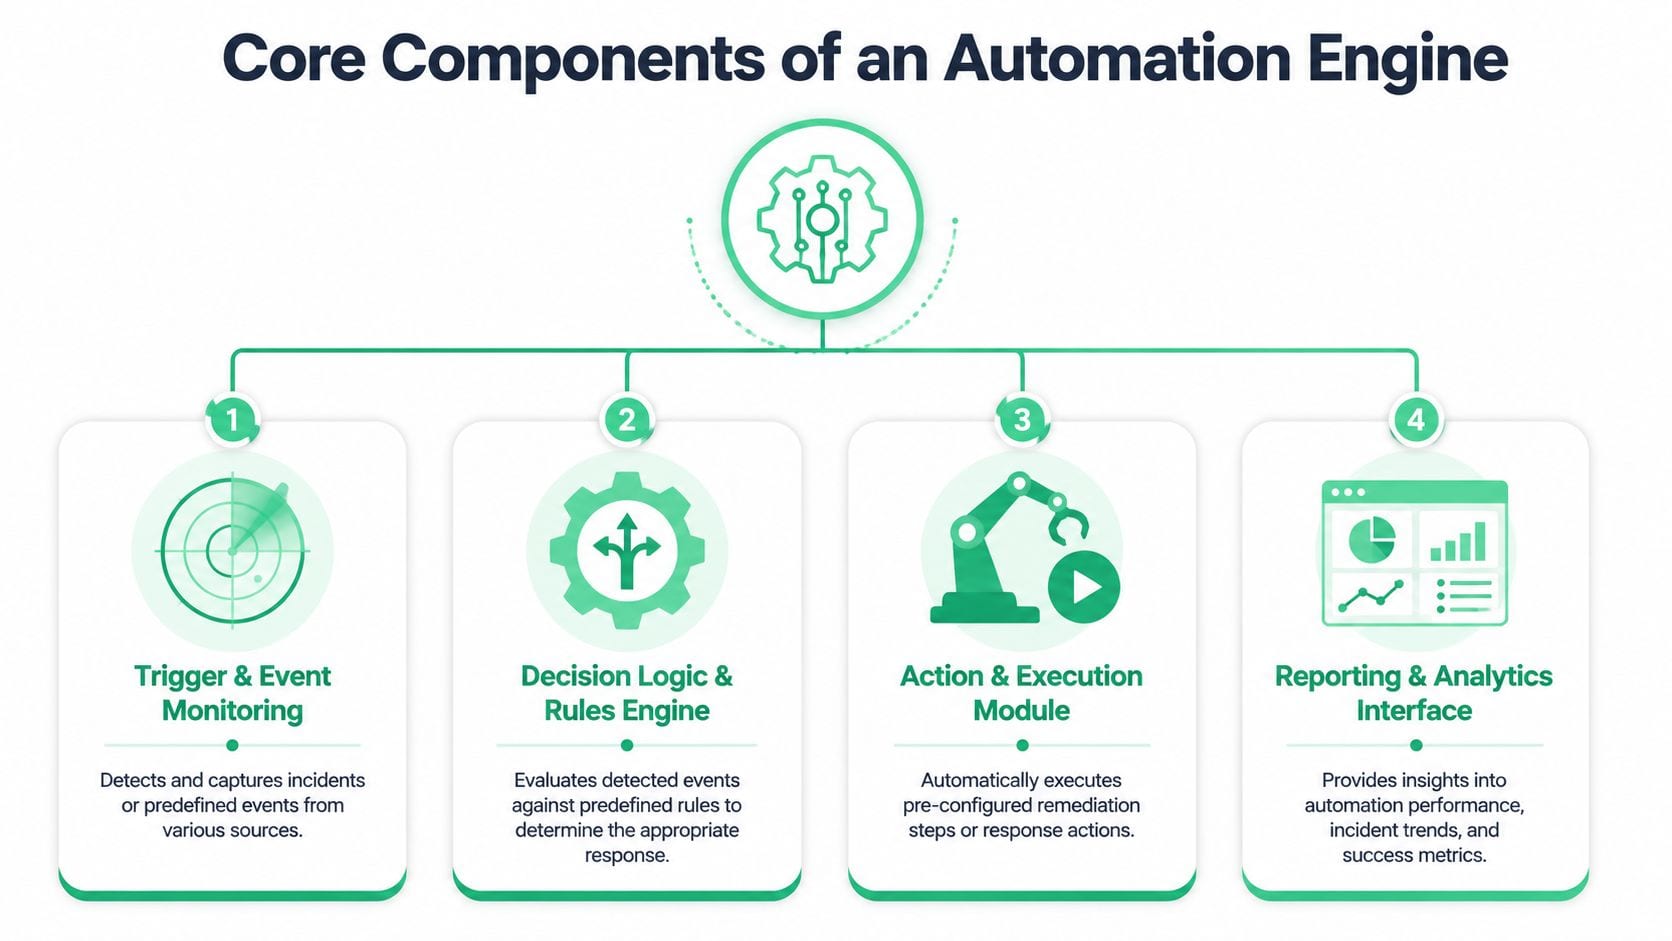
A useful automation engine has four moving parts. If one is weak, the whole workflow gets noisy or unreliable. The easiest way to evaluate a tool or design your own process is to ask four questions: What detected the issue? What context got attached? What logic decided the next step? What action happened?
Detection and enrichment
Detection is the smoke alarm. It watches for missing events, property mismatches, tag disappearance, traffic anomalies, consent violations, or unexpected schema changes. In analytics, good detection can't rely on one signal alone. It needs to compare expected behavior with actual behavior across web, app, and downstream destinations.
Enrichment is what turns a raw alert into something useful. Instead of “purchase event missing,” the system should gather the recent deployment, affected pages, impacted destinations, owner, and whether the issue started after a GTM or SDK change. Without enrichment, automation just creates faster noise.
Orchestration and response
Orchestration is the decision layer. It checks the event against a playbook and decides whether to notify, create a ticket, pause a process, or ask for approval. At this point, mature teams use rule-based workflows, not blind autonomy.
Response is the execution layer. That can mean opening a Jira issue, posting in Slack, assigning the correct owner, attaching evidence, or in tightly controlled cases blocking a faulty release path. If you work with engineering teams, patterns from Capgo for pipeline monitoring are useful because they show how alerts fit into deployment workflows rather than living in isolation.
What a mature stack actually automates
PagerDuty's guidance is a good reference point here. It describes mature incident response automation as centered on SOAR-style orchestration and rule-based playbooks, with automation reducing MTTR by removing repetitive steps such as alert classification, ticket creation, responder assignment, evidence collection, and initial diagnostics. It also recommends automating the highest-volume, lowest-ambiguity cases first while keeping human approval gates for high-impact actions, as outlined in PagerDuty's incident response automation guide.
That principle applies cleanly to analytics. Auto-create tickets for broken event schemas. Auto-route PII leaks to governance. Auto-collect recent release details. Don't automatically disable production tags without guardrails.
A tool worth considering in this layer is Trackingplan's AI-assisted debugger, which is built around analytics observability and root-cause investigation rather than generic infrastructure alerting.
- Automate first: repetitive classification, owner routing, evidence gathering, incident logging.
- Gate carefully: anything that could interrupt data collection, block a release, or affect customer experience.
- Review often: every false positive should refine the rule, threshold, or enrichment logic.
An Automated Workflow in Action
Take a common incident. A developer ships a frontend change before lunch. The site still loads. Checkout still works. But the add_to_cart event now sends a property with the wrong format, and the downstream schema rejects or misclassifies it.
That's the kind of issue that can sit undetected until someone notices a conversion gap in a dashboard or a media buyer asks why cart activity collapsed.
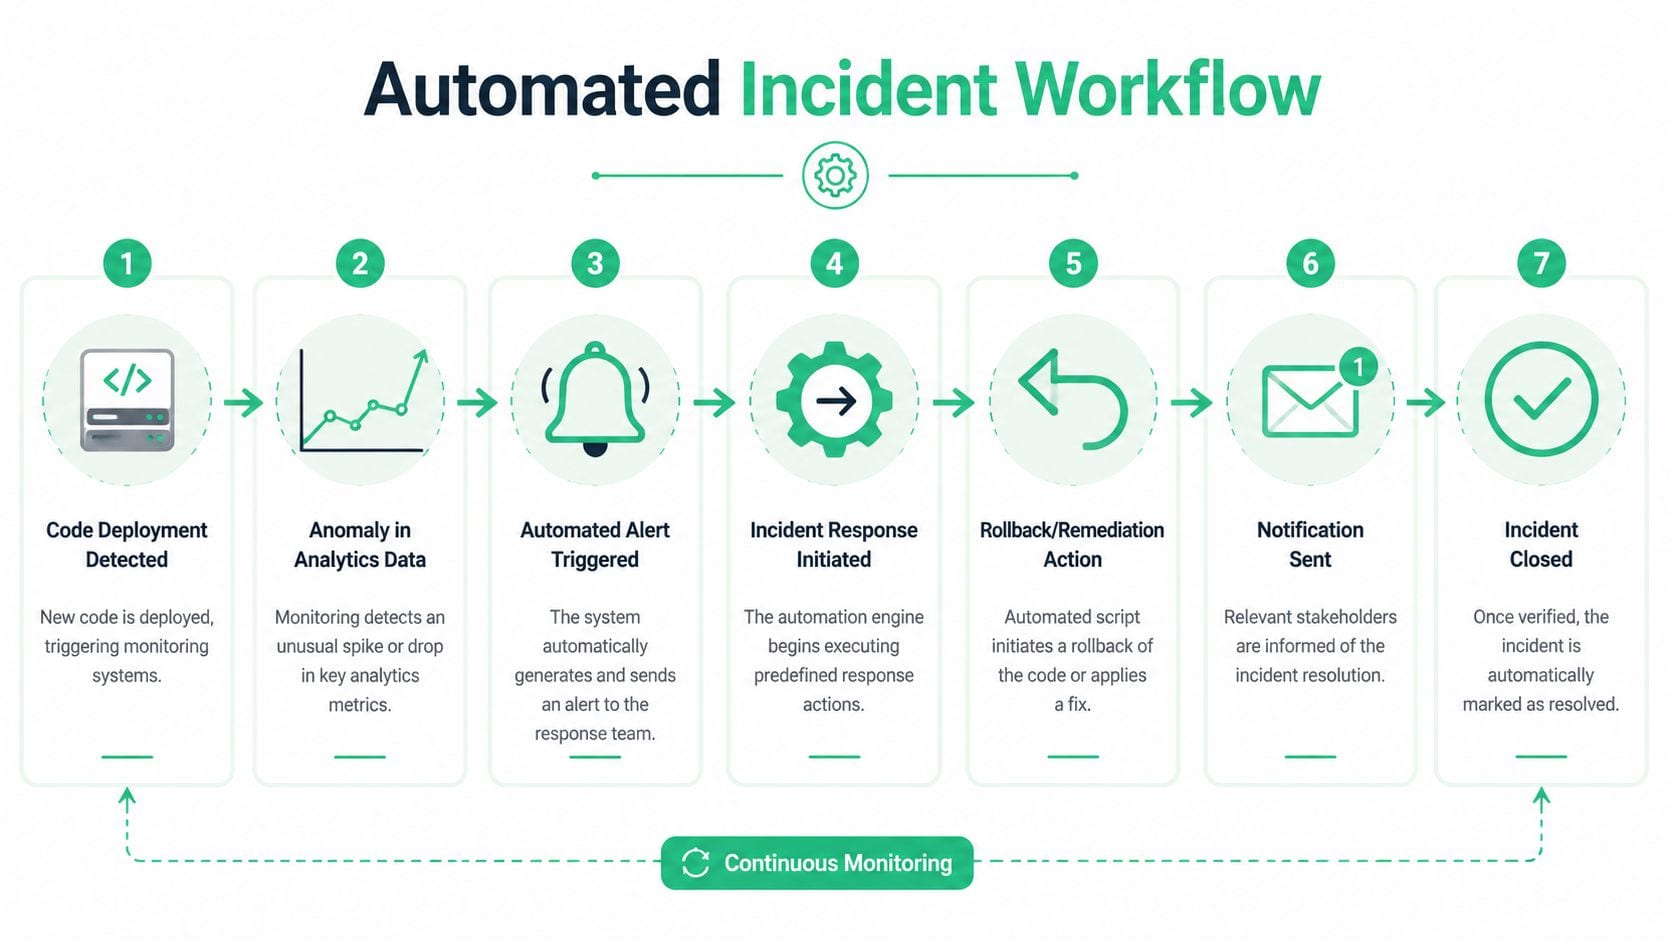
A clean workflow looks very different.
Step one through three
First, monitoring detects the schema mismatch. The event is still present, but one required field changed type or disappeared. Because the baseline is already known, the system flags the issue as a real regression, not just a one-off malformed payload.
Next comes enrichment. The alert checks recent code deploys, tag changes, and affected pages. It identifies that the mismatch started shortly after a release touching the cart component. It also checks which destinations consume the event, such as GA4, Amplitude, Segment, or ad platforms.
Then orchestration kicks in. Instead of dumping a generic warning into a shared channel, the workflow posts a targeted Slack alert to the developer and analytics owner. It includes the event name, broken property, first-seen timestamp, recent deployment reference, sample payload, and impacted destinations.
The best incident alert is the one that already answers the first five questions your team would ask manually.
Step four through resolution
At this point, the system can take several low-risk actions automatically:
- Open the right ticket: Create a high-priority issue with the payload diff and owner pre-assigned.
- Start the timer: If the issue remains unresolved after a defined window, escalate to engineering lead and analytics lead.
- Preserve evidence: Save failing examples, page context, and release metadata for debugging and post-mortem.
- Notify downstream users: Alert teams that rely on the event so they know the metric is under review.
The embedded demo below is useful if you want to see how alerting can look in a real tracking workflow.
Once the developer fixes the payload and deploys again, the workflow verifies that the event now matches the expected schema. It can then resolve the ticket automatically or move it to verification status, depending on how strict your process is.
For teams that still debug these issues manually, a documented step-by-step analytics troubleshooting workflow helps standardize the human part of the process.
Where humans still matter
The point of automation isn't to remove judgment. It's to remove drag. PagerDuty's guidance is especially relevant here: mature teams automate repetitive work and keep human approval gates for higher-impact actions. In analytics, that usually means humans still decide whether to roll back a release, pause a campaign, or quarantine a destination integration.
What works well is simple. Automate detection, evidence gathering, routing, and escalation. Keep human review for actions that can affect production behavior, reporting continuity, or stakeholder communications.
Designing Your Automation Playbooks
A single workflow won't carry a serious analytics operation. You need a library of playbooks, each tied to a failure mode your team sees repeatedly. The best playbooks are specific enough to act automatically and narrow enough to avoid accidental overreach.

Four playbooks worth building first
PII leak containment
This playbook triggers when a payload appears to include email, phone, name, or other prohibited fields in analytics or marketing tags.
The workflow should capture the offending request, identify the page and tag involved, notify the data governance owner, and route engineering review immediately. If your operating model allows it, the playbook can also quarantine the offending tag or destination through a controlled approval path.
Broken UTM governance
UTM incidents are common because campaign launches involve multiple people and external platforms. The issue may not be a technical outage, but it still damages attribution.
A practical playbook does three things well:
- Validate naming rules: Catch malformed or non-compliant campaign parameters.
- Route to the owner: Notify the responsible performance marketer, not a generic ops inbox.
- Protect reporting: Flag the affected traffic so analysts know attribution data needs review.
Rogue event management
As stacks grow, undocumented events multiply. Some are harmless. Others pollute your schema, confuse analysts, and break downstream models.
A rogue event playbook should classify unknown events, compare them against the approved tracking plan, and open review tasks when something new appears unexpectedly. This is one of the highest-value automations because it keeps your implementation from drifting over time.
Missing critical event response
Some events are too important to leave to dashboard review. Purchase, lead submit, trial start, and login success usually belong here.
This playbook should verify that the event drop is real, enrich the alert with release and destination context, and escalate quickly to the owning team. If the issue is tied to one environment, page the right responder. If it's global, involve marketing, analytics, and engineering together.
Design cue: Write playbooks around recurring symptoms, not around org charts. “Missing purchase event” is a stronger trigger than “analytics team workflow.”
What makes a playbook usable
Good playbooks answer three questions in plain language:
- What happened
- Who owns it first
- What action is safe to automate immediately
If the playbook can't answer those clearly, it's still a draft. Teams often overcomplicate this stage by trying to automate every edge case. Start with the incidents that are frequent, easy to define, and costly when missed.
Measuring the ROI of Your Automation Strategy
A broken purchase event at 9:00 a.m. does more than create an analytics ticket. Paid media keeps spending against bad conversion signals, lifecycle campaigns optimize on incomplete data, and the reporting team starts adding caveats to every dashboard. ROI should be measured against that operational mess, not just against faster ticket closure.
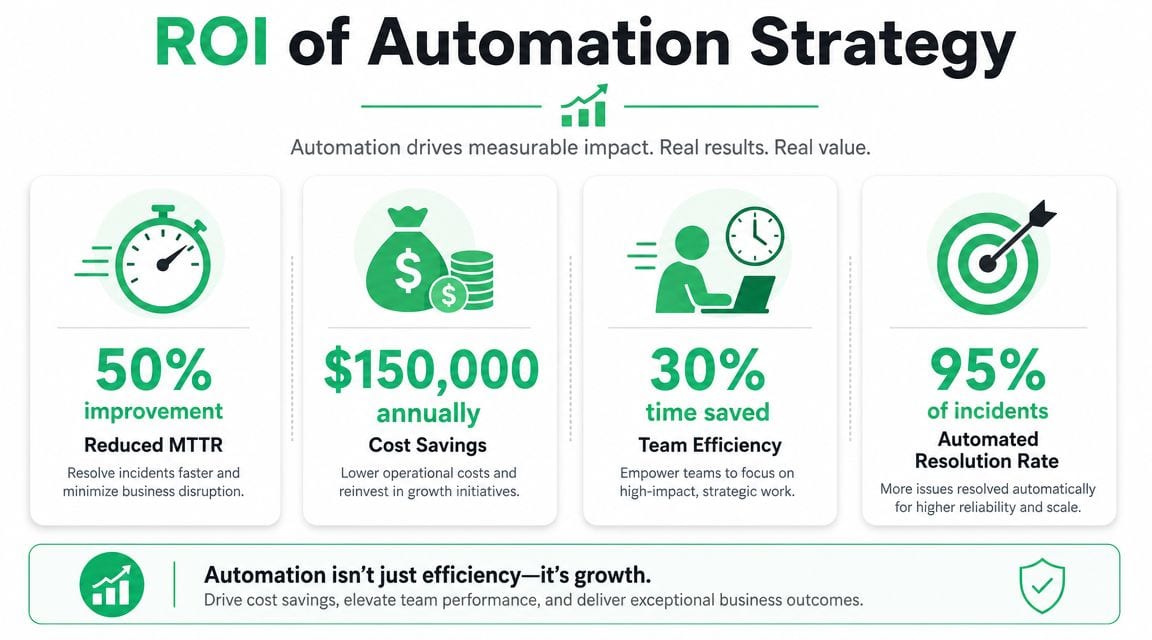
Security teams have spent years proving that automation changes incident economics. The same logic applies here, even if the cost model looks different. For data and growth teams, the return usually shows up in four places: less time operating blind, fewer manual checks, faster owner assignment, and fewer bad decisions made from corrupted tracking.
Metrics that executives care about
- Data downtime: Track how long a key metric, dashboard, or downstream destination stayed unreliable before the issue was detected and contained.
- Manual audit hours avoided: Measure analyst and developer time no longer spent checking tags, payloads, consent states, and campaign configuration by hand.
- Decision confidence: Log how often teams paused reporting, annotated dashboards, or delayed optimization because the underlying data could not be trusted.
- Revenue protection: For incidents tied to conversion tracking or attribution, estimate whether faster detection prevented wasted spend, misallocated budget, or missed retargeting windows.
The strongest ROI models mix hard savings with avoided business impact. If automation cuts two hours of investigation per incident, that is useful. If it also catches a schema break before a high-budget campaign launches, that matters more.
How to report ROI without hand-waving
Use before-and-after comparisons from your own operating history. Show what changed in the workflow: fewer recurring incidents, faster routing to the right owner, less time spent reconstructing release context, and fewer meetings spent arguing over whether the numbers are safe to use.
A monthly review should stay grounded in operational evidence.
One more point matters in practice. Teams trust ROI reporting when it reflects service quality, not just efficiency. That is why support-style operating discipline matters here. The best customer-obsessed support insights map well to analytics incident programs because both depend on clear ownership, fast context gathering, and consistent response under pressure.
If fewer people are getting pulled into fewer avoidable data incidents, and marketing can keep shipping without waiting for a manual audit, the return is real. That is the standard to use.
Implementation Challenges and Best Practices
The hardest part of incident response automation isn't usually detection. It's trust. Teams have been burned by noisy alerts, weak ownership, and brittle rules, so they hesitate to automate anything that touches production data or campaign workflows.
That hesitation is healthy. It keeps teams from over-automating actions they don't fully understand.
What tends to go wrong
Three failure patterns show up repeatedly.
- Alert fatigue: The system flags too many harmless deviations, and people stop responding.
- Weak ownership: The alert reaches a shared channel, but nobody knows who should act first.
- Over-automation: A team tries to automate remediation before it has stable detection and enrichment.
The best implementations stay disciplined. They automate the repetitive mechanics first and build credibility through clean routing and reliable context.
Practices that actually work
Vectra AI reports that organizations using AI and automation extensively save about $1.9 million per breach and shorten the breach lifecycle by 80 days. The same source also notes that NIST SP 800-61 Revision 3, published in April 2025, explicitly endorses automation for alerts, triage, and information sharing, which shows how firmly automation is now embedded in modern response practice, according to Vectra AI's incident response automation coverage.
The lesson for analytics teams is practical, not theoretical.
- Start with one narrow workflow
Pick a high-volume, low-ambiguity incident such as schema mismatch or missing critical event. Get that one right before expanding. - Keep humans in the loop for high-impact actions
Routing, evidence collection, and ticketing are great automation targets. Blocking tags, disabling destinations, or pausing campaign-critical flows usually need approval. - Run post-incident reviews
Every false positive should improve a rule. Every missed incident should expose a detection gap. That's how playbooks mature. - Design for cross-functional response
Analytics incidents often involve marketing, engineering, QA, and privacy. Process quality matters as much as tooling. Teams thinking about service quality more broadly can borrow ideas from customer-obsessed support insights, especially around ownership, escalation, and communication discipline.
Automation works when it removes repetitive work without hiding accountability.
The payoff is bigger than faster debugging. Teams stop acting like emergency cleanup crews. They start operating like stewards of measurement quality, with systems that catch errors early, route them correctly, and preserve trust in the data people use to make decisions.
If your team is tired of finding broken tracking only after dashboards go bad, Trackingplan is worth evaluating. It monitors analytics implementations across web, app, and server-side environments, detects issues like missing events, schema mismatches, campaign tagging errors, broken pixels, and potential PII leaks, and routes that information into a faster response process so analysts, marketers, and developers can fix data errors before they spread.