A smoother path to troubleshooting
Investigating a warning should feel like following a thread, not jumping between tabs. We've redesigned the Warning Overview into a single scrollable page, putting everything you need in one continuous view so you can move from detection to resolution without losing your place.
The Challenge: Tabbed Views Interrupt Your Investigation Flow
When a warning surfaced, the old Warning Overview split its content across multiple tabs — chart, notes, AI analysis, and technical details each lived in a separate section. Every context switch meant another click, another load, and another moment where you lost the thread of what you were investigating.
For teams under pressure to resolve data quality issues quickly, that fragmentation added up. Comparing the trend chart with the AI analysis meant flipping back and forth. Cross-referencing technical fields with your notes required memory, not insight.
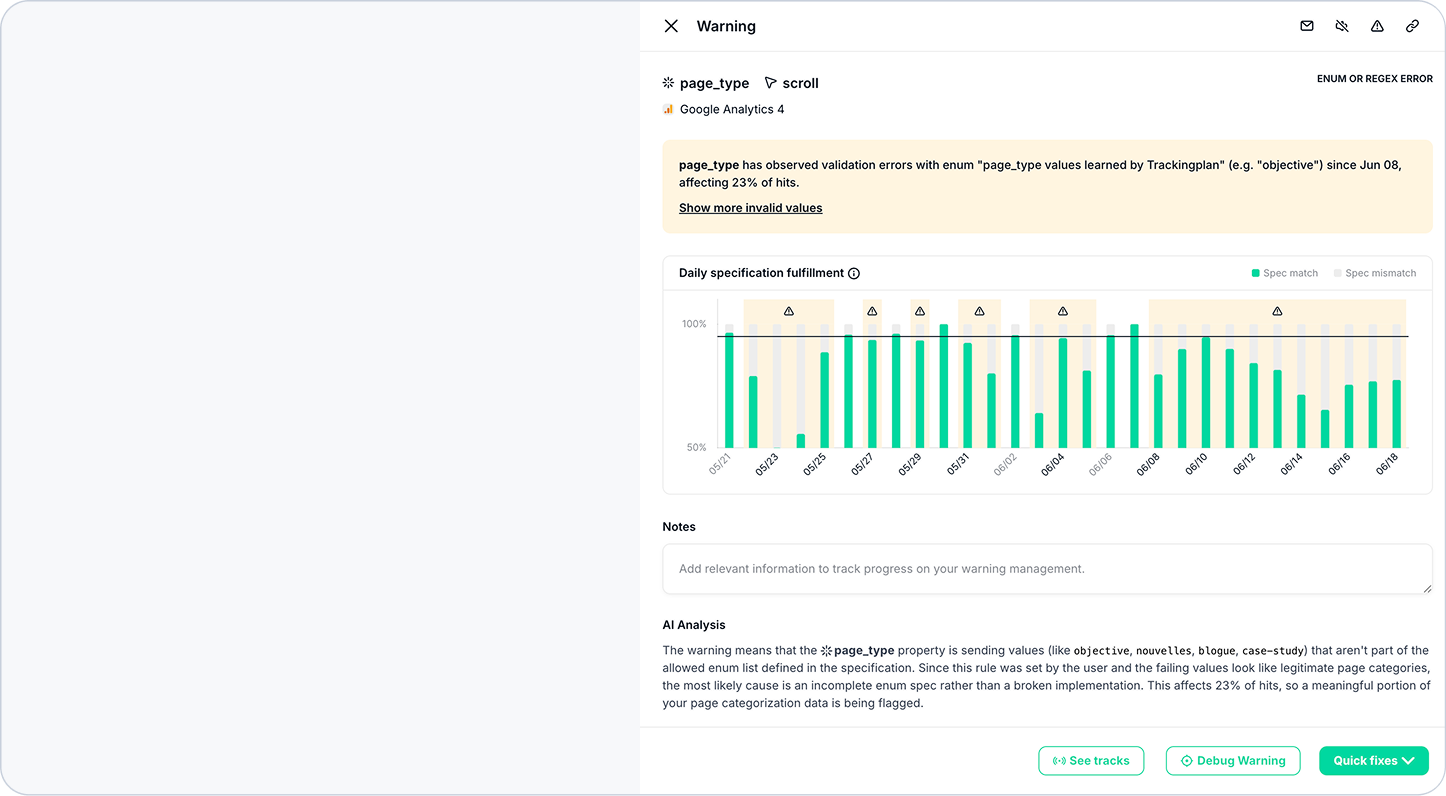
The Solution: Warning Overview as One Continuous Page
We've rebuilt the Warning Overview from the ground up. Everything is now in a single, uninterrupted scroll — and the content inside it is smarter too:
- See the full picture at once — the trend chart, notes, AI analysis, and technical fields all render in one continuous view, with no tabs to navigate.
- Jump directly from AI analysis to the source — event, property, attribution, data-layer, and tag references inside the AI analysis are now clickable links that open the matching sidebar or Data Explorer grouped by that field.
- Stay in context — instead of bouncing between pages to verify what the AI is referencing, you can drill in and come back without losing your place in the investigation.
- Reduce clicks, speed up decisions — every piece of information you need to triage and resolve a warning is now within a single scroll.
How It Works
- Open any warning from your Warnings list to land on the redesigned Overview page.
- Scroll through the chart, notes, AI analysis, and technical details — all in one place.
- In the AI analysis section, click any event, property, attribution, data-layer, or tag reference to open the matching sidebar or jump to Data Explorer filtered by that field.
- Investigate, cross-reference, and resolve — without switching tabs or losing your context.
Who Benefits from the New Warning Overview
- Digital analysts investigating data quality issues can now read the full story of a warning in one pass, without rebuilding context between tabs.
- Developers triaging technical warnings get faster access to the underlying fields and references they need to diagnose the root cause.
- Marketing and performance teams reviewing AI analysis can immediately verify the events or properties flagged, keeping campaign data trustworthy with less back-and-forth.
The redesigned Warning Overview is live now. Log in at Trackingplan and open any warning to see the new layout.
Need further assistance? Our support team is here to help!
Happy Tracking!