
You can feel a campaign slipping before anyone says it out loud. The dashboards are green, the team is posting the weekly update, and the first real question comes later, when finance asks whether the spend paid back or whether the conversions were just the last visible click in a messy journey. That gap is where campaign measurement either becomes a trustworthy operating discipline or collapses into reporting theatre.
Strong measurement doesn't start with a dashboard. It starts with a clear outcome, a tagging contract that survives handoffs, and a QA layer that catches drift before the numbers reach leadership. If the identifiers, events, and attribution rules are shaky, the report can look polished and still be wrong.
Why Campaign Measurement Breaks Before Anyone Notices
A campaign can look successful for weeks while the underlying data drifts away from reality. A pixel stops firing after a site update, a CRM import rewrites source data, or someone renames campaign parameters in a hurry because the launch is already late. The dashboard still fills up, but the story it tells is no longer the one the business needs.
That's why campaign measurement is not just reporting. It's the full chain from objective to tag to event to attribution to decision, and each layer has a different owner. Marketing defines the business goal, analytics defines the measurement logic, engineering and implementation teams wire the event flow, and QA checks whether the data still matches the plan.
Practical rule: if you can't name the business outcome first, you're not measuring a campaign, you're collecting activity.
The biggest confusion happens when teams treat captured data as if it were the same thing as business impact. A click, a conversion, and a sale are not interchangeable, and they don't carry the same meaning once channels assist each other or attribution windows overlap. Commercial impact is better validated with incrementality testing and media mix modeling, because those methods estimate incremental sales rather than just last-click conversions, and that matters when channels help each other instead of acting alone (Quikly).
A clean working definition helps. Campaign measurement is the discipline of tying a campaign to a specific outcome, capturing the right events with consistent identifiers, validating whether the data is complete, and choosing the right method to judge impact. If any one of those pieces is weak, the result can be tidy-looking numbers and unreliable decisions.
Core Metrics and the Three-Layer Measurement Pyramid
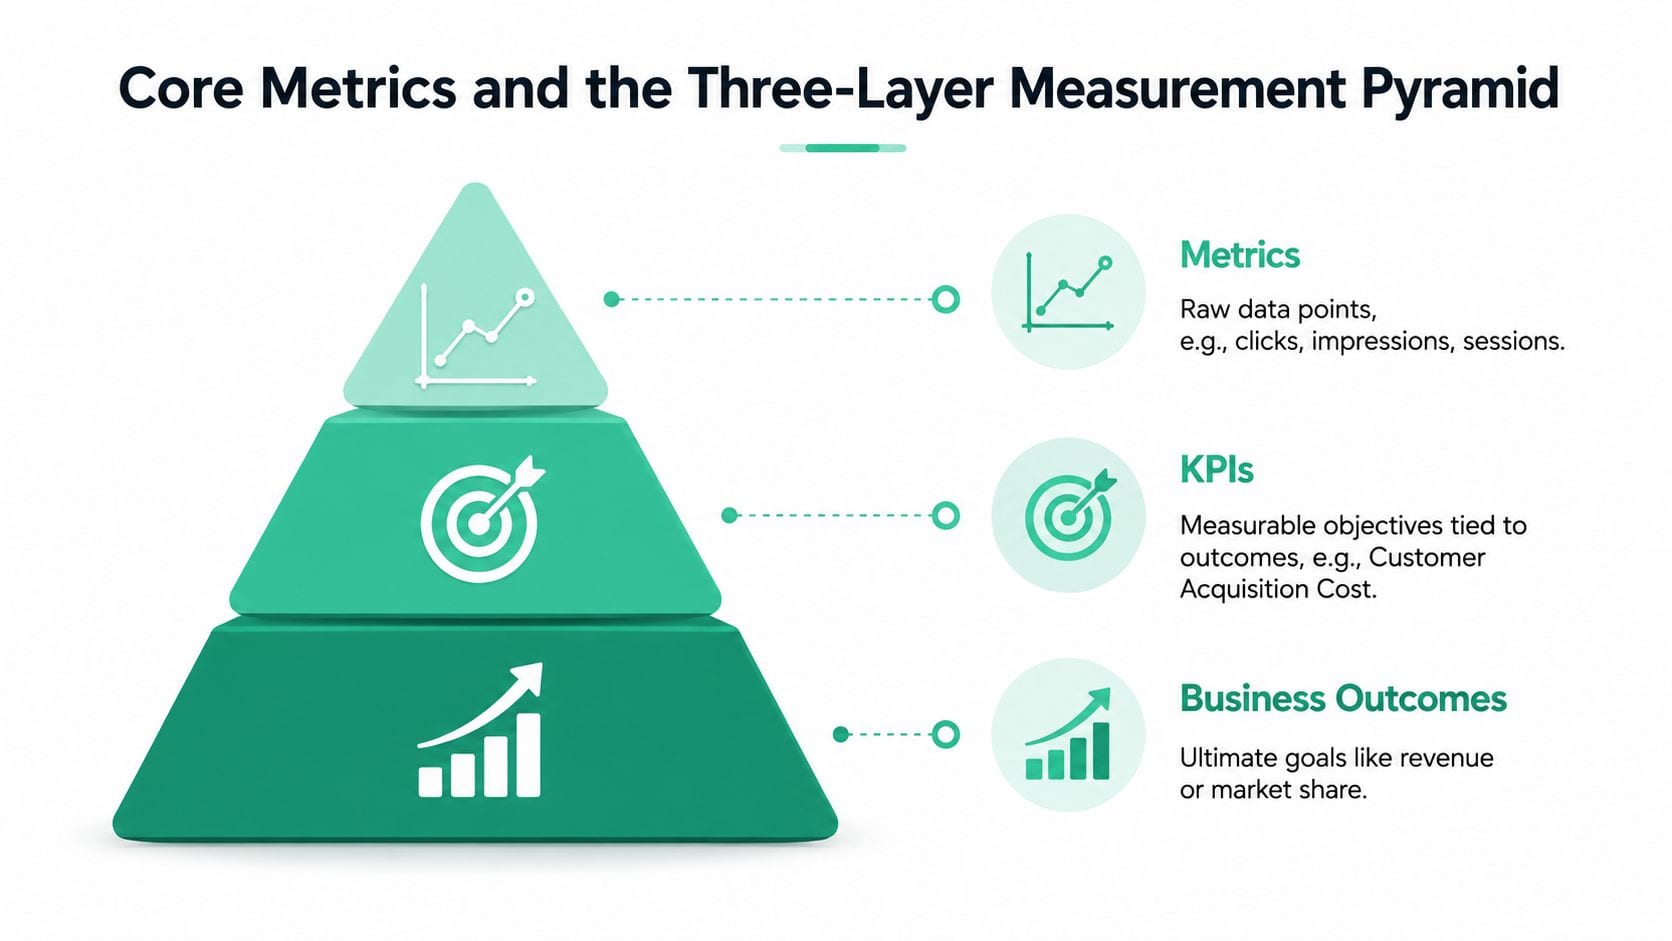
The cleanest measurement systems separate raw metrics, KPIs, and business outcomes. That sounds simple, but teams blur those layers all the time, then wonder why a high CTR campaign still fails to win budget. The fix is to assign each layer a job and stop asking one number to do all of them.
Business outcomes come first
Siteimprove frames measurement around three questions, what outcome the campaign should influence, how that influence will be measured directly, and what minimum return justifies the spend (Siteimprove). That's a useful discipline because it forces the team to choose a primary business result before they start debating channel tactics. It also helps separate business-impact metrics such as CAC, CLV, ROMI, and revenue attribution from campaign performance metrics such as conversion rate, CPA, MQLs, and channel attribution.
The UK Department of Health and Social Care's Campaign Resource Centre defines KPIs as measurable objectives within a campaign, which is the right mental model for teams that keep mixing up activity and impact (DHSC). A KPI isn't just a metric you like. It's the measurable target that maps back to the objective.
The three layers that keep teams aligned
A practical pyramid helps every stakeholder look at the right layer:
- Executive layer: ROMI, revenue, and other outcome-level signals.
- Operational layer: channel and campaign performance, such as CPA, MQLs, and conversion rate.
- Tactical layer: creative, audience, placement, and variant-level behavior.
That structure keeps a CFO from getting buried in click data and keeps a media buyer from being judged on annual revenue alone. It also reduces the common trap of optimizing for easy-to-move tactical numbers while the campaign drifts away from the business goal.
If you want a concrete example of how channel-level thinking plays out in ecommerce media planning, PPC strategies for Amazon sellers is a useful reference because it shows how campaign structure and performance reporting have to stay tied together. The point isn't the channel itself, it's the discipline of matching the metric to the decision.
Attribution Models and Where Each One Misleads You
Attribution is where many teams feel most confident and get misled fastest. The model looks mathematical, the dashboard looks complete, and the answer still depends on assumptions that aren't always visible. The question is not which model is perfect, because none of them are. The question is what kind of bias you can tolerate for the decision you need to make.
How common models distribute credit
Last-click gives all the credit to the final interaction. It's easy to explain, easy to defend in a short meeting, and biased toward bottom-funnel channels that close the session rather than build demand.
First-click does the opposite, so it over-rewards the channel that started the journey and can understate the role of retargeting, branded search, or sales follow-up. Linear spreads credit evenly, which is fair in spirit but can flatten meaningful differences between touchpoints. Time-decay favors recent interactions, which can be useful for shorter cycles but can still miss the value of early education.
Position-based puts heavier weight on the first and last touches, with less weight in the middle. It recognizes that introduction and conversion often matter more than intermediate nudges, but it still encodes a guess about what “matters most.” Data-driven attribution is more flexible because it weights touchpoints algorithmically, but it depends on clean event data and enough conversion volume to be statistically valid.
What the model choice changes
The core trade-off is simple. Simpler models are easier to defend, but they reward whichever channel happens to sit closest to the conversion. More advanced models can be more accurate, but they depend on a stitched customer view and reliable event data.
A good way to pressure-test platform defaults is to ask what the model would say if a channel assisted demand without closing it. Last-click usually undervalues that work. First-click can inflate it. Linear can make weak touches look stronger than they are. That's why the practical conversation with a CFO shouldn't be “which model is right,” it should be “which model is least misleading for this buying cycle.”
For a deeper platform-level comparison, the internal guide on GA4 attribution models is worth reading alongside your own reporting setup. The important habit is not memorizing model names, it's understanding the bias each one introduces before you commit budget based on it.
UTM Conventions and the Tagging Contract
UTM tagging works best when everyone treats it like a contract, not a convenience. Marketing writes the campaign, analytics defines the naming rules, and growth or ops teams have to trust that the same link will still mean the same thing when it lands in the CRM, the ad platform, and the web analytics stack. If the naming drifts, the data still arrives, but it stops joining cleanly.
The standard UTM parameters, source, medium, campaign, term, and content, only help when they follow fixed conventions. Lowercase only, no spaces in campaign names, and stable source and medium taxonomies are the basics. A unique campaign ID helps tie cost data to exposure data, especially when multiple systems rename or flatten the original string.
A campaign name by itself is rarely enough. Add start and end dates, channel metadata, and a unique ID if you want reconciled cost, exposure, and conversion data across web, app, CRM, and ad platforms.
That identifier discipline matters because attribution windows and cross-system joins become unreliable when the tags aren't consistent. The result is not just messy reporting, it's weaker ROI analysis and worse channel-performance decisions. A technically sound campaign-measurement stack should standardize a campaign name or unique ID plus start and end dates and channel metadata so cost, exposure, and conversion events can be reconciled across systems, and the absence of those identifiers weakens attribution windows and cross-system joins (Zigpoll).
A useful way to review new URLs before launch is to ask four questions. Does the link use the approved source and medium values, does the campaign name match the taxonomized pattern, does the ID map to the cost sheet, and can the analytics team reconcile the click with downstream conversion events? If the answer is no to any of those, fix the link before spend starts.
For a naming and validation checklist that fits into launch workflow, the internal guide on UTM parameter best practices is a good companion to your own template. The goal is simple, every link should mean the same thing everywhere it appears.
Incrementality Testing and Media Mix Modeling
Attribution tells you which touchpoint got the credit. Incrementality testing and media mix modeling ask a different question, whether the campaign caused the outcome. That distinction matters because clicks, conversions, CPA, and ROAS can all look persuasive while still overstating causal impact.
Where experiments fit
Incrementality testing is the cleanest way to ask, “What changed because we ran this?” Teams use holdouts, geo splits, audience splits, ghost ads, and switch-back designs to compare exposed groups with controls. The exposed group gets the full campaign or a fuller version, the control group gets a pared-down version or none at all, and impact is measured by the difference in action rates between the two groups, as described in DemandScience.
That method is especially useful when a platform reports strong ROAS but the lift is unclear. It gives you a causal check against the attribution report. MAP Research also separates campaign activity, creative effectiveness in recall and awareness, and the final outcome in thinking or behavior, which is a useful reminder that not every campaign is built to close on the first visit (MAP Research).
Where MMM fits
Media mix modeling sits at the other end of the spectrum. It uses historical data to estimate how channels contributed to outcomes over time, which makes it useful when you need a broader view across channels, seasonality, and spend patterns. It does not replace experimentation, it answers questions that experiments cannot always answer cleanly.
That broader lens is also why MMM depends so heavily on clean inputs. If spend, exposure, or conversion data drift across systems, the model can still produce a neat line fit while reflecting the wrong story. Analysts who treat MMM as a black box usually inherit that error, then spend time explaining why the forecast changed after a tagging cleanup instead of after a media change.
The practical choice depends on budget, channel mix, and data maturity. If you have enough signal and a discrete question, test it. If you need portfolio-level allocation guidance, model it. If you need both, use attribution for directional optimization, then use experimentation and MMM to validate whether the apparent lift is real.
For analysts who want a deeper modeling primer, the internal guide on marketing mix modeling is a solid place to connect the math to real media decisions. For a complementary view on how measurement discipline depends on monitoring and production checks, see Rite NRG's approach to observability. The lesson is to stop treating attribution, testing, and modeling as competitors. They answer different questions.
Implementation, Observability, and Analytics QA
Most measurement failures don't start in the dashboard. They start in the implementation layer, where a tag fires late, a schema changes without notice, or a destination receives a field in a different shape than the source intended. By the time someone notices the report looks strange, the campaign has already spent money against broken instrumentation.
What a healthy setup looks like
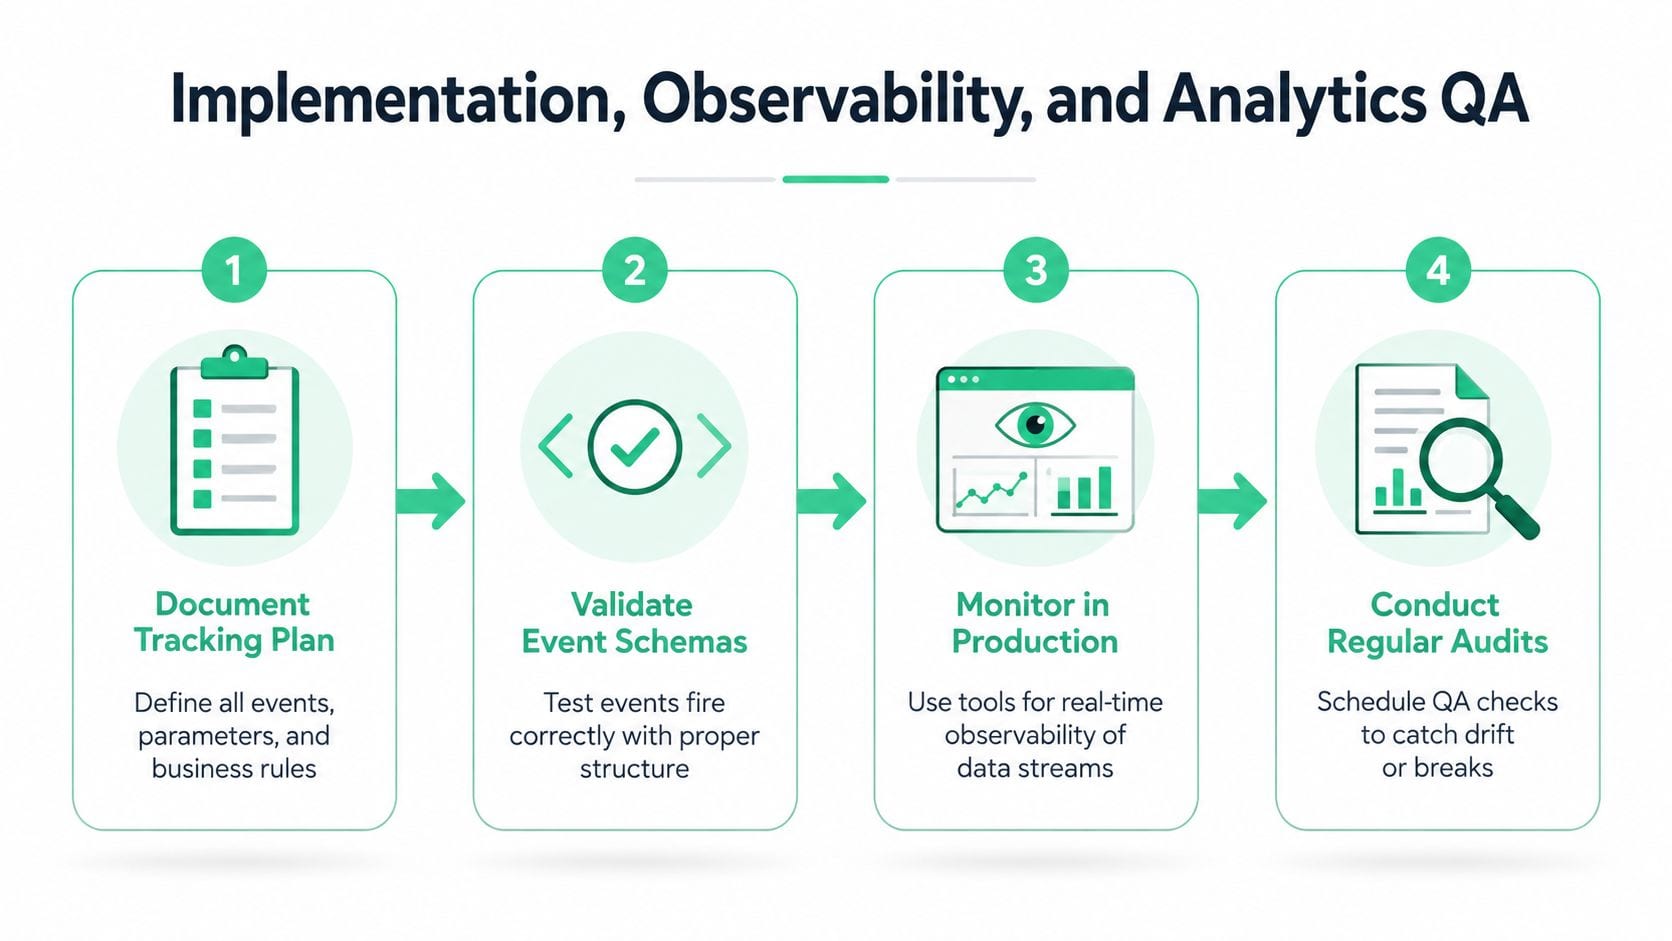
A healthy implementation begins with a tracking plan that functions as a living source of truth. It should document events, parameters, business rules, and the systems that receive them, then keep that documentation in sync as the stack changes. A good plan also distinguishes client-side and server-side tagging and checks that they reconcile instead of diverging without notice.
Observability is different from a one-time test suite. Unit tests can prove a single event fires in a controlled environment, but observability watches production traffic for missing events, rogue events, schema mismatches, and UTM drift after launch. That monitoring belongs in the same operational workflow as campaign deployment, because a campaign that launches without QA is only partially launched.
Practical rule: if your reporting team learns about a tracking issue from a dashboard screenshot, your observability is too late.
The internal guide on automated marketing observability is relevant here because it reflects the same operating model, continuous checks rather than manual spot audits. For teams that want to compare tooling approaches to observability more broadly, Rite NRG's overview of monitoring and observability is a useful adjacent read.
Why this layer changes the rest of measurement
A measurement strategy is only as good as the events feeding it. If event names drift, if properties are missing, or if destination schemas no longer match source payloads, attribution and dashboarding become downstream guesses. QA is not separate from measurement. It is the part that keeps measurement honest.
Trackingplan is one tool that sits in this layer, because it continuously discovers Martech implementations and monitors analytics, marketing, and attribution pixels for anomalies, schema issues, campaign tagging errors, and consent or PII problems. That's the sort of control point teams need when the issue is not whether to measure, but whether the data can still be trusted.
Common Failure Modes That Quietly Corrupt Campaign Data
The most dangerous measurement problems are usually boring. They don't crash the site, and they don't trigger a dramatic alert in the business. They just make the campaign look stronger or weaker than it really is.
The recurring breakpoints
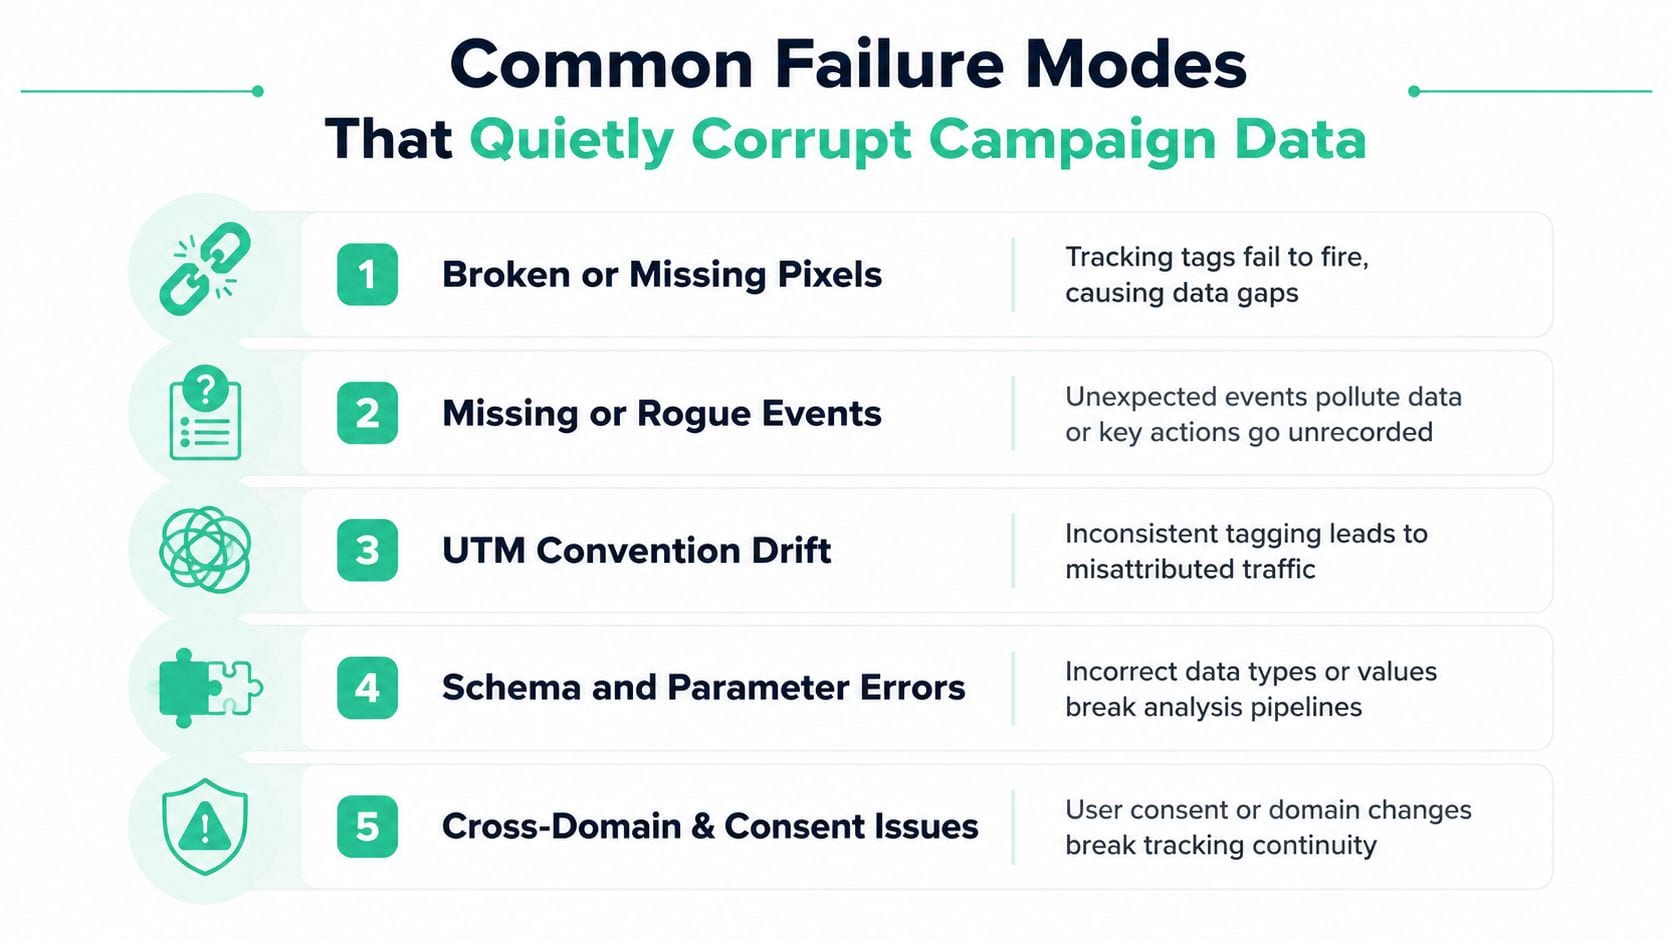
- Broken or missing pixels. A browser update, a tag manager change, or a page template edit can stop a conversion tag from firing, and the symptom is usually a sudden drop in recorded conversions without a matching drop in site activity.
- Missing or rogue events. A key event never appears, or a new event starts showing up unexpectedly and pollutes the dataset, which makes funnel analysis harder than it should be.
- UTM convention drift. A new hire decides that “paid-social” and “paidsocial” are interchangeable, then the source breakdown fractures across two labels.
- Schema and parameter errors. A field type changes, a required property goes null, or one system writes a different naming convention into the destination, and the pipeline still runs while the analysis gets noisier.
- Cross-domain and consent issues. A consent change, a domain handoff, or a session boundary breaks continuity, so users look like new visitors when they aren't.
The symptom to watch is the mismatch between what the campaign did and what the data claims it did. If spend is stable but conversions swing without a business explanation, check instrumentation before you blame creative. If traffic looks healthy but campaign IDs don't reconcile in the CRM, look for tag drift or field overwrites.
That's especially important when the data is fragmented or control groups aren't available, because the temptation is to over-interpret partial evidence. A 2024 peer-reviewed public-health evaluation paper and a recent industry guide both point to the difficulty of measuring digital campaign impact cleanly when data is incomplete or controlled comparisons are unavailable, which is exactly why QA has to happen before analysis, not after it (SAGE Journals).
Reporting, Dashboards, and Integration Workflows
A reporting stack only makes sense if it matches how different teams make decisions. Executives need business outcomes, operators need channel and campaign health, and tacticians need creative and audience detail that explains movement inside the campaign. One dashboard can hold all three views, but if it tries to answer all three questions at once, it usually ends up answering none of them well.
What belongs in each layer
| Layer | What It Owns | Most Common Failure | QA or Observability Signal |
|---|---|---|---|
| Executive | ROMI, revenue, and outcome-level performance | Overfitting to short-term signal | Revenue attribution mismatch across systems |
| Operational | Channel and campaign performance, such as CPA, MQLs, and conversion rate | Broken joins between spend and conversion data | Missing campaign IDs or delayed event sync |
| Tactical | Creative, placement, audience, and variant insights | Tagging drift across tests and variants | Unexpected UTM labels or schema mismatches |
That table is only useful if the integrations behind it hold together. Analytics platforms, ad platforms, and CRM systems need stable mappings, and the tracking plan has to change with the stack as new sources or destinations appear. The practical rhythm is straightforward, centralize data, compare KPIs against goals, benchmark against prior performance or relevant external references, segment results by demographic or geography, and audit the data regularly. That approach keeps the team focused on numbers they can trust, rather than reports that look polished but rest on shaky joins or stale assumptions.
Keeping the workflow dependable
A reliable reporting workflow follows a simple sequence. Data lands from the source platforms into a centralized layer, the IDs are checked against the campaign taxonomy, the dashboards refresh on the cadence that matches decision speed, and QA checks watch for mismatches between sources. If the CRM says one thing and the ad platform says another, that difference should trigger investigation, not a confident story for leadership.
Governance is the part teams often postpone. A tracking plan should be updated whenever a new channel, event, or destination enters the stack, otherwise the dashboard starts relying on memory instead of documentation. That is how teams end up defending numbers they cannot fully explain, even when the charts themselves look clean.
If your team keeps finding tracking issues after the report has already been shared, put observability ahead of the dashboard. Trackingplan continuously monitors campaign tags, events, and analytics changes so teams can catch drift before it becomes bad attribution or bad decisions. If you want to make campaign measurement more trustworthy across web, app, CRM, and ad platforms, review how it fits into your stack.