
A merchandising team opens its weekly dashboard and sees a familiar warning: units sold per week have fallen. The team assumes demand is weakening, pauses replenishment, and prepares markdowns. A later review reveals that the product was unavailable during part of the reporting period. The dashboard treated those stockout weeks as evidence of weak demand, even though customers had no inventory to buy.
That failure is more common than it looks. Rate of sale is only as reliable as its definition, denominator, and source events. Teams can confuse a continuous demand-velocity measure with sell-through, average across periods when inventory was unavailable, or rely on dashboards that omit sales transactions. The result is a number that describes measurement conditions rather than customer demand.
Why Rate of Sale Decisions Go Wrong
Rate of sale decisions usually fail before anyone calculates the formula. The underlying question gets lost. A buyer may want to know how quickly a SKU sells while it's available, while a finance partner may want to know how efficiently inventory supports revenue. Both questions can involve “rate of sale,” but they require different measures and different data.
Consider a product that sells consistently whenever it's on the shelf. If the product is out of stock during several reporting periods, a basic average that counts those periods as zero-sales weeks will make demand appear weaker than it is. Independent retail guidance recommends removing weeks with no stock when calculating true demand, because stockout periods can understate rate of sale and distort replenishment decisions in the rate of sale glossary.
The dashboard label creates risk
A second problem appears when teams use rate of sale and sell-through rate as interchangeable labels. Rate of sale commonly expresses units sold during a time period, often units per week. Sell-through expresses the share of received inventory that sold, using the formula units sold / units received × 100 as described by Lightspeed's sell-through rate guidance.
Those figures can move in opposite directions. A product may sell quickly but have a low sell-through percentage if the initial receipt was large. Another product may show a high sell-through percentage after selling a modest number of units from a small shipment. Calling both metrics “velocity” hides the business question and encourages the wrong action.
Practical rule: Never approve a markdown, reorder, or assortment change until the dashboard shows the metric definition, eligible selling periods, and inventory availability used in the calculation.
Data quality is part of the metric
A rate of sale dashboard depends on more than a sales table. It needs reliable transaction events, inventory availability, dates, SKU identity, location, and channel. If an ecommerce purchase event fails while the order still enters the warehouse system, the analytics view will undercount demand. If a product identifier changes between the point-of-sale system and the warehouse feed, sales may be assigned to the wrong item or disappear from the join entirely.
The operational consequence is significant. A false decline can trigger markdowns and reduce future availability. A false increase can cause over-ordering. Precise definitions and validated event data aren't technical details around the metric. They determine whether the metric reflects demand or error.
Rate of Sale Formulas and What They Measure
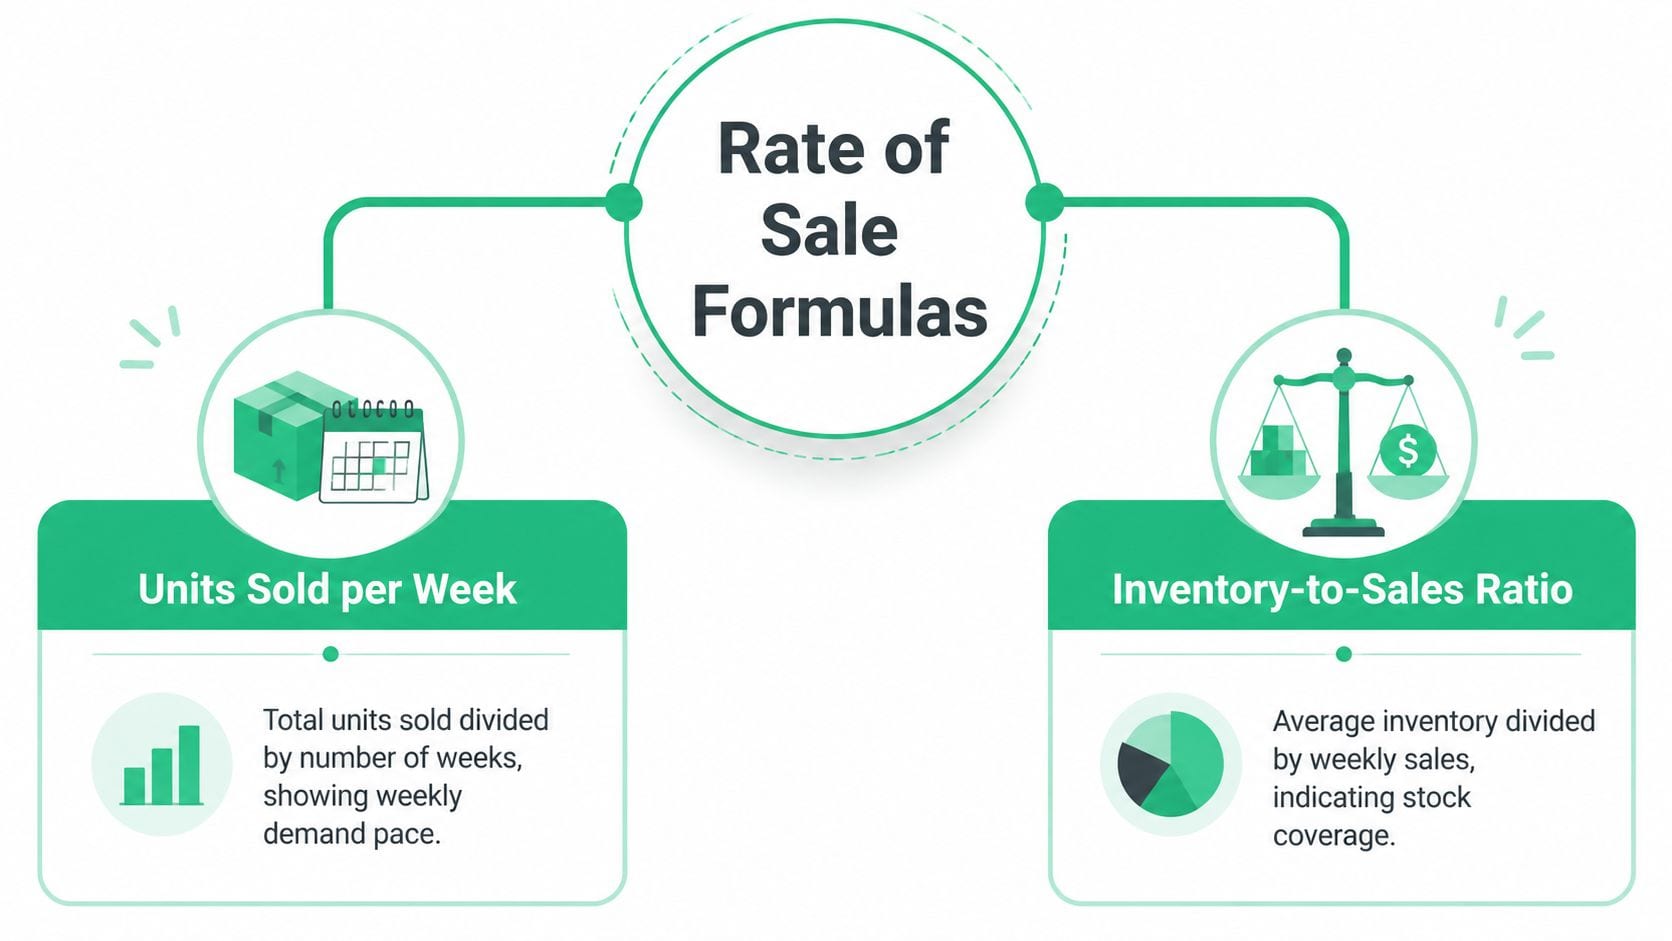
Retail teams commonly use two complementary views. The first measures sales velocity directly, while the second assesses the relationship between inventory and sales. A third measure, sell-through rate, adds a percentage view of how much stock from a receipt has moved.
Units sold per time period
The straightforward formula is:
Rate of sale = total units sold / eligible time periods
If a SKU sells 120 units over 8 weeks, its observed rate of sale is 15 units per week. This answers a practical demand question: how many units does the business sell during an eligible week?
The denominator needs a business rule. If the same SKU sold 120 units, but it was out of stock for 3 of the 8 weeks, dividing by all 8 weeks produces 15 units per week. Excluding the unavailable weeks leaves 5 eligible weeks, producing 24 units per week. The raw sales total hasn't changed. The interpretation has.
This is why a dashboard should expose both units sold and available selling time. A single average can't tell a planner whether sales slowed or supply disappeared.
Inventory-to-sales ratio
The inventory-to-sales ratio takes a different perspective:
Inventory-to-sales ratio = inventory / sales
In U.S. retail, FRED's seasonally adjusted retail series recorded a ratio of 1.23 in June 2026, meaning retailers held about $1.23 of inventory for every $1 of sales. The same series recorded 1.81 in January 1992, showing a long-run decline in the inventory needed to support each dollar of sales, according to FRED's retail inventories-to-sales series.
A related FRED unadjusted series places U.S. retail inventories to sales at 1.23 in June 2026, with a seasonally adjusted figure of 1.25, as reported in FRED's retail inventories-to-sales data. A rising ratio generally indicates that inventory is accumulating faster than sales, while a falling ratio suggests faster sell-through or tighter stock control. It's a supply-demand balance signal, not a substitute for SKU-level weekly demand.
For a broader KPI framework, analysts can also use this retail analytics KPI guide. Marketplace teams may need additional SKU context, such as the Amazon Sales Traffic breakdown, before combining channel results.
Sell-through answers another question
Sell-through is usually expressed as:
Sell-through rate = units sold / units received × 100
It asks, “Of the inventory received, how much has sold?” It's useful for evaluating a batch, season, or receipt, but it doesn't describe weekly demand pace by itself. A rate of sale is a count over time. Sell-through is a percentage of an inventory base.
Rate of Sale vs Sell-Through Rate vs Inventory Turnover
These three metrics describe different forms of retail efficiency:
- Rate of sale measures demand velocity, usually in units per week.
- Sell-through rate measures the share of received inventory sold during a defined period.
- Inventory turnover measures how many times inventory is replaced, calculated as COGS / average inventory.
Inventory turnover is especially sensitive to category economics. Retail benchmarking places annual turnover norms at 14 to 20 times for grocery and supermarkets, 6 to 10 times for consumer electronics, 4 to 6 times for apparel and fashion, and 2 to 4 times for home and furniture, according to Retail Ops Toolkit benchmarks. These ranges show why a generic “good” velocity target can mislead. Grocery demand frequency and shelf-life create a different operating model from furniture.
Match the metric to the decision
| Metric | Formula | Best For | Measurement Cadence |
|---|---|---|---|
| Rate of sale | Units sold / eligible time periods | Replenishment and demand pacing | Continuous or rolling reporting |
| Sell-through rate | Units sold / units received × 100 | Markdown timing and receipt performance | Fixed checkpoints |
| Inventory turnover | COGS / average inventory | Capital and stock efficiency | Periodic financial or operational review |
Sell-through reporting is commonly evaluated at 4 weeks, 8 weeks, or a full season, according to this retail sell-through reporting explanation. Rate of sale, by contrast, can update as new transactions and availability records arrive. Applying a checkpoint-based sell-through cadence to a demand-velocity dashboard can conceal a stockout or a sudden demand change between reviews.
Use the metric that fits the action
For replenishment, rate of sale is usually the most direct input because planners need a pace of demand while inventory is available. For markdowns, sell-through adds context because the question concerns how much of a receipt remains unsold. For assortment planning, inventory turnover helps compare the capital burden of categories, while rate of sale helps identify individual products gaining or losing traction.
Amazon operators evaluating capital efficiency can consult this explanation of Amazon inventory turnover rate. The important discipline is to keep the labels separate. A dashboard that calls a percentage “rate of sale” can send a replenishment team toward the wrong threshold.
How to Calculate Rate of Sale Correctly
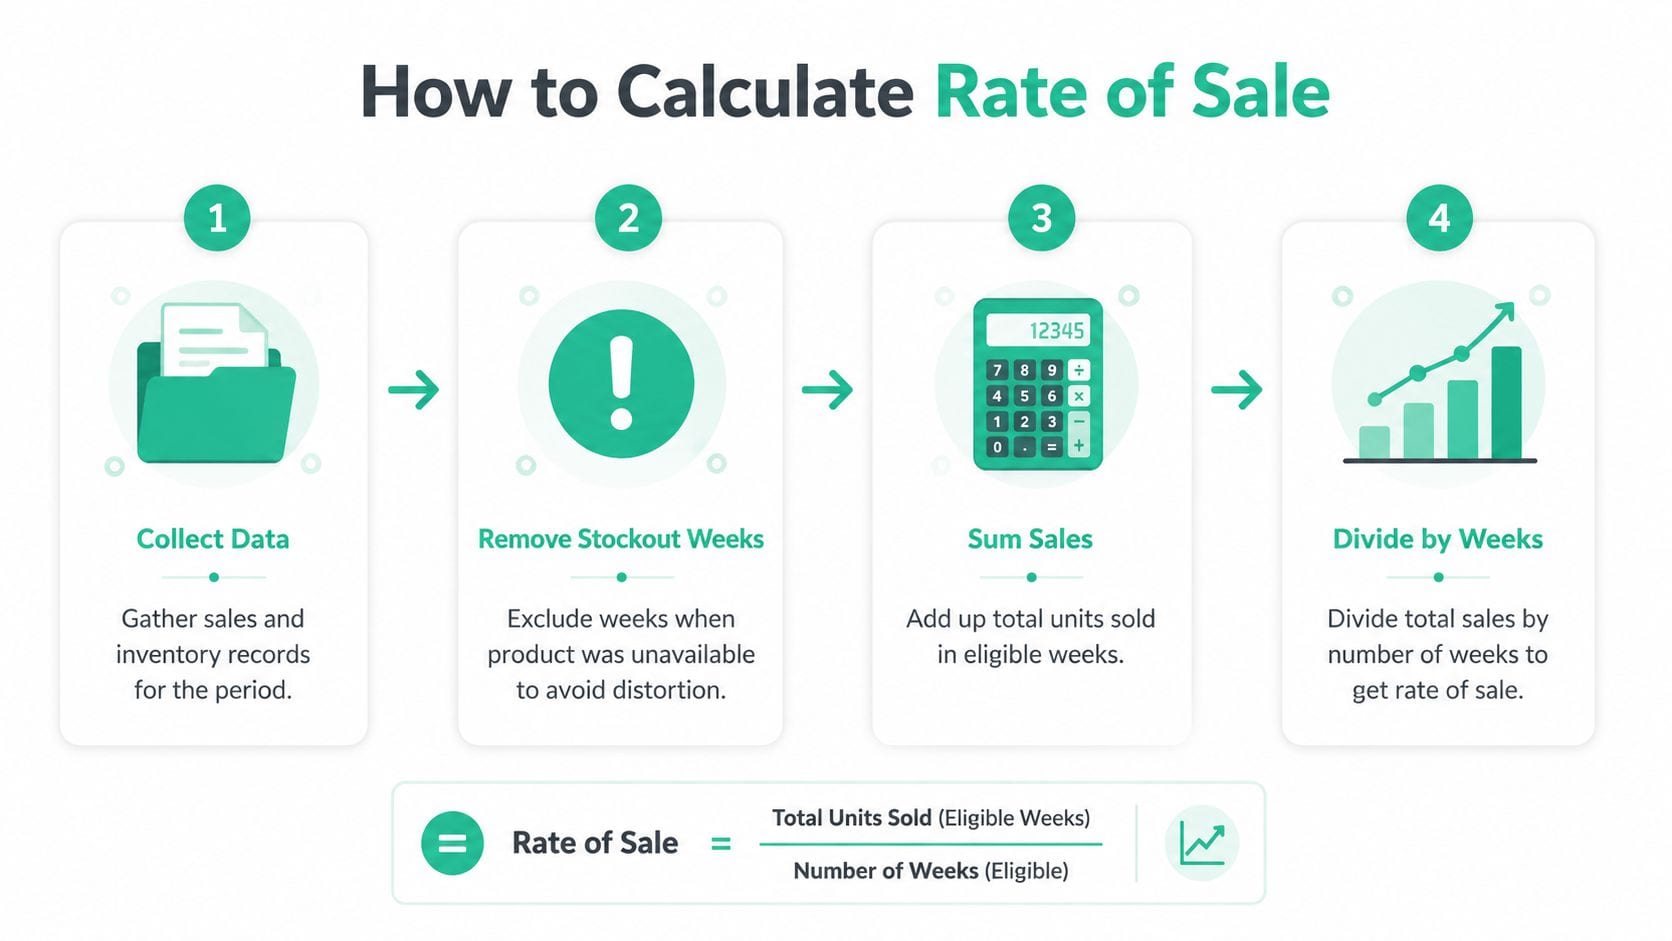
A defensible calculation starts with availability, not division. The process below creates a rate that reflects the periods when customers could purchase the product.
Four calculation steps
-
Collect the records. Pull units sold, inventory availability, dates, SKU identifiers, location, and channel for the selected period. Keep the source transaction identifier available so analysts can reconcile totals later.
-
Remove stockout periods. Mark weeks when the product had no sellable inventory or was unavailable for purchase. Exclude fully unavailable weeks from the denominator. A partial week needs a documented treatment, such as using the proportion of time available or applying a consistent daily calculation.
-
Sum eligible sales. Add units sold during periods that meet the availability rule. Decide whether cancellations, returns, transfers, marketplace orders, and employee purchases belong in the measure before publishing the result.
-
Divide by eligible time. Divide units sold by eligible weeks, days, or another declared period. Store the denominator alongside the result so a reviewer can see whether a high rate comes from strong sales or a very small availability window.
Worked example
Suppose a product has a 12-week reporting window. It was available for 9 weeks and sold 270 units during those eligible weeks. The true rate of sale is:
270 units / 9 available weeks = 30 units per week
A naive calculation divides by all 12 weeks:
270 units / 12 weeks = 22.5 units per week
The second figure doesn't measure demand while the product was available. It measures sales spread across calendar time, including periods when customers couldn't buy the item. Both calculations are mathematically correct, but only one answers the stated demand question.
Edge cases need explicit rules
For partial weeks, daily availability can produce a more precise denominator than a binary weekly flag. For multiple locations, calculate location-level rates first when availability differs, then aggregate using a documented method. A store with zero stock shouldn't contribute the same denominator as a store that carried the item throughout the period.
Keep ecommerce and physical retail separate when fulfillment and availability differ. U.S. ecommerce sales reached $340.2 billion in the second quarter of 2026 and represented 16.9% of total retail and food-service sales, according to the retail rate-of-sale calculation resource. Channel-specific denominators matter because an online listing can remain active while warehouse inventory is unavailable, while a store SKU can be absent from one location but available elsewhere.
Using Rate of Sale for Merchandising Decisions
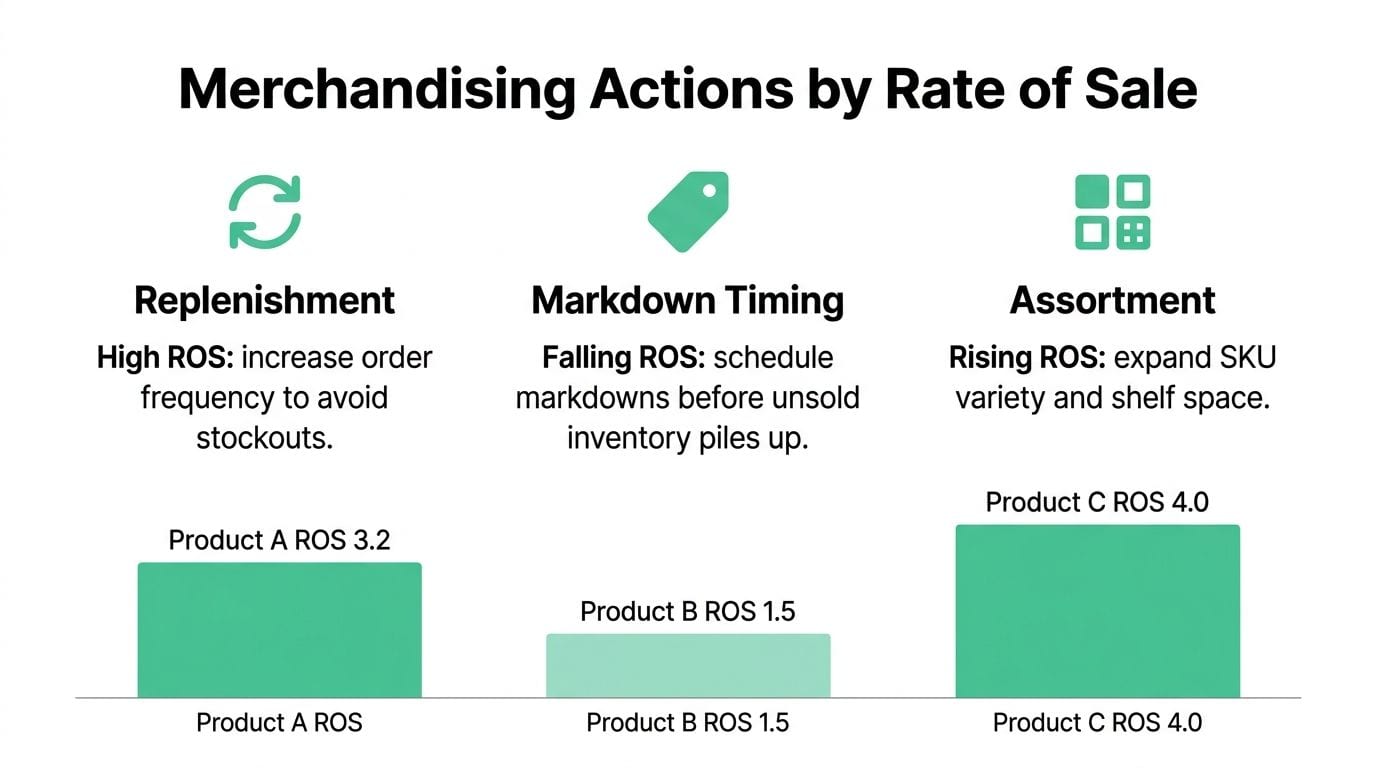
A rate of sale becomes useful when it changes a decision. The number itself isn't a strategy. Merchandising teams should connect movements in eligible demand velocity to replenishment, markdown, and assortment rules, while checking whether availability or event quality caused the movement.
U.S. retail sales provide a market-level context, but they shouldn't replace SKU analysis. The Census Bureau reported $763.6 billion in U.S. retail and food services sales in July 2026, including a 0.6% month-over-month decline and a 5.0% year-over-year increase, as shown in its retail sales release. The same release illustrates why analysts need more than one comparison window. Short-term momentum and year-over-year movement can point in different directions.
Replenishment needs availability-aware thresholds
A rising rate of sale generally supports more frequent ordering, provided the increase survives checks for promotions, channel shifts, and stock availability. A high rate combined with repeated stockouts can indicate that the reorder point is too low. A falling rate with strong availability is more likely to reflect demand weakness than a falling rate caused by missing inventory.
Category context prevents overreaction. Grocery and supermarket categories commonly turn inventory 14 to 20 times annually, while home and furniture categories commonly turn it 2 to 4 times annually, based on retail category benchmarks. These are turnover benchmarks, not universal rate-of-sale targets. Teams should use them to frame category behavior, not to declare that one SKU is healthy without considering price, margin, shelf life, and inventory depth.
Markdown decisions need a second measure
A declining eligible rate of sale can justify a promotion or discontinuation review, but it shouldn't automatically trigger a markdown. Check sell-through against the receipt and inspect whether the product is concentrated in slow locations. A product may have a reasonable weekly pace yet still carry too much initial inventory, making its sell-through profile unsuitable for the planned selling window.
Assortment decisions work similarly. Rising velocity may support more shelf space or adjacent variants, but only after the team confirms that the signal isn't caused by a temporary campaign, a competitor stockout, or a tracking change. A useful ecommerce performance metrics framework can help teams connect product movement with channel and conversion context without turning rate of sale into a standalone score.
Instrumenting Rate of Sale in Your Analytics Stack
Reliable rate of sale reporting starts with a shared event and data model. The point-of-sale system records completed transactions, the warehouse or inventory system records stock position, and the analytics platform joins those records by stable product, location, channel, and time keys.
Capture the fields that explain the number
A useful sales event should identify the SKU, quantity, transaction status, timestamp, channel, location or fulfillment node, price context, and order identifier. Inventory snapshots should identify the SKU, available quantity, timestamp, location, and whether the quantity is sellable. Stockout periods need an explicit state rather than an inferred zero from a missing row.
That distinction matters. A zero inventory record means the system observed no available stock. A missing inventory record may mean the feed failed. Treating both as the same value can either exclude valid demand periods or include invalid ones.
A missing event is not a zero. It's an unresolved data-quality condition.
Build the model so analysts can calculate the measure at SKU, category, location, and channel level without manually editing spreadsheets. Preserve raw events, normalized records, and the final metric table. This makes it possible to trace a dashboard value back to the transaction and availability records that produced it.

Validate each integration boundary
Reconcile completed sales between the source-of-truth transaction database and analytics events. Compare totals by date, SKU, channel, and location. Investigate discrepancies caused by rejected events, duplicate purchase calls, delayed warehouse updates, changed product identifiers, or consent settings that prevent certain events from reaching the analytics destination.
The same discipline applies to marketing measures. Teams reviewing paid demand alongside inventory can use this guide on how to measure ROAS correctly, while keeping advertising attribution separate from the inventory-availability logic that determines eligible rate of sale.
A GA4 ecommerce implementation guide can help teams inspect ecommerce event structure. Regardless of platform, add automated checks for missing sale events, unexpected event-volume changes, property-type mismatches, and SKU values that don't map to the product master. A dashboard can calculate a flawless formula from corrupted inputs and still produce an unusable answer.
Common Rate of Sale Reporting Mistakes and How to Audit Them
The most dangerous reporting errors look reasonable in a chart. A smooth weekly line may hide stockout periods. A percentage may sit under a “rate of sale” label. A current-looking inventory field may be a stale snapshot from an upstream system.
Audit the metric in this order:
- Check the denominator: Confirm that fully unavailable periods are excluded and partial availability follows a written rule.
- Check the label: Separate units per time period from sell-through percentage and inventory turnover.
- Check the channel: Report ecommerce, stores, marketplaces, and fulfillment locations separately when availability or event capture differs.
- Check the inventory timestamp: Verify that snapshots represent the intended reporting period rather than the latest successfully loaded record.
- Check source reconciliation: Compare analytics purchase events with the transaction database by SKU, date, channel, and location.
- Check anomaly alerts: Investigate sudden changes in event volume, missing properties, duplicate transactions, and unmapped product identifiers.
Sell-through is often reviewed at fixed checkpoints such as 4 weeks, 8 weeks, or a full season, while rate of sale can support ongoing monitoring, according to the retail glossary cited earlier. If a team checks rate of sale only at those checkpoints, it may miss an availability failure or demand shift that affects the next replenishment decision.
A practical web analytics audit process should therefore test both the calculation and the events feeding it. The final question isn't whether the dashboard displays a number. It's whether a buyer can explain exactly which sales, availability periods, and business rules produced that number.
Trackingplan continuously monitors analytics events, marketing pixels, schemas, and data flows across web, app, and server-side stacks, helping teams detect missing sale events and broken product data before they corrupt rate of sale dashboards. Visit Trackingplan to see how automated observability and real-time alerts can support trustworthy retail reporting.