
The popular advice is simple. Push return on ad spend (ROAS) higher. Pause low performers. Scale winners. That advice skips the prior question. Does the conversion record behind the ratio describe a real sale, counted once, with the right value, and linked to the right click?
If that record is duplicated, missing, or late, you're not scaling a winner. You're training bidding on bad input. Calculate the ratio, yes. Then audit the records it rests on before you move budget.
The ROAS formula and how to calculate it
The ROAS formula is attributed advertising revenue divided by advertising cost, as the Brandwatch glossary definition of return on ad spend puts it. Write it as a ratio, such as 2.5:1, or as a percent, such as 250%. A ratio of 1:1 means each $1 of spend returns $1 of attributed revenue.
Say a campaign records $100,000 in attributed revenue from $40,000 in spend. Divide $100,000 by $40,000. The result is 2.5:1, or 250%.
Check the arithmetic row by row
| Ad spend | Attributed revenue | ROAS (ratio) | ROAS (percent) |
|---|---|---|---|
| $10,000 | $26,300 | 2.63:1 | 263% |
| $20,000 | $40,000 | 2:1 | 200% |
| $40,000 | $100,000 | 2.5:1 | 250% |
| $50,000 | $150,000 | 3:1 | 300% |
That same source notes Nielsen's 2022 ROI reporting cited a median ROAS of approximately 2.63:1 across industries. Treat 2.63:1 as a reference point. It isn't a profit threshold, because the ratio leaves out product cost, agency fees, discounts, fulfillment, and other operating expenses.
Label the output attributed ROAS. The word attributed does real work. It tells finance that a platform credited this revenue to media, not that the sale is profit or that the ad caused it. For a closer look at why spend and revenue inputs need their own checks, see this guide to ad spend tracking accuracy.
Practical rule: Use the same attribution window for revenue and spend in every campaign you compare.
Your first action is narrow. Divide attributed revenue by spend for each campaign. Keep the window fixed. Don't present the number as profit in any report, dashboard, or client update.
Break-even ROAS and what benchmarks do not tell you
Break-even ROAS equals 1 divided by gross margin. Gross margin is the share of each sale left after cost of goods. A product at 50% gross margin needs 2:1 just to cover cost of goods. Below that ratio, the campaign pays for ads with money the sale didn't produce.
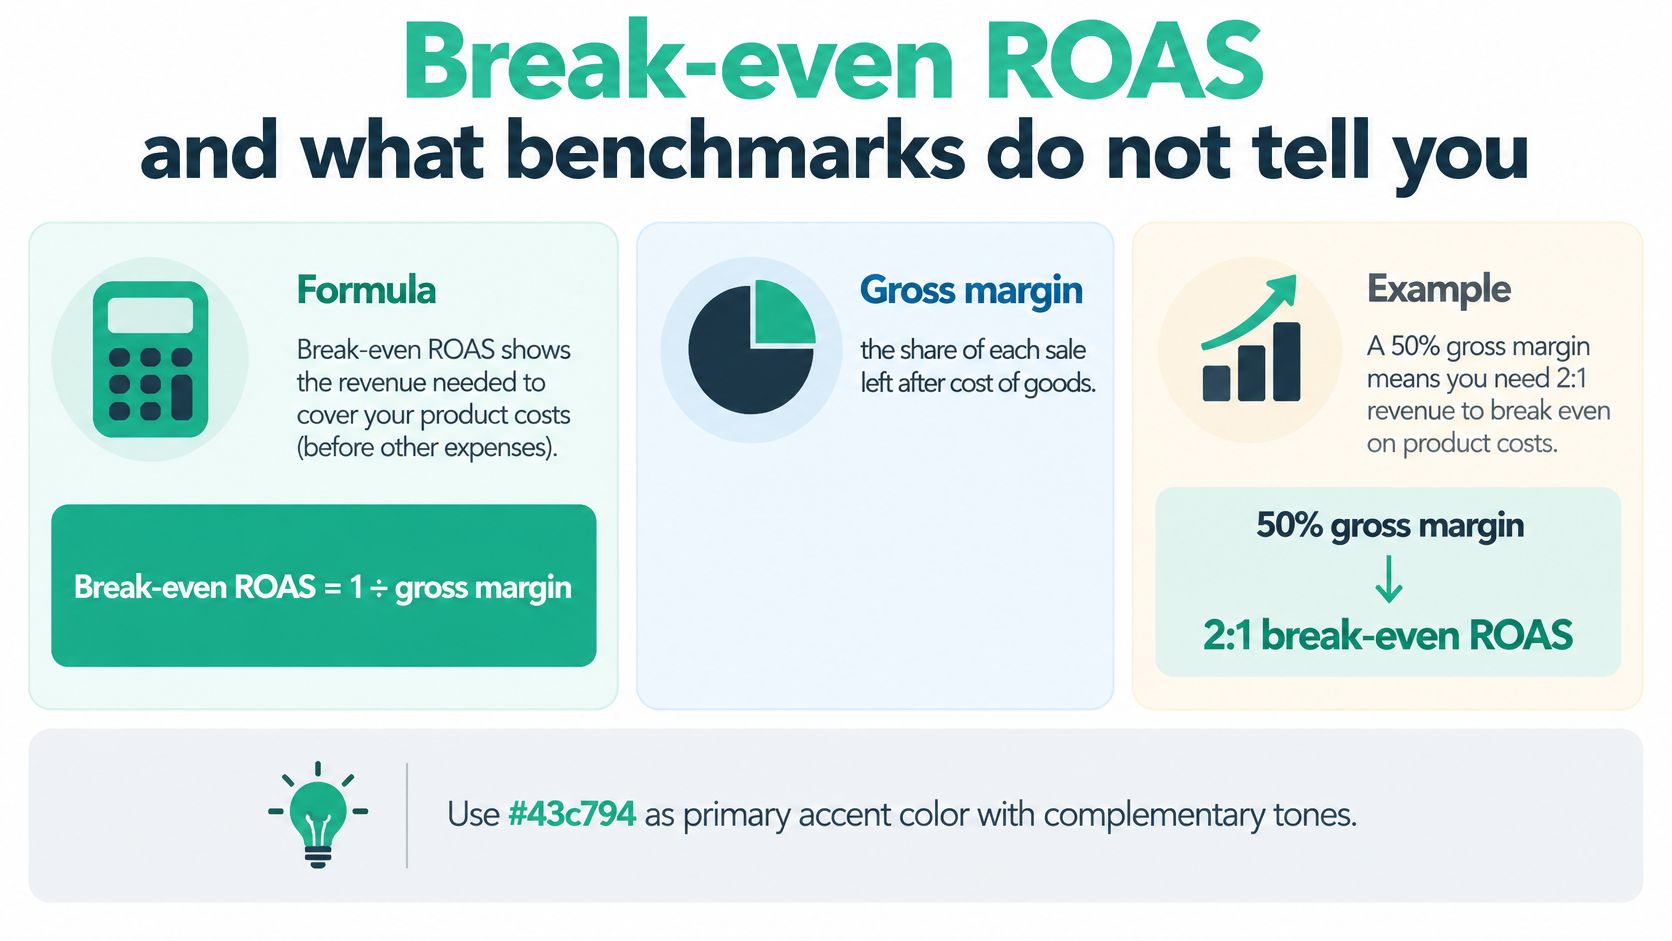
Break-even ROAS by gross margin
| Gross margin | Break-even ROAS |
|---|---|
| 50% | 2:1 |
| 40% | 2.5:1 |
| 33% | 3:1 |
| 25% | 4:1 |
| 20% | 5:1 |
Apply one result to two products. A campaign has $100,000 in attributed revenue and $40,000 in spend. That's 2.5:1. At 25% margin, it produces $25,000 in gross profit against $40,000 in spend. That's a $15,000 loss. At 50% margin, the same ratio produces $50,000 in gross profit. That's a $10,000 gain.
The arithmetic didn't change. The margin did. This is why a cross industry median can't tell you whether to scale. It holds no information about your cost of goods, your return rate, or your fulfillment cost.
Set a break-even ROAS per product group from its margin. Compare each campaign's attributed figure against that group's ratio each month. Don't scale a campaign that clears a benchmark but sits below its own break-even line.
Keep the limit in view. Break-even still ignores returns, fixed overhead, and revenue that would have arrived without ads. It answers one question well, whether gross profit covers spend, and no other question. Raising the ratio once it is verified is a different job, covered in ROAS optimization.
Conversion errors that inflate or shrink ROAS
Start with the error that flatters you. A purchase is sent through both the Meta Pixel and the Conversions API (CAPI). If both events don't carry the identical event name and a shared event ID, Meta can count one purchase twice, as Meta's Conversions API best practices explain. Revenue doubles in the report. ROAS rises. The order count in your store doesn't move.
Generate one stable event ID per transaction. Pass it unchanged through the browser hit and the server hit. Keep the same value and currency on both. The full routine is in this guide to CAPI deduplication issues.
Match quality is a separate failure
Event Match Quality is scored from 0 to 10. Only matched events support attribution and ad delivery optimization. Missing or malformed email, phone, or external ID weakens the match, even when the hit itself arrives cleanly. For Google Ads, a missing GCLID breaks the link to the click. A missing transaction_id lets the same server record count twice.
For paid media teams, Trackingplan monitors every conversion, UTM, and consent signal across your ad platforms, spotting where you lose match rate, where value is missing, and where CAPI double-counts. Use the check routine in conversion tracking validation to structure the audit.
| Defect | Effect on ROAS | First check |
|---|---|---|
| Same purchase sent by Meta Pixel and CAPI without a shared event ID | Revenue counted twice, ROAS inflated | Compare deduplicated purchases with order count |
| Google Ads purchases without a GCLID | Clicks not linked, revenue lost, ROAS understated | Check GCLID capture and storage in the lead or order record |
| Missing or malformed email, phone or external ID | Lower Event Match Quality, weaker attribution | Check the match quality trend by campaign |
| Offline sales uploaded late or without a value | Bidding sees fewer or zero-value sales | Check upload delay and the value field |
| GA4 and Google Ads totals differ | Channel ROAS not comparable | Check attribution model, consent state and conversion definition |
| ad_user_data denied in consent | Click-ID-keyed conversion exports limited | Check consent signal logs against the affected period |
Run the audit in this order. Compare browser events, CAPI events, deduplicated purchases, and revenue totals by campaign and market. Work down the table before you debate creative or audience.
How conversion data reaches bidding and changes spend
Smart Bidding optimizes only toward actions in the Conversions column. That includes Maximize Conversions, Target CPA, and Target ROAS. Mark the wrong action as primary and bidding trains on a proxy event instead of qualified revenue. The spend still moves. It just moves toward the wrong outcome.
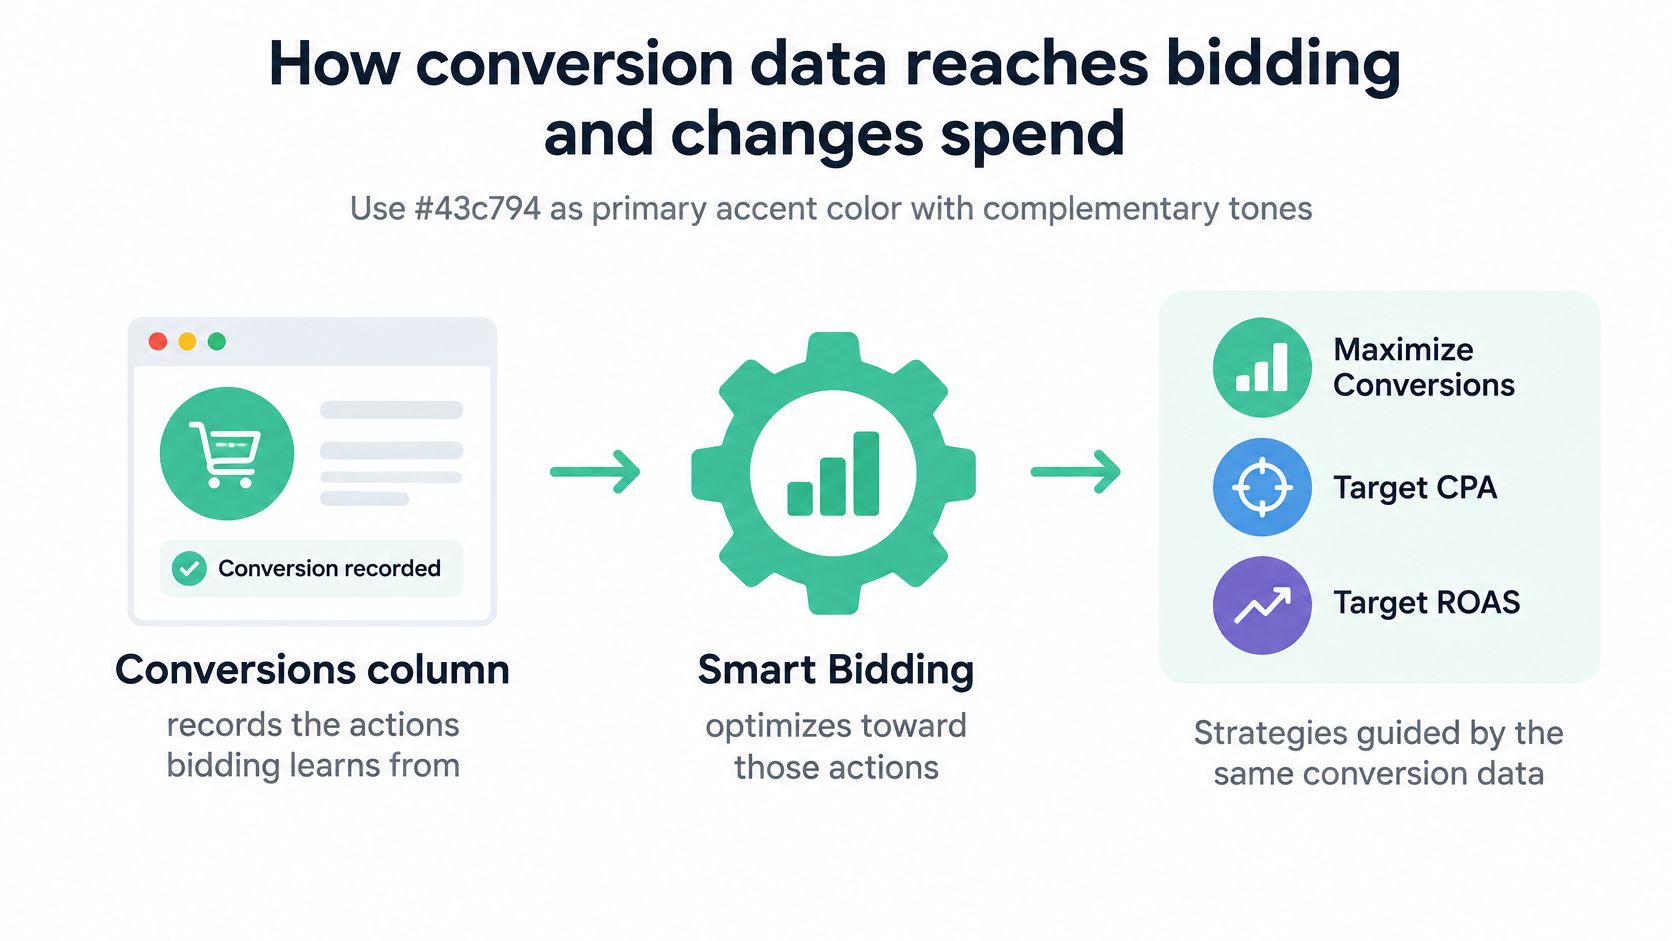
Follow the record from sale to bid
- Record the outcome: Write the qualified sale or lead into the order or lead system, with timestamp, value, and currency.
- Deduplicate it: Attach a transaction_id or order_id so one sale becomes one record, not two.
- Match the click: Link the record with the GCLID. Where it's missing, add hashed first-party data such as email through enhanced conversions for leads.
- Import with value: Upload offline conversions at least daily, with a value on every conversion, as Google's guidance on offline conversions in Smart Bidding recommends for Target CPA, Target ROAS, and Maximize conversion value.
- Let it learn: Allow one to two conversion cycles after a new goal enters the Conversions column before judging it.
Each stage has one setting that breaks it. A late upload makes recent performance look weak. A missing value tells value-based bidding the sale is worth zero. A wrong primary action teaches the model that a form start matters more than a qualified sale.
Don't judge a changed goal in the first cycle. Keep diagnostic reporting separate from bid changes. Validate upload completeness, deduplication keys, consent status, and the delay from qualified outcome to import, then decide whether the new signal deserves trust.
Why attributed sales are not always incremental sales
A shopper searches your brand name. She clicks the paid ad at the top. She buys. The platform credits the ad. She may have bought anyway, through the organic result one line below.

Incrementality asks whether the purchase happened because of the ad or would have happened without it. A large field study summarized in an INFORMS summary of online advertising measurement used 15 U.S. Facebook experiments, approximately 500 million user-experiment observations, and 1.6 billion ad impressions. Common observational approaches often failed to measure the true causal effect accurately.
Attributed sales show what a platform credited. Incremental sales show what advertising caused.
Separate three questions.
- Recorded once: Did the dataLayer, browser hit, and CAPI hit produce one conversion?
- Assigned correctly: Did the right campaign get credit under the stated window?
- Caused by ads: Would the sale have happened in a holdout group that saw nothing?
The first two are tracking checks. The third needs a holdout, a geo experiment, or a platform lift study. For test design, see this guide to incrementality testing.
Error runs both ways. Crediting branded search and retargeting inflates ROAS. Missing or rejected signals make a profitable campaign look weak. Run a holdout on one branded campaign for two to four weeks before you change its budget. A clean ratio with no holdout behind it is still an untested claim.
Confirm the data and decide whether to act
Run the same verdict routine each reporting cycle rather than improvising campaign by campaign. A fixed order stops a strong ratio from jumping the queue ahead of an unchecked defect, and it keeps Smart Bidding from learning from conversion records nobody has examined.
- Check defects first: Test each campaign against the defect table. If any defect is open, label its ROAS unverified and hold off on scaling it.
- Compare with break-even: Put the verified attributed ROAS next to the break-even ratio for that product group.
- Test before budget: If it clears break-even, run or refresh a holdout before adding spend. If it falls short, hold budget and fix the data first.
- Record the verdict: Note the date, attribution window, and conversion definition so the next cycle compares like with like.
Trackingplan checks the data behind your analytics, ads and dashboards across more than 170 analytics and ad providers, and tells you when a number isn’t reliable, and why. It watches conversion, UTM, and consent signals on websites, apps, and server-side implementations. It does not bid, manage budgets, or change campaigns: it makes sure the conversion data those decisions rest on is the data your store recorded.
A ROAS figure is only as good as the record behind it. Verify the record first, then let the ratio decide the budget.