Unlock greater profits with ROAS optimization. Learn five key layers to boost your return on ad spend and maximize your campaign success.
TL;DR:
- Optimizing ROAS involves improving five interconnected marketing layers to increase campaign profitability. Each 10% enhancement in these layers compounds into a significant overall ROAS uplift, emphasizing the importance of accurate measurement and audience targeting. High-quality creative, optimized landing pages, and precise data tracking are essential for achieving sustained return on ad spend.
ROAS optimization is the process of maximizing return on ad spend by improving five interconnected marketing levers that compound to boost overall campaign profitability. Return on ad spend (ROAS) is calculated as total revenue divided by total ad spend. A 4x ROAS means you earn $4 for every $1 spent, but what that number means depends entirely on your profit margin. Improving each of five layers by just 10% produces a 61% total ROAS uplift through compounding, not a simple 50% sum. That single insight changes how marketing teams should think about campaign work. Accurate measurement and attribution underpin every layer, because platform dashboards can inflate CPAs by 30–50% without any real performance change.
How to optimize audience targeting for better ROAS
Precise audience segmentation is the first layer, and it multiplies the impact of every optimization that follows. Broad targeting wastes budget on users who will never convert. Shifting spend toward high-intent segments reduces cost per acquisition and raises the revenue side of the ROAS equation simultaneously.
The most effective targeting improvements fall into three categories:
- Lookalike audiences built from high-value customers. Seed your lookalike models with your top 10–20% of customers by lifetime value, not just purchasers. The resulting audience converts at a higher rate and spends more per order.
- Negative audience exclusions. Remove recent purchasers, existing subscribers, and low-intent browsers from prospecting campaigns. Wasted impressions on these groups inflate spend without adding revenue.
- Refined keyword and interest targeting. On search platforms, shift budget toward bottom-of-funnel, transactional keywords. On social platforms, layer behavioral signals on top of demographic filters to narrow reach to users showing purchase intent.
- First-party data activation. Upload customer lists to match against platform audiences. First-party data outperforms third-party segments in both match rate and conversion quality, especially as cookie deprecation continues.
Each of these moves reduces wasted spend, which directly raises ROAS before you touch a single creative or bid.
Pro Tip: Run a 30-day audience audit before launching any new campaign. Map your current segments against actual conversion data and cut any audience that has spent more than $500 with a ROAS below your break-even threshold.

Audience quality also determines how well your bid algorithms learn. Feed the algorithm high-intent signals and it finds more of the same. Feed it broad, low-quality traffic and the model degrades. Getting audience right first makes bid strategy work far better.
Does creative quality really drive that much of your ROAS?
Creative quality drives 50–70% of campaign performance on platforms like Meta. Advertisers testing over 20 new creatives monthly report 65% higher ROAS than those who do not. That gap is not marginal. It reflects how much of the platform algorithm’s optimization work depends on creative signals rather than targeting or bidding inputs.
The practical implication is that creative production must become a repeatable system, not a one-off project. Here is how to build that system:
- Set a monthly creative output target. Commit to 20 or more new creative variations per month per campaign. This volume is not about throwing ideas at the wall. It is about giving the algorithm enough signal to identify what resonates.
- Define a conversion threshold before declaring winners. A creative with 10 clicks and a 5% conversion rate is not a winner. Set a minimum of 50–100 conversions before pausing or scaling any variation.
- Test one variable at a time. Change the hook, the format, or the offer in isolation. Testing multiple variables simultaneously makes it impossible to know what drove the result.
- Rotate creatives before fatigue sets in. Ad life cycles have shortened from over six weeks to two to three weeks. A creative that performed well in week one may be exhausted by week three, dragging down ROAS without any obvious signal in the dashboard.
- Use AI-powered creative tools for iteration. AI tools can generate copy variants, resize assets for multiple placements, and flag underperforming creatives automatically. They accelerate the iteration cycle without proportionally increasing production cost.
Pro Tip: Build a creative scorecard that tracks hook rate (percentage of viewers who watch past three seconds), conversion rate, and ROAS per creative. Review it weekly. Kill creatives that drop below your hook rate threshold even if their overall ROAS still looks acceptable.
The teams that win on paid social in 2026 treat creative like a media channel in itself, with its own production schedule, testing calendar, and performance benchmarks.
Landing page optimization techniques to boost ROAS fast
Landing page conversion rate is the most underrated lever in the ROAS equation. Lifting conversion rate from 2% to 3% produces a 50% ROAS improvement with zero change to ad spend or creative. That is a permanent gain, not a temporary spike. Every dollar of ad spend simply works harder when more visitors convert.
Page speed is the fastest win. A one-second load delay drops conversions by 7%. On mobile, where most paid traffic lands, the impact is even sharper. Compress images, eliminate render-blocking scripts, and use a content delivery network to get load times under two seconds.
Beyond speed, the table below shows the highest-impact landing page elements and what to test for each:
| Element | What to test |
|---|---|
| Headline | Match it to the ad’s exact promise; test benefit-led vs. feature-led copy |
| Hero image or video | Static product shot vs. lifestyle image vs. short demo video |
| Call to action | Button copy (“Buy Now” vs. “Get Yours”), color, and placement above the fold |
| Social proof | Number of reviews, star rating placement, and named testimonials |
| Page length | Short-form for low-consideration products; long-form for high-ticket items |
Messaging alignment between ad and landing page is non-negotiable. If your ad promises “free shipping on orders over $50,” that offer must appear on the landing page within the first scroll. Mismatched messaging kills trust and raises bounce rates. For a deeper look at landing page best practices, Trackingplan’s guide covers the 2026 essentials in detail.
Conversion rate optimization tactics like heatmaps, session recordings, and A/B testing frameworks help you identify exactly where visitors drop off. Run tests for at least two weeks and require statistical significance above 95% before acting on results.
Crafting offers and value propositions that elevate ROAS
The offer is the numerator driver. A better offer increases average order value (AOV), which raises revenue without increasing ad spend. Break-even ROAS equals the inverse of your profit margin. A 25% margin means your break-even is 4.0x. Targeting 20–50% above break-even creates a sustainable profit buffer. Understanding this number before you test offers prevents you from scaling campaigns that look good on ROAS but lose money on margin.
The most effective offer structures for improving ROAS include:
- Bundling. Combine a hero product with a complementary item at a slight discount. Bundles raise AOV without requiring additional ad spend to acquire a second customer.
- Threshold offers. “Spend $75, get free shipping” pushes customers past a minimum order value. Set the threshold just above your current AOV to maximize lift.
- Limited-time urgency. Time-bound offers increase conversion rate on the landing page, which compounds with the ROAS gains from the landing page layer.
- Subscription or continuity options. Offering a subscribe-and-save option at checkout raises lifetime value, which improves the economics of your ROAS target over time.
Test offer variations the same way you test creatives: one variable at a time, with a defined conversion threshold before declaring a winner. Offers that increase AOV also give your bid strategy more revenue signal to work with, which improves algorithm performance in the next layer.
Bid strategy and budget allocation for sustained ROAS growth
Bidding is where data quality becomes the deciding factor. Accounts using Maximize Conversion Value bidding with accurate revenue data achieve a 6.44x ROAS versus 1.96x for Maximize Conversions accounts. That is a 3.3x performance gap driven entirely by the quality of the revenue signal fed to the algorithm.
The critical caveat: switching to value-based bidding without accurate transaction data causes performance to degrade. Inaccurate revenue inputs corrupt the algorithm’s learning. Before changing your bid strategy, confirm that your conversion tracking passes the correct revenue value for every transaction. Trackingplan’s enhanced conversions guide walks through the technical setup required to get this right.
For budget allocation, portfolio bidding across related campaigns lets the algorithm shift spend toward the highest-performing segments in real time. Set a portfolio target ROAS slightly above your break-even threshold and let the system reallocate within that constraint.
The most important shift in measurement is moving from platform-reported ROAS to Marketing Efficiency Ratio (MER). MER is calculated as total revenue divided by total ad spend across all channels. It removes platform attribution over-claiming and gives you a single, honest number for budget decisions. Use MER alongside accurate ad attribution to judge program-level performance rather than relying on what each platform claims it drove.
Pro Tip: Set a weekly MER review separate from your platform dashboard review. If MER drops while platform ROAS holds steady, you have an attribution problem, not a performance problem.
Reallocate budget progressively. Move 10–20% of spend from underperforming campaigns to top performers each week rather than making large shifts that destabilize algorithm learning.
Key Takeaways
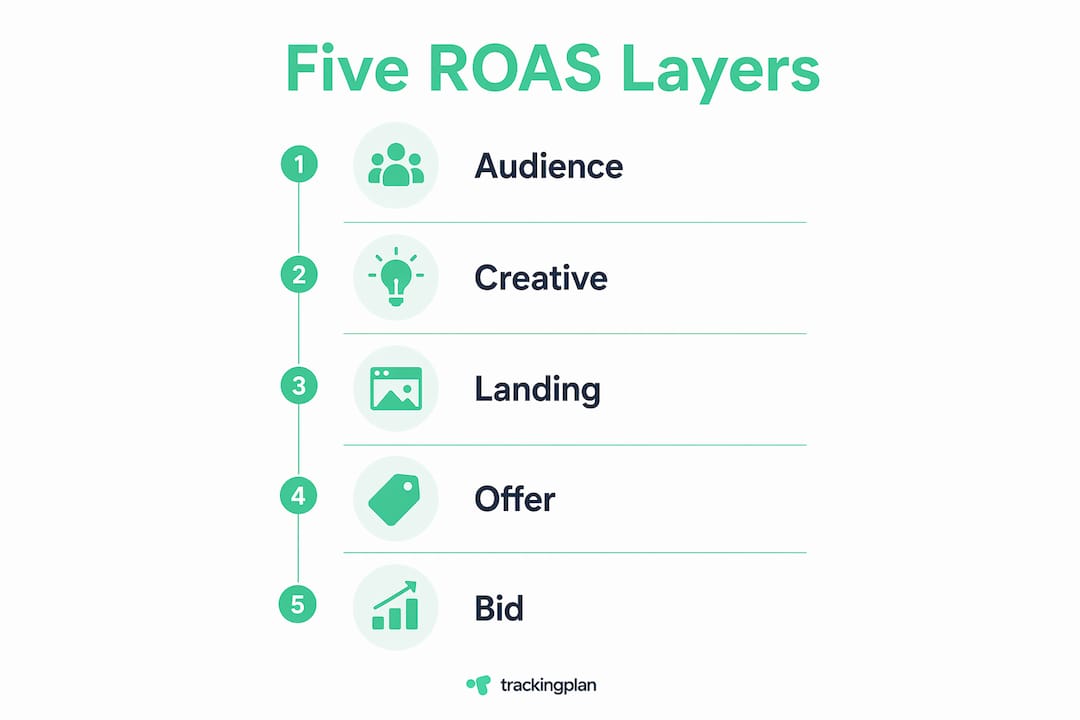
Systematic improvement across five compounding layers, audience, creative, landing page, offer, and bid strategy, produces a 61% total ROAS uplift that no single-lever fix can match.
| Point | Details |
|---|---|
| Compounding beats linear gains | A 10% improvement in each of five layers compounds to a 61% total ROAS uplift. |
| Creative volume is non-negotiable | Testing 20+ creatives monthly produces 65% higher ROAS and offsets shrinking ad life cycles. |
| Landing page conversion is a permanent gain | Lifting conversion rate from 2% to 3% raises ROAS by 50% with no increase in ad spend. |
| Data quality determines bid strategy results | Maximize Conversion Value bidding delivers 6.44x ROAS only when revenue data is accurate. |
| MER beats platform ROAS for budget decisions | Marketing Efficiency Ratio removes attribution noise and gives a true cross-channel performance read. |
The layer most teams skip, and why it costs them
Most marketing teams I have worked with jump straight to bid strategy when ROAS drops. They switch bidding modes, adjust targets, and reallocate budgets, all while the real problem sits upstream in their data layer. Platform dashboards report what the algorithm believes happened, not what actually happened. Privacy changes have made that gap wider every year.
The uncomfortable truth is that creative fatigue and broken tracking are responsible for more ROAS declines than poor bidding decisions. I have seen campaigns where a single misfired pixel caused the algorithm to optimize toward a proxy event instead of actual purchases. The platform dashboard showed stable ROAS. The bank account told a different story.
The teams that sustain strong returns treat data hygiene as a prerequisite, not an afterthought. They validate their conversion tracking before touching bids. They maintain a creative production calendar the same way a media buyer manages a flight schedule. And they use MER as their north star metric rather than chasing the number each platform reports.
The layered approach described in this article is not a one-time project. It is a continuous operating rhythm. Audience, creative, landing page, offer, and bid strategy each require their own review cadence. When you run them in parallel and let the gains compound, the results are durable, not just a short-term spike.
— David
How Trackingplan protects the data your ROAS depends on
Every optimization layer in this article depends on one thing: clean, accurate data flowing into your ad platforms and analytics tools. A broken pixel or a misfired conversion event corrupts your bid algorithm, inflates your reported ROAS, and sends budget toward the wrong audiences.
![]()
Trackingplan monitors your entire tracking implementation in real time, catching missing pixels, schema mismatches, and attribution errors before they distort your campaign data. It integrates with your digital analytics tools and sends instant alerts via Slack, email, or Teams when something breaks. Privacy compliance checks are built in, so your data collection stays within regulatory boundaries. Start with a free analytics audit to find the tracking gaps that are quietly undermining your ROAS right now.
FAQ
What is ROAS and how do you calculate it?
ROAS is return on ad spend, calculated as total revenue divided by total ad spend. A campaign generating $10,000 in revenue from $2,500 in spend has a 4x ROAS.
What is a good ROAS target?
A good ROAS target depends on your profit margin. Break-even ROAS equals the inverse of your margin, so a 25% margin requires a 4.0x break-even. Target 20–50% above that threshold for sustainable profit.
Why does platform-reported ROAS differ from actual results?
Platform attribution over-claims conversions across channels, and privacy changes have widened that gap. Meta’s April 2026 attribution update inflated CPAs by 30–50% without any real performance change. Use Marketing Efficiency Ratio as a cross-channel check.
How often should I refresh ad creatives?
Ad life cycles have shortened to two to three weeks due to creative fatigue. Producing 20 or more new creatives per month per campaign is the current standard for maintaining ROAS on paid social platforms.
Does landing page speed really affect ROAS?
Yes. A one-second load delay reduces conversions by 7%, which directly lowers ROAS. Improving page speed is one of the fastest ways to boost campaign profitability without increasing ad spend.