Learn how to set up real-time tracking monitoring and alerts with Trackingplan. Step-by-step setup, validation rules, Slack alerts, and AI debugging.
You can't rely on morning dashboards when a pixel breaks at 4:12 p.m. and nobody notices until the client asks why conversions fell off a cliff. That's the pain behind how to set up real-time tracking monitoring and alerts with Trackingplan, the gap between a live stack and a reporting layer that only tells the truth too late. Agencies, e-commerce teams, and in-house analysts all run into the same problem, hidden tracking failures don't announce themselves, they just corrupt decisions.
Why a 36-Hour Silent Failure Should Never Happen Again
A broken checkout pixel usually doesn't feel like a fire at first. The site keeps loading, campaigns keep spending, and the dashboard still has numbers, just not the right ones. By the time someone spots the mismatch, the team has already lost a full decision cycle, and support, media, and analytics all have to reconcile what happened after the fact.
That's why periodic audits break down in real marketing stacks. A scheduled QA pass can miss a missing event, a schema mismatch, or a consent issue that only appears under real traffic conditions. Trackingplan is built to watch actual user traffic continuously across web, iOS, Android, and server-side stacks, and it's designed to catch missing events, spikes or drops, schema mismatches, broken pixels, consent drift, and PII issues before they disappear into next-day reporting. Detect silent tracking errors
Practical rule: if the implementation only looks healthy during a test click, it's not monitored, it's hoped for.
The difference between a brittle test suite and always-on validation is simple. Test scripts check what you expected to happen. Live monitoring checks what happened, across real users, real devices, and real destinations. That's the only setup that catches a broken ad pixel, a drifting consent state, or a dropped parameter while there's still time to fix the source.
Prerequisites Before You Install Anything
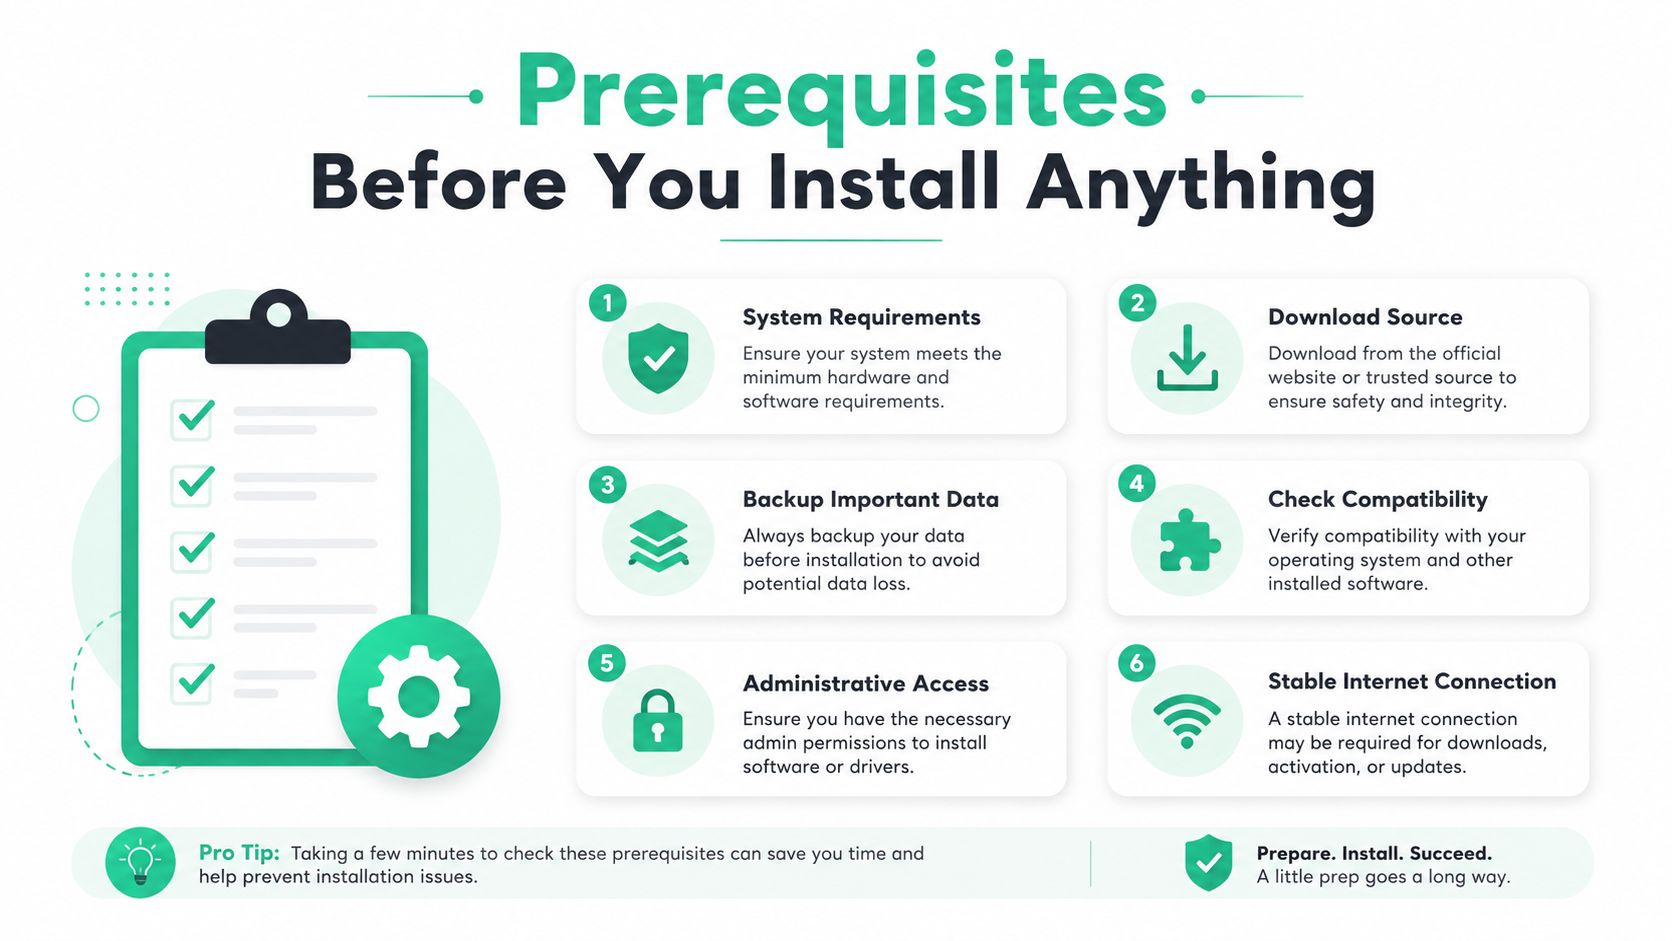
The cleanest rollouts start before anyone opens the tag manager. In client accounts, the teams that move fastest are the ones that settle access, ownership, and alert routing first, because those are the items that usually stall setup after the technical work has already begun.
For real-time tracking monitoring and alerts with Trackingplan, I start with a few checks that keep the install from turning into a back-and-forth thread:
- Account access: confirm who owns the workspace and who can approve changes.
- Destination permissions: get admin access to the analytics, marketing, and attribution destinations the platform will monitor, so validation can compare against the full stack.
- Deployment path: decide whether the snippet goes through a tag manager, a mobile build, or a server-side endpoint.
- Notification targets: identify the Slack or Microsoft Teams channels, and the people, who should receive alerts.
- Environment scope: choose whether you're instrumenting production only or also staging, because noise in lower-value environments can muddy the initial baseline.
The environment decision is where setup often goes sideways. If staging sends different events, or consent behaves differently from production, the monitoring plan needs to reflect that from the start. Otherwise, the platform learns patterns you do not care about, and the first alerts become harder to trust.
Trackingplan's setup also depends on admin access to the analytics, marketing, and attribution destinations it will monitor, plus a deployable tag manager, mobile build, or server-side endpoint. If you want the installation path spelled out before you touch production, this installation guide is the right place to confirm the exact flow. Use-case guidance for analysts
Installing the Snippet and SDK Across Web, Mobile, and Server
The install step is usually the least painful part if the groundwork is already in place. Trackingplan uses a lightweight JavaScript snippet or SDK that can be deployed quickly, and it starts monitoring live traffic without a manual schema setup. If you want the exact install sequence before touching production, the installation guide lays out the flow.
For web, a tag manager is usually the cleanest route. The snippet can live inside the existing container, so the team does not need to rewrite tracking logic just to start observing it. For mobile, the SDK belongs in the app build, where it can watch events coming from iOS or Android traffic in the same way the web snippet watches site activity. For server-side setups, the same pattern applies, the SDK or endpoint sits in the backend stack and tracks event flow as it leaves the server.
A rollout that works in practice looks like this:
- Deploy to the primary production environment first. You want live traffic from the highest-value property before you widen scope.
- Let the system discover events and properties automatically. Do not spend time drafting a manual schema before the platform has seen your real implementation.
- Confirm the stream is visible in Live Mode. If hits are not arriving, fix the deployment before trusting any alert logic.
- Expand to mobile and server-side once the first dataset looks sane. That keeps the early signal clean.
Operational note: teams often over-engineer the install and under-test the first live hit. The first real event matters more than a polished checklist.
Once the snippet or SDK is in place, the focus shifts to observation. The platform is meant to learn from live traffic, not synthetic clicks, so the earliest sign of success is seeing actual events flow into the monitor view. If the stream is quiet, the problem is usually deployment or traffic volume, not the product itself.
Discovery, Live Mode, and Baseline Behavior

After installation, the platform isn't judging your stack yet, it's learning it. Live Mode streams incoming hits so teams can reproduce user sequences and inspect how rules apply across providers, and higher-traffic properties can become ready in as little as one hour, while lower-traffic ones can take up to a week. Live Mode walkthrough
That readiness window is easy to misread if you're used to synthetic test tools. A quiet property doesn't mean the installation failed, it usually means the baseline needs more live data. On a busier site, you'll see patterns stabilize faster because the platform has more real behavior to compare against.
I've found the best use of this phase is discovery review, not rule sprawl. Check what events, properties, and providers were detected, then trim obvious noise before turning on aggressive alerts. If a naming convention is already inconsistent, fix the source pattern first so you don't train the monitor to normalize bad data.
The platform compares incoming data against learned baseline patterns rather than synthetic tests, which is what makes the alerting meaningful once it goes live. That baseline-driven approach is also what lets teams catch missing events, schema mismatches, and UTM convention errors in real conditions instead of in a controlled demo.
A good baseline is boring. If it looks exciting, the implementation probably still has too much drift.
For a deeper implementation pattern, Trackingplan's own bulletproof your digital analytics with data validation article is a useful companion when you're deciding how strict the first rule set should be.
Writing Validation Rules That Catch Real Breakages
Validation is where most monitoring plans either become useful or turn into noise. The right rules aren't just “is the event present,” they're “does the event match the shape the business depends on.” Trackingplan refreshes destination and acquisition data every 5 minutes, which gives near-real-time visibility into changes and supports checks for missing or dropped events, traffic spikes or drops, property type mismatches, naming convention violations, broken ad pixels, and consent or privacy misconfigurations. Product monitoring model
A practical rule set usually starts with the events that matter most to revenue or attribution. Purchase, lead, signup, add-to-cart, and ad pixel hits deserve stricter validation than low-value behavioral events. Then you layer checks on top of them, required parameters, property types, allowed naming patterns, consent state, and privacy-safe payloads.
Here's how I'd think about the rule library:
| Check type | What it protects | Example failure mode |
|---|---|---|
| Required parameters | Decision accuracy | A purchase fires without a transaction identifier |
| Property type validation | Clean downstream processing | A numeric field arrives as text |
| Naming rules | Consistent reporting | A campaign parameter violates the agreed convention |
| Consent checks | Privacy compliance | Tracking fires before permission is granted |
| Pixel validation | Media attribution | A remarketing pixel stops firing on checkout |
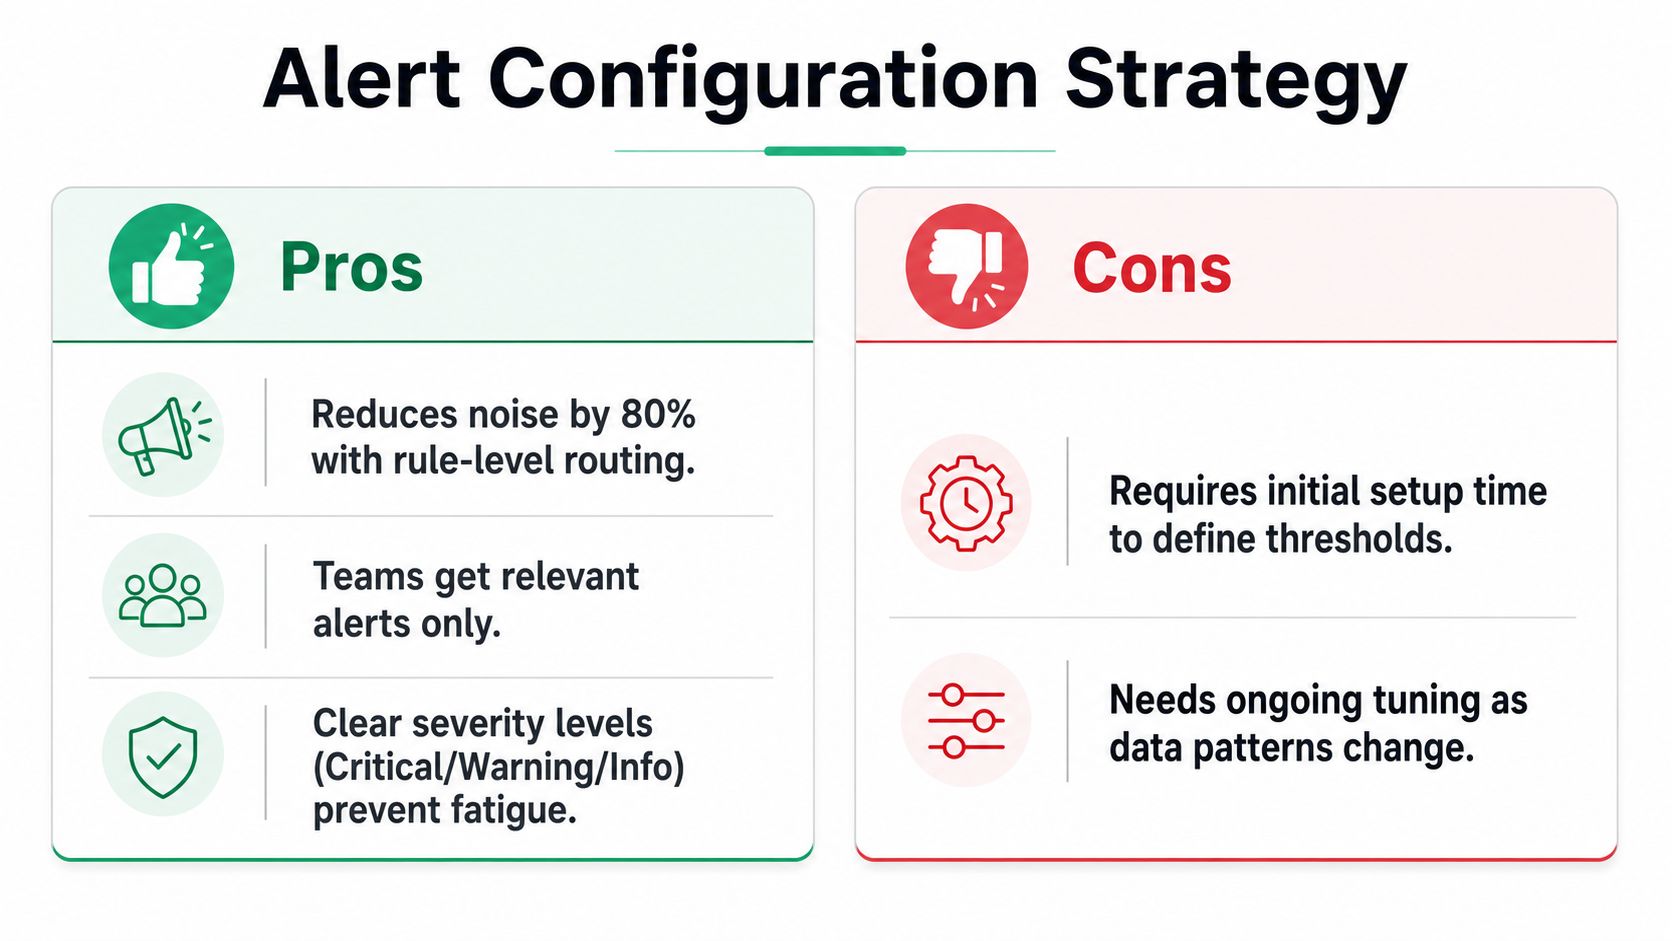
The strongest setups don't try to monitor every possible edge case on day one. They monitor the business-critical paths first, then expand as the stack matures. That's where alert fatigue becomes an engineering problem, not a process problem. The team needs thresholds, routing, and severity, not more red badges.
For teams that want a broader detection pattern beyond analytics QA, the guide to website change detection agent is a useful comparison point. It's a different problem space, but the same discipline applies, watch the right surface, define the right delta, and decide what deserves immediate attention.
Configuring Alerts Without Creating Alert Fatigue
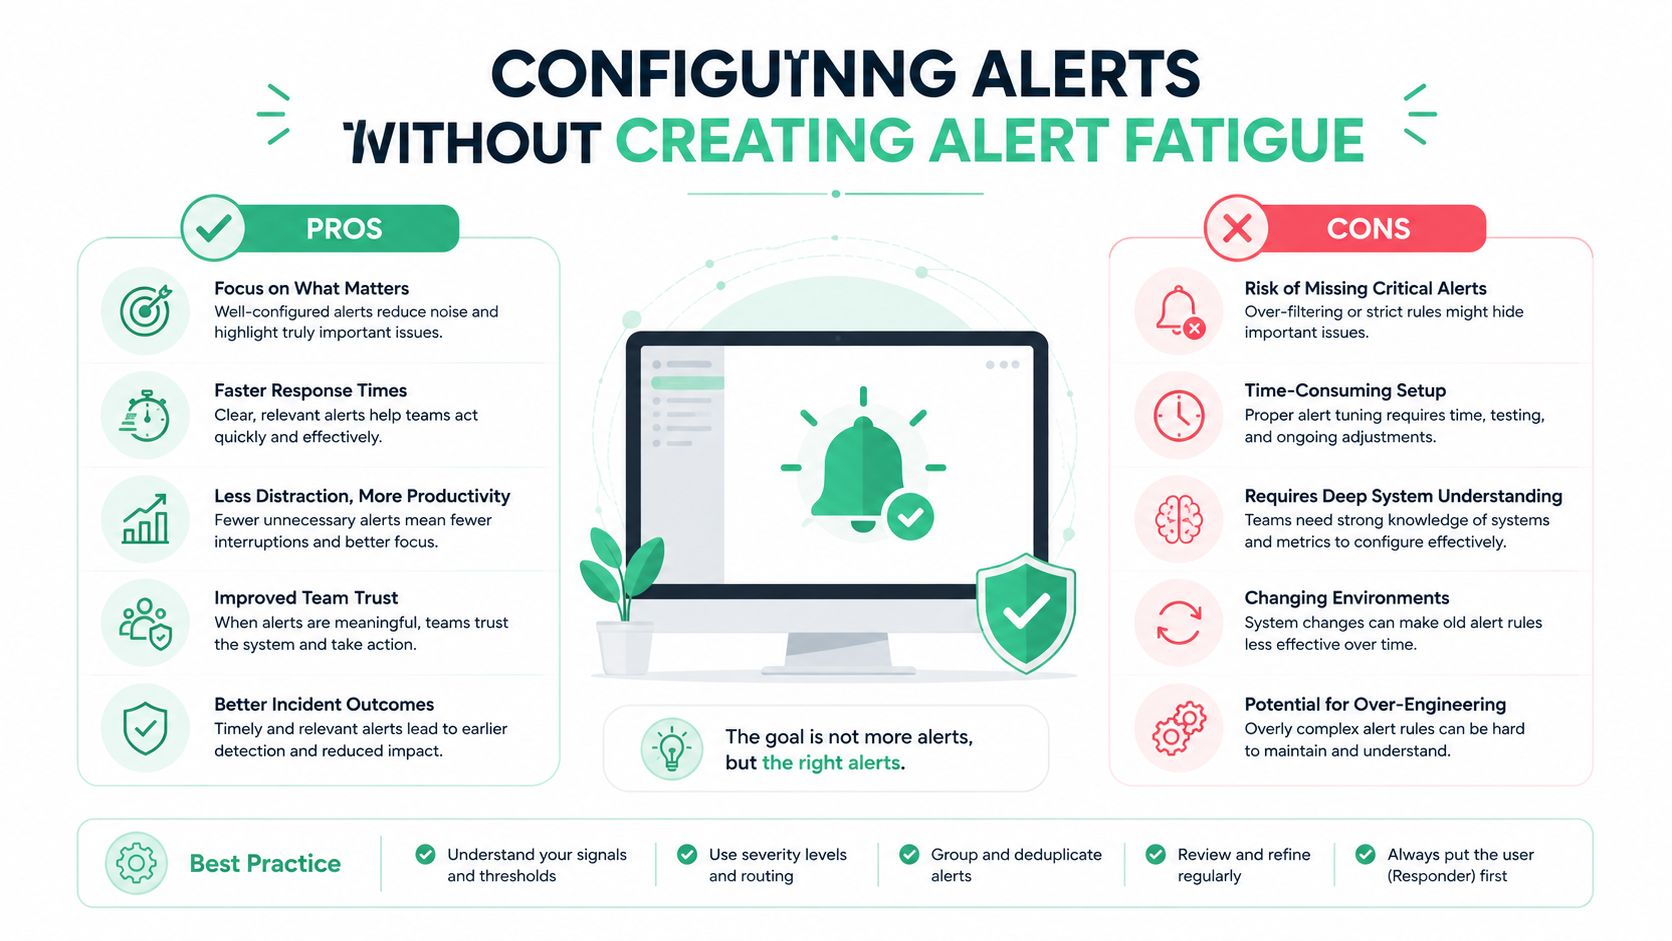
The first alert is usually exciting. The tenth one is where teams start muting channels. That's why routing matters as much as detection, and why you should think in terms of severity tiers instead of one workspace-wide firehose.
Trackingplan lets recipients be set per alert to specific team members, Slack or Teams channels, or left blank so alerts only appear in the Trackingplan panel with no email, Slack, or Teams notifications sent. Alert routing mechanics The blank-recipient option is underrated, because it's the right place for noisy checks during rollout or for informational rules you want visible but not disruptive.
A practical routing model looks like this:
| Issue type | Severity | Channel | Recipients |
|---|---|---|---|
| Missing purchase event | Critical | Slack | On-call analytics and engineering |
| Broken ad pixel | Critical | Microsoft Teams | Paid media owner and QA lead |
| Property mismatch | Warning | Analytics channel distribution list | |
| Consent drift | Critical | Slack | Privacy and web analytics owners |
| Naming violation | Info | In-app only | No recipients, panel review only |
That structure keeps urgent issues actionable and low-risk drift reviewable. If you're mirroring thresholds across platforms, Trackingplan's GA4 alerts flow is clear, go to the Admin section of the GA4 property, select Alerts under the View column, define threshold conditions for metrics like traffic, conversion rates, or engagement, then choose email, SMS, or mobile app notifications and save the setup. GA4 alert workflow
Practical rule: if a rule doesn't need a human within minutes, it probably doesn't need Slack.
For a broader look at alert governance and filtering patterns, the reduce alert noise with Fivenines resource pairs well with this setup approach. The central idea is the same, route by severity, not by convenience.
Responding to an Alert With AI-Assisted Root-Cause Analysis
A good alerting flow gets quiet after the first few incidents. A Slack ping arrives, the analyst opens Live Mode, replays the user path, and checks which providers received the event and which ones dropped it. At that point, the value is operational, because the issue can be traced without digging through logs by hand.
Live Mode and real-time validation let teams reproduce user sequences, inspect rule behavior across providers, and surface missing or broken events as they occur. The platform is built to detect issues within seconds of deviation. In practice, the difference between a long investigation and a short fix usually comes down to where the break lives, in the event payload, the pixel firing condition, or the consent state. The Response workflow reference is a useful guide for that review path.
A healthy on-call loop looks like this:
- Open the alert and confirm the scope. Check whether one event, one page, or one provider is affected.
- Replay the sequence in Live Mode. Recreate what the user did, not just what the dashboard reported.
- Inspect the AI-assisted diagnosis. Use it to narrow the likely root cause before touching code.
- Patch the source implementation. Fix the tag, parameter, or consent condition where it breaks.
- Verify the same path again. Don't close the loop until the live hit is clean.
For teams that want a tighter guided repair loop, start with the AI-assisted debugger inside the platform. The point is to keep engineering judgment in the loop while cutting out the slowest part of the hunt, the manual search through logs, tags, and provider-specific quirks.
After the first week, a healthy setup is easy to spot. Alerts are tiered, noisy checks stay in-app only, urgent issues reach the right people, and fixes are validated against live traffic before the next campaign decision depends on them.