
What is Trackingplan
 Overview
The Trackingplan Way
 Automonitoring


 Automated Alert System


Getting Started
 Installing Trackingplan


 Post-Install Warm-Up
Inside Trackingplan
 Dashboard


 Destinations
How to…
 Manage Warnings


 Ensure Privacy


 Marketing Observability

 Enhance Collaboration


 Extend detection


 Multi-Account Management


Others
 Looker Studio Connector
 Omnibug Extension
 Trackingplan Export API
 Trackingplan Exploration API
 Supported Trackers
  SDK Update
 Release Notes
 Privacy and Security
Warnings & Updates
Trackingplan detects and sends you real-time alerts about all updates or issues in your tracking. These are the different types of warnings that Trackingplan will automatically notify you about and that we will see in more detail throughout this section:
- Missing Events
- Traffic Drops
- Traffic Peaks
- Custom Thresholds
- Real‑time traffic drops
- Real‑time traffic peaks
- Real‑time hit‑to‑user ratio drops
- Real‑time hit‑to‑user ratio peaks
- Missing KPI values
- KPI value drops
- KPI value peaks
- Custom Thresholds
- Missing Properties
- Conditionally Missing Properties
- Forbidden Properties
- Type Collision
- Validation Errors
- Validation Enum Warnings
- Validation Regex Warnings
- Validation Function Warnings
- Campaign Validation Warnings
- Recommended Specs Warnings
- Consent violations
- Daily consent acceptance changes
- Google Analytics Implementation Warnings
Traffic Warnings
Let’s see what type of traffic warnings you’ll be able to automatically spot:
Missing Events
Trackingplan will notify you if any event in your tracking plan vanishes completely and has no traffic at all for a full day. If this scenario is detected, you will see a missing event warning in Trackingplan’s Digests and your Dashboard the day thereafter.
/w=1920,quality=90,fit=scale-down)
Just by clicking on the warning, you’ll have access to your Warning Management View, where you’ll be able to dive deep into your warnings and understand them better.
In there, you’ll also be provided with a Daily Traffic Chart to see the event’s traffic evolution at a glance and instantly understand its impact.
/w=1920,quality=90,fit=scale-down)
You can also add any relevant information to track its progress for seamless collaboration within your team. To deactivate missing event warnings, simply navigate to your Warning Settings.

Traffic Drops
At Trackingplan, we know the traffic in your events might also change significantly during weekdays or weekends, special dates, or other factors like campaigning. For this reason, we monitor event traffic according to your user traffic.
/w=1920,quality=90,fit=scale-down)
Our model learns from your historical traffic to take into account your typical user behavior, i.e. how often they trigger each event and with what daily and weekly variance. For this reason, our monitoring will improve over time to adapt as much as possible to your tracking changes.
/w=1920,quality=90,fit=scale-down)
You can always deactivate traffic drop warnings or set the tolerances at which they trigger, choosing between low, medium, or high tolerance levels. Learn more about Traffic Warning Tolerances here.

Traffic Peaks
Oppositely, at Trackingplan we also know that there are certain events whose increase can be negative (e.g.: abandoned_cart). That's why we also support and alert you about anomalous traffic peaks.
/w=1920,quality=90,fit=scale-down)


Similar to Traffic Drops, you can deactivate traffic peak warnings at any time or adjust their trigger threshold by selecting low, medium, or high tolerance levels. Learn more about Traffic Warning Tolerances here.
/w=1920,quality=90,fit=scale-down)
Custom Thresholds
Trackingplan will always propose predefined alerts based on your business type, but you can also set up custom daily thresholds above or below any threshold you have to be alerted only when the conditions you specify are met.
/w=1920,quality=90,fit=scale-down)
/w=1920,quality=90,fit=scale-down)
This warning is customizable per event.

/w=1920,quality=90,fit=scale-down)
Real-Time Traffic Anomalies
With Real‑Time Traffic Anomalies, you can catch important traffic issues as they happen.
Many teams—performance and acquisition, campaign managers, and daily watchers—cannot wait until the next day to know whether an event or campaign failed. Real-time monitoring lets you react immediately by analyzing ongoing trends and notifying you about unexpected deviations.
To give you full flexibility, you can activate Real-Time Traffic Anomalies on an event-by-event basis, meaning you can choose to configure only the events that matter most to you. Simply click on Warning Settings to get started.

Pro tip: To make it easier to know which events have real-time warnings configured, you can now filter events by “Warning Settings: customized by user”. This lets you instantly see where real-time warnings have been touched or adjusted.

You’ll find the configuration to enable Real-Time Traffic Anomalies right at the top of your Warning Settings.

By activating it, the following modal will appear.

Here, you’ll have the possibility to configure the desired tolerance levels for drops and peaks, and decide whether to apply user-volume normalization. Let’s break it down:
- Traffic drop tolerances: You can choose between five tolerance levels to control how sensitive your real-time alerts are:
- Disabled: No traffic drop warnings will be triggered for this event.
- Max (Fewer Warnings): Alerts will only be triggered in extreme cases, minimizing notifications.
- High (Lenient): Alerts trigger only for significant deviations. Ideal for less critical events, such as optional user interactions, where minor fluctuations are not important.
- Medium: Offers a balanced approach, reducing false positives while still catching meaningful anomalies.
- Low (Strict): Best for critical events, where even small deviations matter.
- Min (More Warnings): Alerts trigger even for smaller variations, ideal when you want maximum coverage and to catch every possible deviation.
Pro tip: Stricter tolerances generate more alerts; looser tolerances reduce noise. Use the Detection Forecast to preview how your chosen tolerance level will behave and adjust it to fit your needs.

- Traffic peak tolerances: Same as above, but applied to unexpected traffic spikes.
You could also choose to disable peak alerts entirely and only receive notifications for anomalous traffic drops. Adjust the settings to fit your needs, experiment with different tolerances, and find the configuration that works best for your team!

- Normalization: Normalization adjusts traffic anomalies by taking user volume into account. This helps reduce false alerts caused by normal changes in traffic, like campaigns or seasonal events.
- On (normalized by user volume): Recommended for detecting integration issues. The system compares event traffic to user volume, so expected traffic increases (e.g., from marketing campaigns or Black Friday sales) don’t trigger false alerts.
- Off (raw event traffic): Recommended for detecting business-related anomalies. Uses raw event traffic, ignoring user volume, so you can spot unusual patterns that affect your business metrics.
Pro tip: Choose On if you want to catch technical or implementation problems, and Off if you’re more interested in business-level traffic changes.
Detection Forecast
To make it easier to understand, our Detection Forecast will update dynamically as you adjust your tolerance levels. This helps you instantly see what would trigger an alert and what wouldn’t.
- Green line: Your actual hits
- Grey band: Upper and lower thresholds, which will shift as you modify tolerances
Think of it as a sandbox for your alerts—you can experiment with different settings, see the effects instantly, and get recommendations to fine-tune your real-time warnings just the way you like them.

Real-Time Notifications
Once configured, these warnings behave like any other in Trackingplan. If an anomaly is detected, a warning will be generated and displayed in your dashboard, where you will be able to dig deeper to debug it, and later check whether the issue persists or has been resolved.
But Trackingplan was built so you can focus on your work while still being protected. That’s why Real-Time Traffic Anomalies lets you choose who receives notifications, keeping you informed about important issues without being glued to your dashboard.

You can send real-time alerts to specific team members, Slack or Teams channels, or leave recipients blank if you prefer:
- Email: Notify specific team members or entire departments directly.
- Slack or Teams: Send alerts to a channel for broader visibility. Here’s how you can do it.
- No recipients: Leave blank to only see alerts in your Trackingplan panel. Doing this won’t trigger email/Slack notifications.
Note: Don’t worry about getting spammed—only one email is sent per anomaly. If the issue pops up again after being resolved, you’ll get a fresh notification after 24 hours.
KPI Warnings
These KPI-specific warnings are similar to the traffic warnings we’ve just seen, but are applied to your daily KPI values. Let’s see what type of KPI warnings you’ll be notified about with Trackingplan:
Missing KPI values
Trackingplan will notify you if any of your KPIs show no values for one or more days.

Just by clicking on the warning, you’ll have access to your Warning Management View, where you’ll be able to dive deep into your warnings and understand them better.

You can also add any relevant information to track its progress for seamless collaboration within your team, mute or share the warning, or even deactivate missing KPI values warnings.
Additionally, you can customize the traffic threshold and fine-tune KPI tolerance levels to control how sensitive your anomaly detection is, helping you cut through the noise and focus on what truly matters. Learn more about Traffic Warning Tolerances here.

KPI value drops
Trackingplan will notify you if our system detects a significant drop in your KPI values.

KPI value peaks
Conversely, Trackingplan will also generate a warning if it detects a significant peak in the KPI value.

Custom Thresholds
Trackingplan will always propose predefined alerts based on what it automatically learns from your data, but you can also set up custom daily thresholds above or below any threshold you have to be alerted only when the conditions you specify are met.

- KPI Value Below Daily Limit: Triggered when the KPI value falls below a user-configured threshold.
- KPI Value Above Daily Limit: Triggered when the KPI value exceeds a user-configured threshold.
Again, you can always explore further on the warning by clicking on it.

/w=1920,quality=90,fit=scale-down)
Specification Warnings
Let’s dive into all the specification warnings you’ll be able to automatically spot:
Missing Properties
You can specify whether or not a property is required within an event. If required properties are not being tracked in event hits all the time, Trackingplan will automatically send you a warning.

In the case of specification warnings, the Warning Management View acts as the central entry point for analysis and takes you to two complementary perspectives:
In the Overview tab, you get a high-level view of specification health. The chart shows the daily rate of specification matches vs. mismatches, including warnings triggered by required constraints defined in your specifications. This view helps you quickly detect trends, spikes, or recurring issues impacting data quality.

For deeper investigation, the Warning analysis tab provides AI-powered, clear, human-readable explanations for each specification warning. This tab is designed to help analysts understand what is happening, why it is happening, and what actions to take, without spending hours manually reviewing raw tracking data.
By default, all AI features are disabled and opt-in. You can activate them at any time from the AI Features settings.

For detailed information on Trackingplan’s AI Debugger and how to use it, see the official documentation.
Missing property warnings are fully customizable. You can define a tolerance percentage that determines how often a property is allowed to be missing before a warning is triggered. This flexibility allows you to adapt warnings to real-world tracking behavior, where certain properties may be legitimately absent in a small percentage of events.

To easily spot correlations for any incomplete property—even optional ones—and understand why they're not arriving 100% of the time, Trackingplan's Find Correlations makes it simple. Learn all the details here or check out the video below:
Conditionally Missing Properties
Moreover, Trackingplan will also notify you about missing hits on the designated required pages you previously set as conditional.
Setting a property as “conditional” can be very useful for events that occur on many different pages. In this sense, adding a conditional could allow us to differentiate between required or nullable within the very same property, depending on its value.
This provides you with greater control and precision in defining your tracking requirements, allowing you to focus on the most critical aspects of your data.
Forbidden Properties
This warning is triggered when a property appears within an event that is not included in its defined list of expected properties.

In other words, if one of your events is only supposed to include 4 specific properties, but Trackingplan detects an additional property that isn’t part of that specification, a warning will be automatically flagged.
You can enable Forbidden Properties warnings either individually per event or globally for your entire plan.

Once activated, any new property appearing within an event will automatically trigger a warning instead of being marked as new.
Important note: Before enabling Forbidden Properties, make sure that Trackingplan has fully completed its auto-training process and has learned your real traffic patterns.
If you activate this option too early, Trackingplan will assume that only the properties and destinations it has already seen are valid. This can lead to misleading warnings or missing data later on.
For example, if some destinations, events, or properties you care about haven’t received traffic yet and you enable Forbidden Properties before Trackingplan has detected them, those properties may later be treated as forbidden or may not appear as expected.
Best practice: Only activate this setting once your tracking has been stable for a while and Trackingplan has observed traffic across all relevant events, properties, and destinations.
Type Collision
The property is there, but with a different type. Trackingplan automatically interprets which data type is being tracked and, if it detects any data type collision, a warning will be generated.

This warning is also customizable and you can set the tolerance percentage you want.

Validation errors
When a property, event, or UTM parameter has validation errors and does not conform to the values you have specified.
- Validation enum warnings: This triggers when a value that is not within the list of predefined constants you have already specified is detected in any of your properties. Moreover, in case you’ve missed the parameter that is now causing the error in your Enum definition, you’ll be able to change the specification directly throughout your Warning Management View.
- Validation regex warnings: It happens when a property does not match with the regular expression pattern (Regex) to which all the values seen for a property must conform.
- Validation function warnings: When a property does not conform to the function provided to validate an event.
- Campaign validation warnings: When UTMs in your campaigns do not follow your campaign naming specifications.
You can learn more about how to validate property values with Enums.
Learn more about how to validate property values with regular expressions.
Learn more about function validations.
Learn more about campaign validation.
Recommended Specs Warnings
By now, Google Analytics 4 Recommended Events, Meta Standard Events, and TikTok Parameters and Standard Events are supported, with more coming soon. Contact support to let us know which tool you’d like to see next.

Consent Warnings
Let’s see what type of consent warnings you’ll be able to spot automatically:
Consent Violations
Trackingplan’s AI-powered learning system continuously observes your data to understand patterns and behaviors, adapting as your digital stack evolves.
When applied to consent, the system evaluates each cookie over a self-learning period:
- If consent is consistently granted above a certain threshold during this period, the cookie is automatically classified as “Consent Required.”
- If the system doesn’t detect any consent activity for a cookie during the learning period, it is classified as “Consent optional.”
This approach allows the system to intelligently determine which cookies need consent without manual setup (although you can always override the system’s decision and manually set any cookie to require consent or not, according to your own preferences).
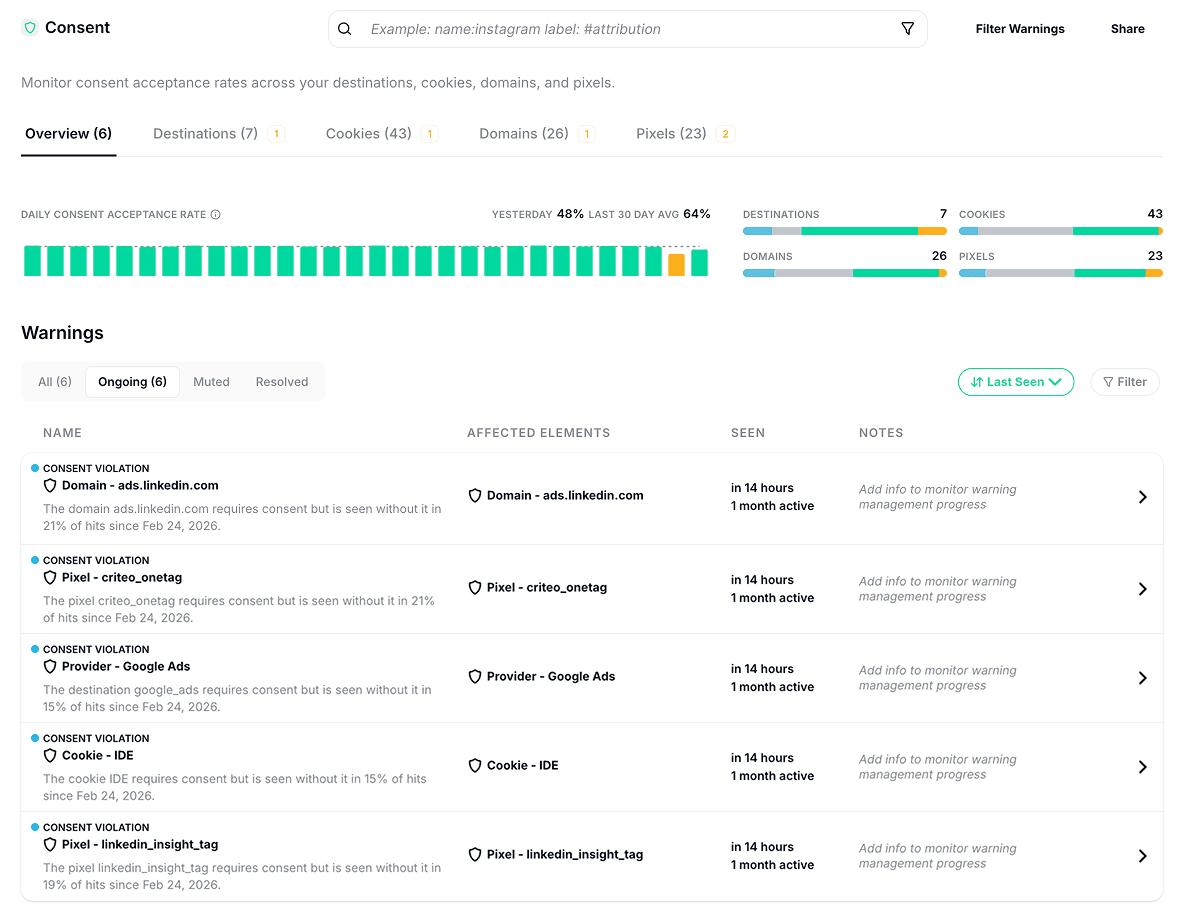
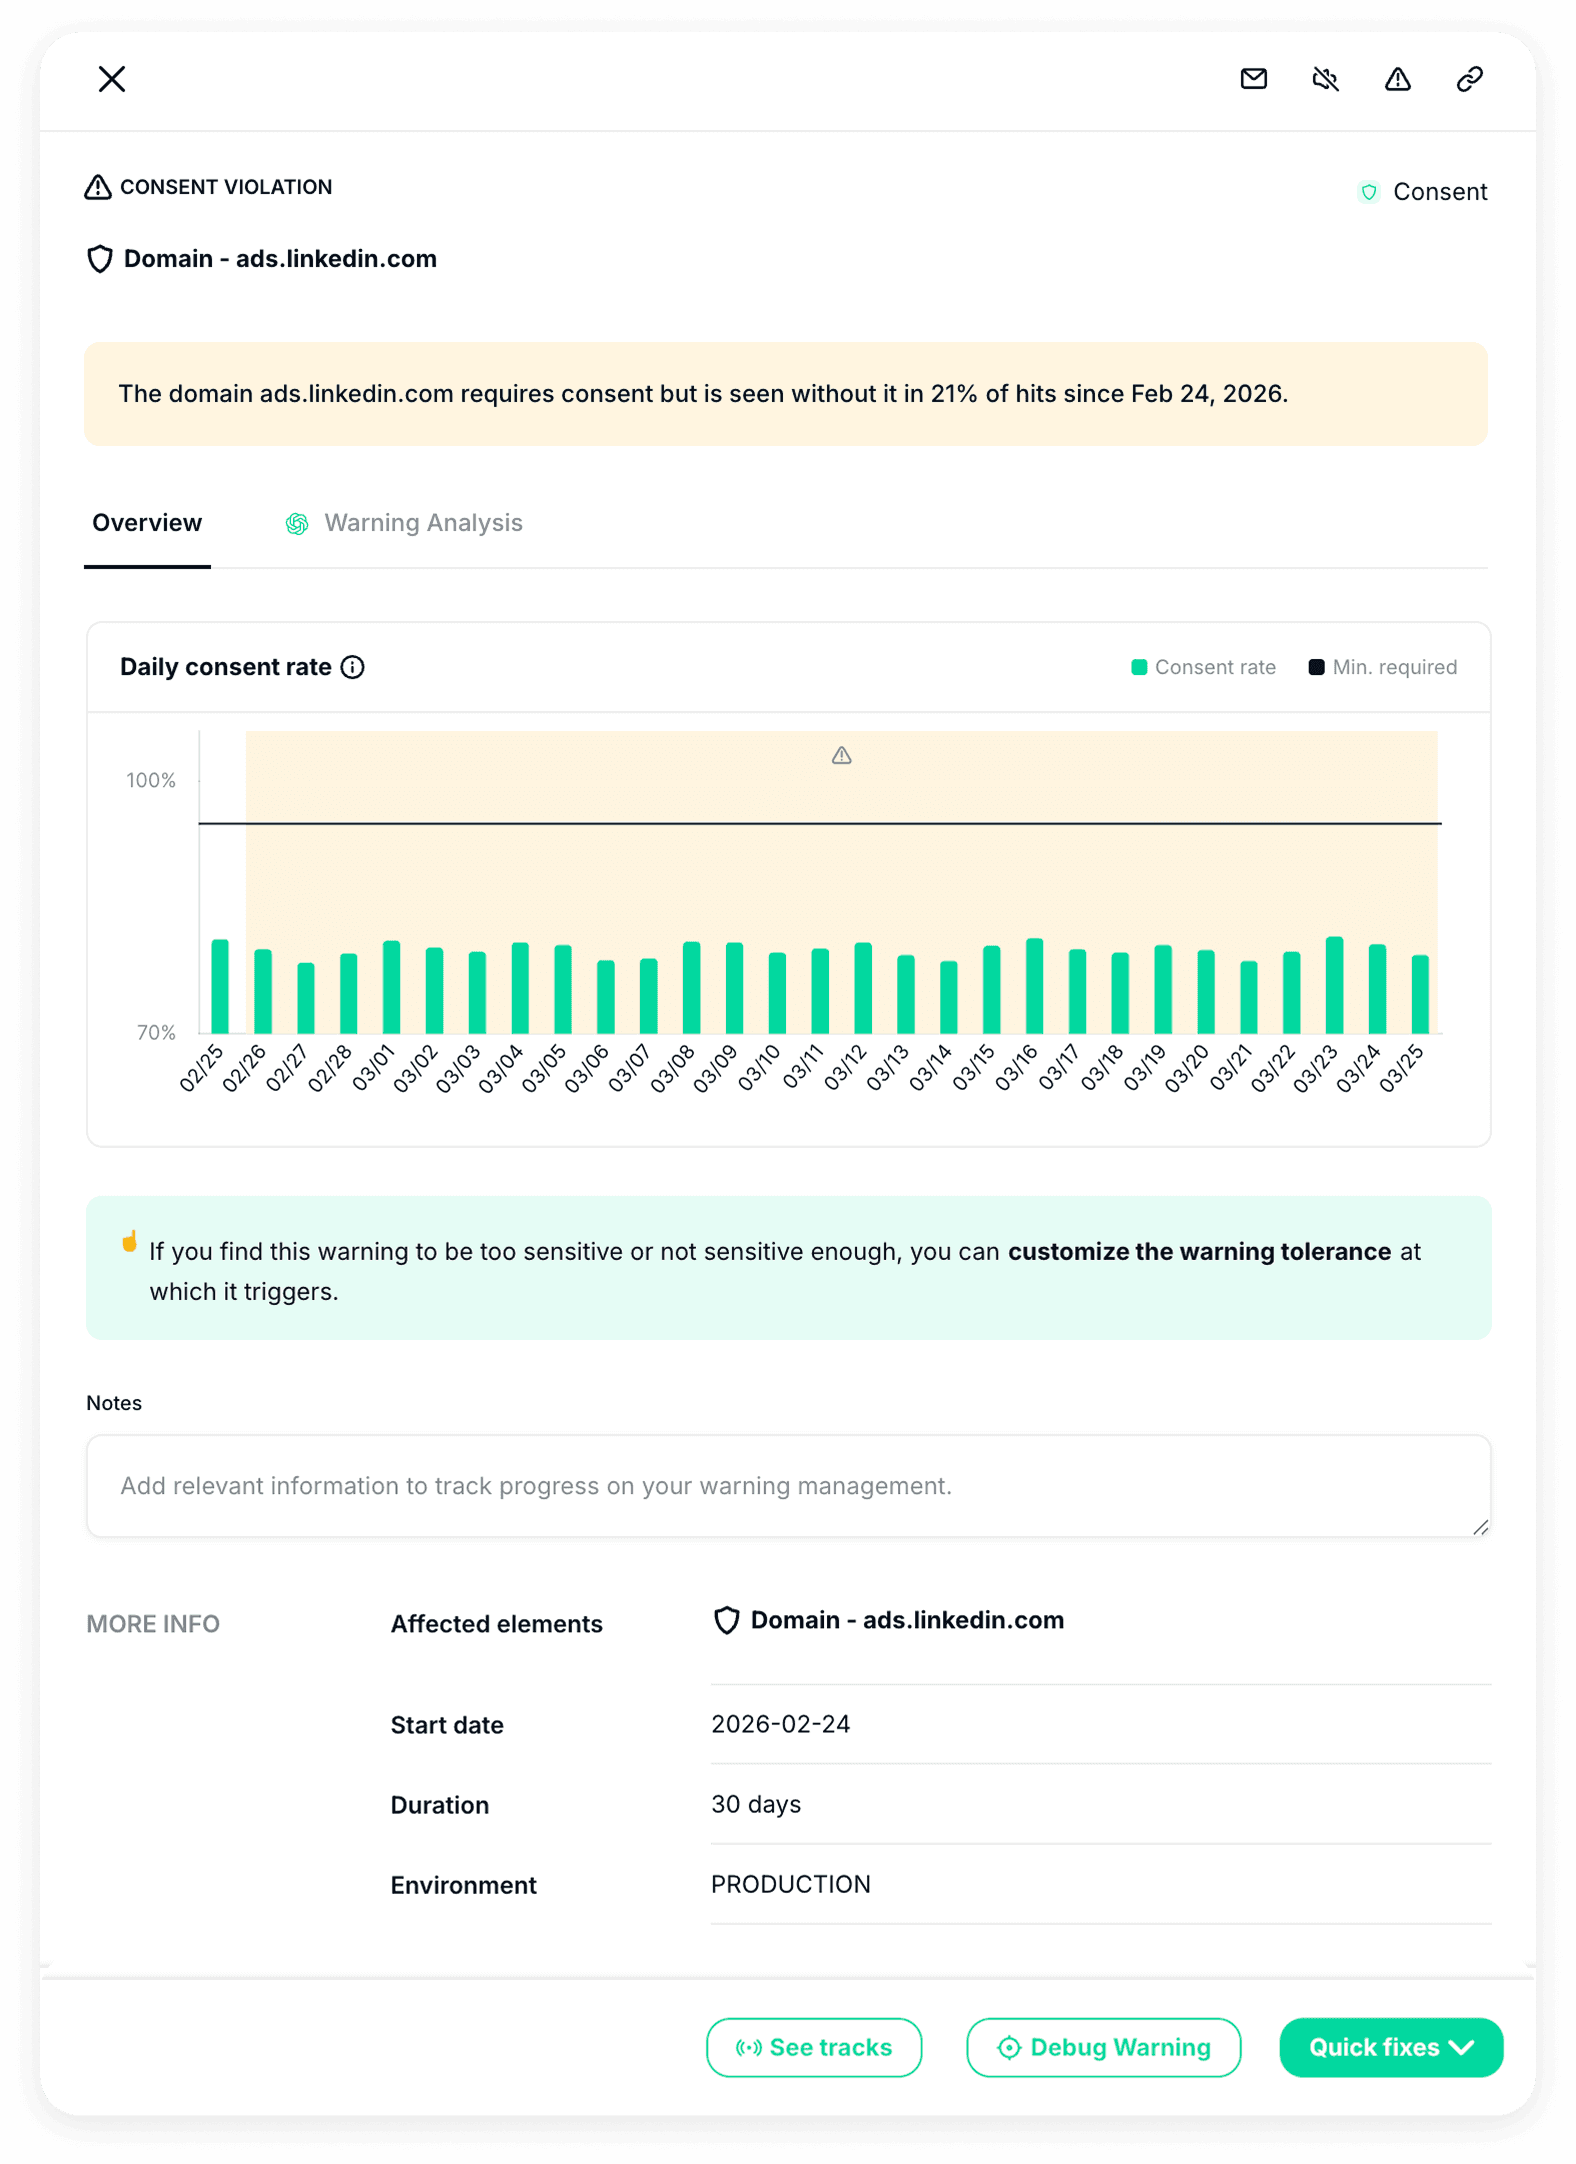
Once a cookie has been classified as "Consent Required," Trackingplan’s ongoing monitoring checks every session for compliance. A consent violation is triggered when:
- A cookie marked as “Consent Required” is detected without a corresponding user consent signal.
- A cookie that previously required consent suddenly stops receiving traffic under consented conditions.
These violations help you quickly identify misconfigurations in your CMP, tagging issues, or inconsistencies in consent signals, ensuring that your tracking setup remains compliant and aligned with user preferences.
Once again, for deeper investigation, Trackingplan’s Warning Analysis tab provides AI-powered, clear, human-readable explanations based entirely on your debug warning data, but presented in a way that’s easy to digest.
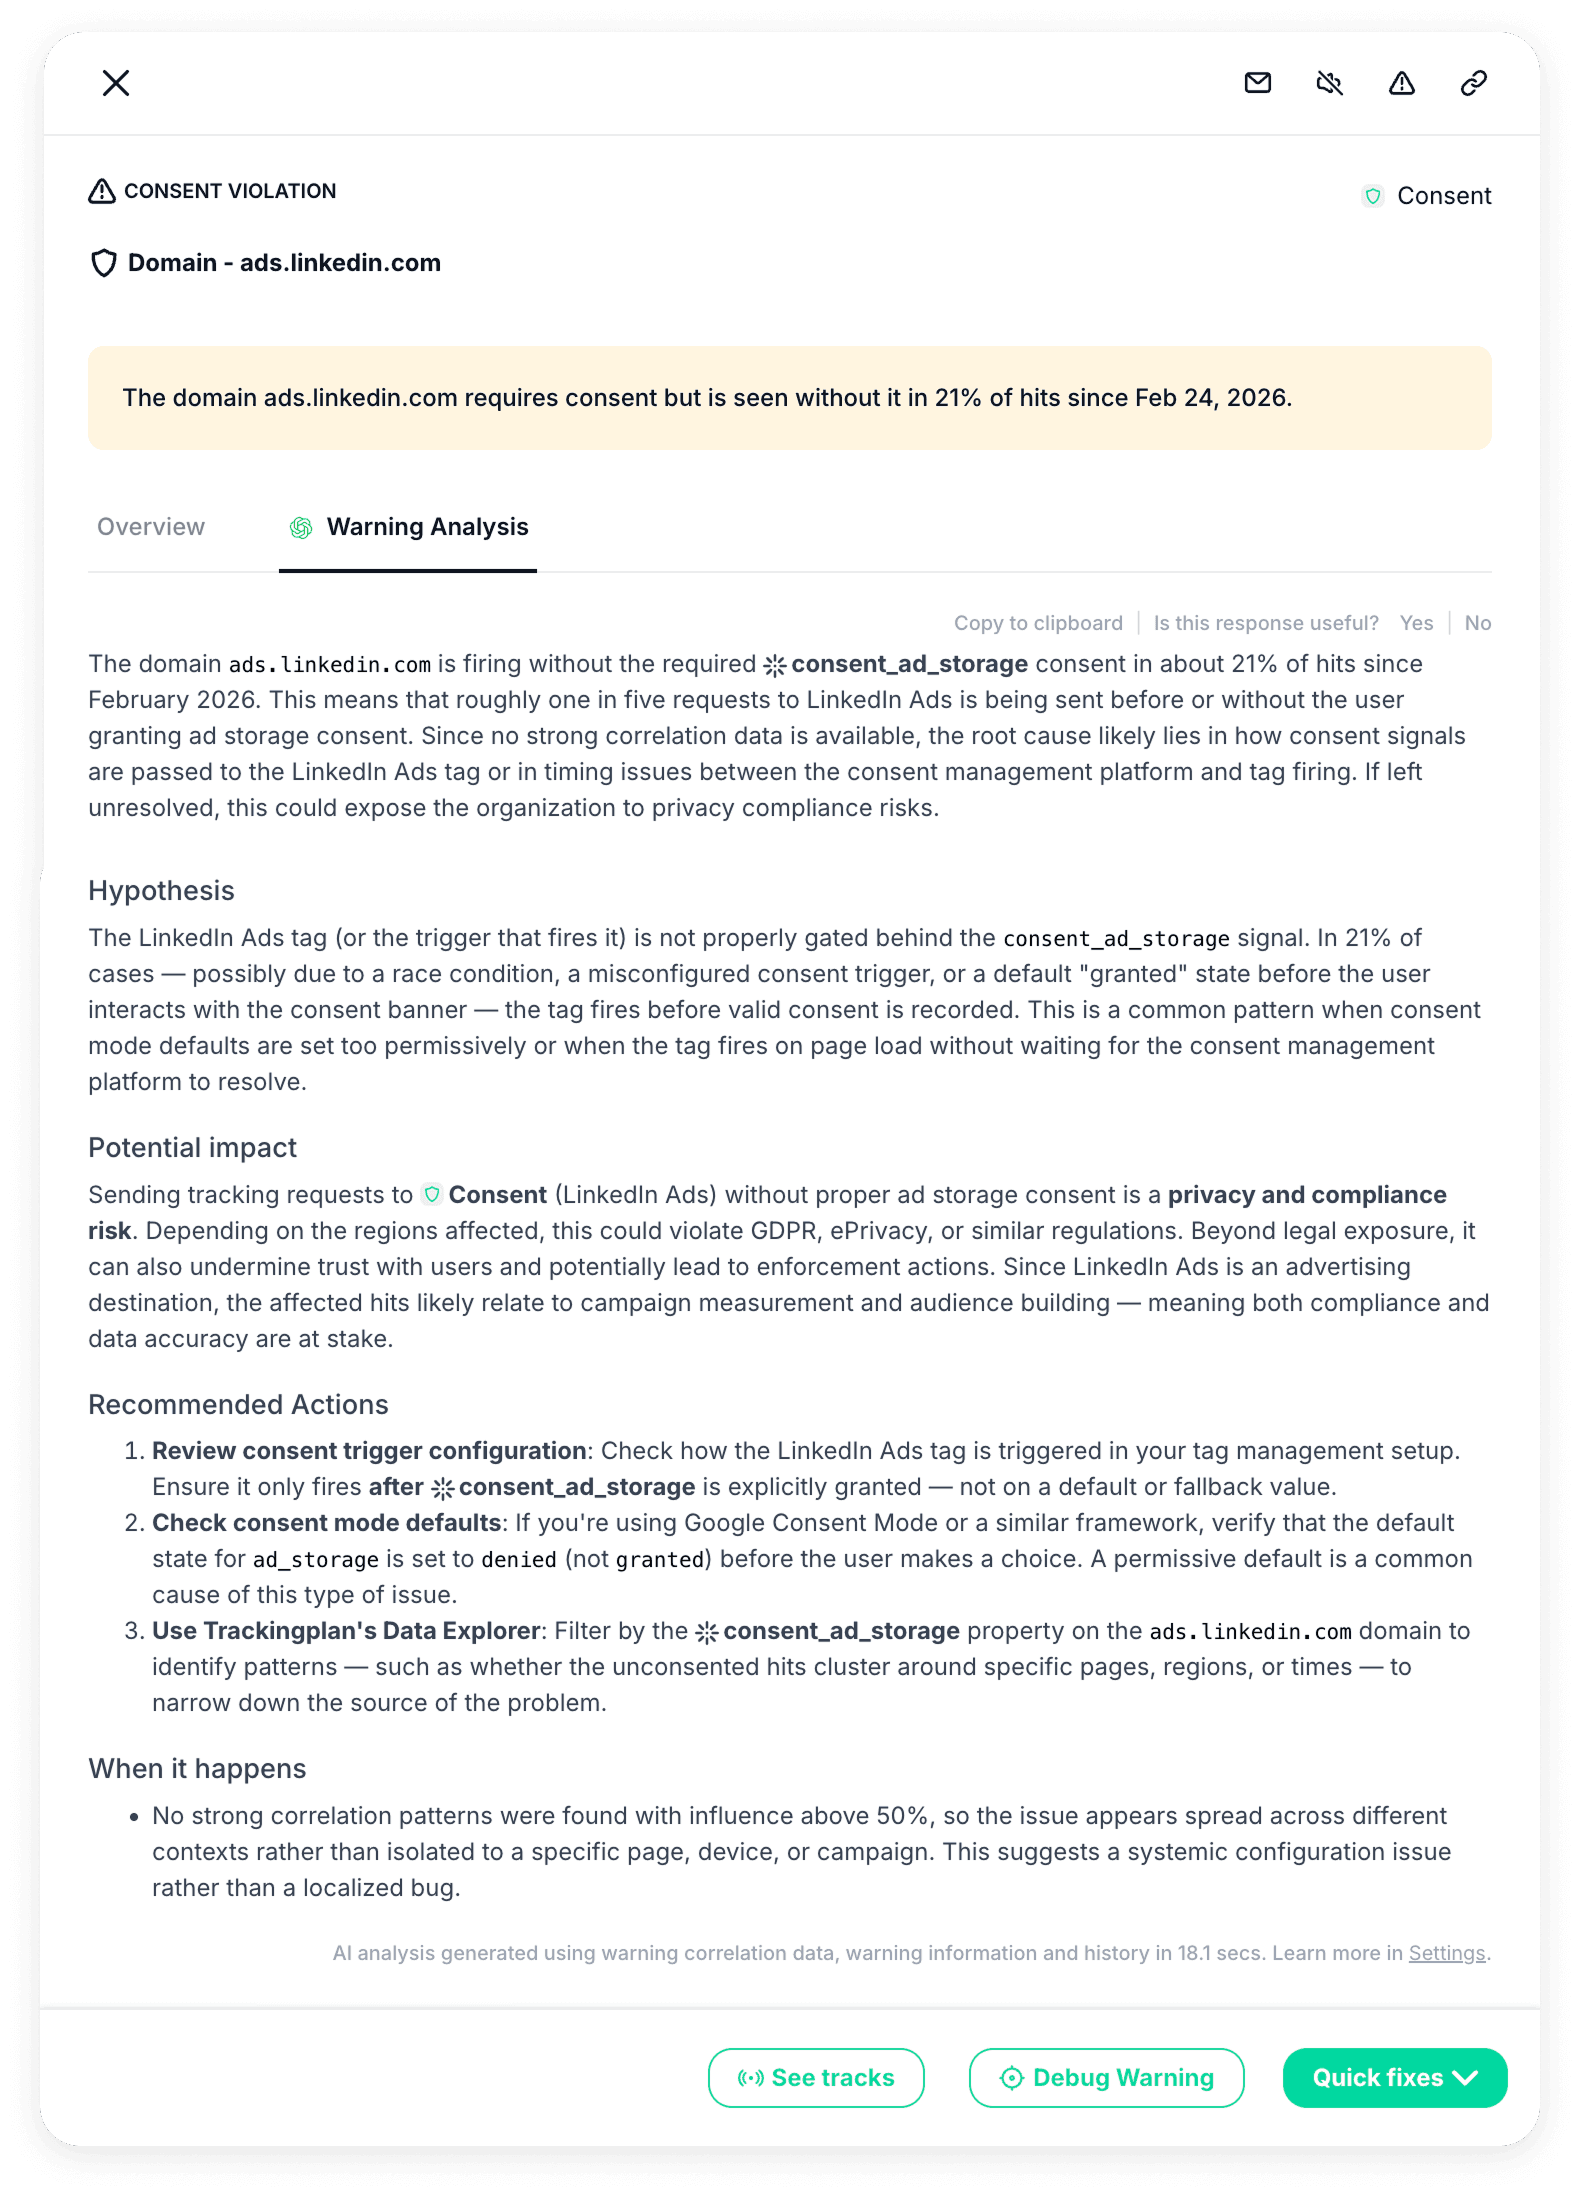
Daily Consent Acceptance Changes
Beyond individual violations, Trackingplan also monitors the overall consent acceptance rate across your website on a daily basis. This helps you detect unexpected shifts that could signal problems with your consent experience.
Trackingplan tracks the percentage of users who accept, reject, or ignore consent each day. With it, the system establishes a baseline based on historical data and automatically alerts you when:
- The acceptance rate drops significantly compared to the expected baseline (e.g., a sudden 15% drop in consent acceptance).
- The rejection rate spikes unexpectedly, suggesting users are actively opting out more than usual.
- There is an unusual change in the proportion of users who don't interact with the consent banner at all (which could indicate the banner is not rendering properly).
Learn more about Cookie and Consent Monitoring here.
Destination Implementation Warnings
Each of the different destinations we integrate with has specific peculiarities and limits. Although these are usually well-documented, their integrations lack controls, making it difficult to realize when certain data isn't being collected or when errors occur.
/w=1920,quality=90,fit=scale-down)
Google Analytics Implementation Warnings
Trackingplan will automatically implement a first set of validation functions to verify certain values and their limits within Google Analytics.
The following rules will activate automatically whenever Trackingplan detects hits for that provider:
- URL length: This will automatically validate that the Google Analytics endpoint URL falls within the specified limits.
- POST payload size: This will automatically validate that the size of the POST payload sent to Google Analytics is within the limits.

You can also disable Google Analytics Implementation Warnings through your settings at any time, and get more information about the problem on your Warning Management View.

Possible Warning Use Cases
- Events Stop: If several events stop occurring with a new release of your website or app, there may be a bug in the implementation of your analytics. Trackingplan helps you identify which events have been impacted in your landings or pages so you can address them quickly.
- Conversion Funnel Breakage: If your sales drop significantly in a short amount of time, something in your conversion funnel may be broken. Trackingplan will help you identify exactly where potential customers are leaving your funnel.
- Source Traffic Increase: If the level of traffic from a specific source increases, Trackingplan can help you identify where and why it did so from the moment it happened.
- Geographical Traffic Decrease: If your traffic from a specific location or country decreases, you can explore factors that may be impacting that market. With Trackingplan, you can quickly identify which geographical area has experienced a decrease in traffic.
- Payment Gateway Drop: If the conversion rate in your payment gateway drops 10% below normal, you could be receiving bad-quality traffic, or there may be pricing issues on some products. Trackingplan gives you a roadmap to start investigating the cause.
- User Navigation Changes: If user behavior changes and users start navigating to unexpected pages, you may need to optimize your funnel. The Trackingplan dashboard helps you identify how user behavior has changed by tracking increases and decreases in your events and properties.
Updates
Trackingplan will also notify you in real-time about all the changes in your tracking and will automatically monitor them so that you can ensure any update made in your analytics is implemented correctly and consistently across your organization.
- Active new events - When new hits are reported in an event for the first time.
- New properties - When new hits are discovered in a property for the first time.
- New pixels - When a new pixel is reported in any of the SaaS tools used in your frontends for the first time.


← Previous
Automated Alert System