Unlock growth with our guide to ecommerce performance metrics. Learn to track, analyze, and optimize data for higher ROI and better business decisions.
Ecommerce performance metrics are the numbers you track to see how your online store is really doing. They guide just about every decision you make, from where to spend your marketing budget to which parts of your website need a facelift.
Think of them as the vital signs of your business. They tell you what's working, what's broken, and where you need to focus your attention. But here's the catch: a single broken tracking pixel can turn your entire dashboard into a dangerous work of fiction.
Why Your Current Ecommerce Metrics Might Be Misleading You

Let me ask you a question: can you honestly, 100% trust the numbers staring back at you from your analytics dashboard? For a lot of ecommerce businesses, the real answer is "no." Too many teams are making big decisions based on data from flawed or incomplete tracking setups, where tiny, hidden errors lead to massively expensive mistakes.
This is a familiar headache for digital analysts and marketers everywhere. You see an inexplicable drop in traffic or get campaign results that just don't add up, and you're left scratching your head.
The old saying "garbage in, garbage out" has never been more true. A single misconfigured pixel on a product page or a broken event in your checkout flow can trigger a domino effect, corrupting every single metric it touches. These are the silent data killers, working behind the scenes to paint a completely distorted picture of your performance.
The Real Cost of Unreliable Data
When you can’t count on your data, the fallout is serious. Bad metrics can trick you into:
- Killing your winners: If your Return on Ad Spend (ROAS) is underreported because of a tracking glitch, you might just pause a highly profitable ad campaign.
- Funding your losers: On the flip side, if conversions are misattributed, you could end up pouring more cash into channels that aren't actually delivering.
- Ignoring UX nightmares: A broken "Add to Cart" event could make a product look unpopular. In reality, customers want to buy it—they just physically can't.
To stop being fooled by surface-level numbers, you have to understand the online advertising performance metrics that truly matter—like ROAS, CPA, and LTV. But none of these are worth a dime without a solid, validated data foundation underneath them.
Validating your ecommerce performance metrics is the non-negotiable first step toward achieving genuine, sustainable growth. Without data integrity, you are essentially flying blind.
This guide won't just walk you through the essential metrics. More importantly, it will introduce you to data observability—the real solution to making sure those metrics are accurate. We'll show you how to finally move from questioning your data to trusting it completely.
To run a profitable online store, you need to speak the language of your data. While there's no shortage of metrics you could track, a few core pillars give you the essential insights you need to grow strategically.
Getting a handle on these four—Conversion Rate, Average Order Value, Customer Lifetime Value, and Customer Acquisition Cost—is like giving your business a complete health check. They form the bedrock of every smart decision you'll make.
Think of it like building a house. You wouldn't start putting up walls without a solid foundation. These metrics are that foundation, supporting every marketing campaign, product launch, and website tweak.
Before we dive deep, here's a quick cheat sheet for the core metrics we'll be covering.
Core Ecommerce Metrics At a Glance
This table is a great starting point, but the real power comes from understanding how these numbers interact and what stories they tell about your business. Let's break them down one by one.
Conversion Rate: The Ultimate Report Card
Your Conversion Rate (CVR) is probably the most straightforward gut check for your website's performance. It simply tells you what percentage of visitors took the action you wanted them to take—for most stores, that means making a purchase.
Imagine 100 people walk into your physical shop. If only one person buys something, you know something’s off. Maybe the layout is confusing, the prices aren't clear, or the music is terrible. CVR is the digital version of that scenario, acting as a direct report card on your user experience and product appeal. According to Shopify, a typical ecommerce conversion rate hovers between 2.5% and 3%.
A low CVR almost always signals friction somewhere in the customer journey. Is your checkout process a maze? Are your product pages falling flat? Is a slow site speed sending people running for the exit? Watching your CVR helps you spot these pain points so you can start turning more browsers into buyers.
Average Order Value: Squeezing More from Every Sale
Next up is Average Order Value (AOV). This metric tracks the average dollar amount spent each time a customer places an order on your site. While CVR tells you how many people are buying, AOV tells you how much they’re spending in one go.
Think of AOV as the size of each customer's shopping cart. Bumping it up is one of the quickest ways to boost revenue without spending a dime more on acquiring new customers. A low AOV is a sign that you're leaving money on the table.
Strategies like product bundling, setting a free shipping threshold, or suggesting relevant add-ons during checkout are all classic moves to increase AOV. A higher AOV means better profitability on every single sale.
Here are a few proven tactics to get customers to add more to their cart:
- Upselling: Offer a slightly better, more premium version of the product they're looking at.
- Cross-selling: Recommend complementary items that go perfectly with what’s already in their cart.
- Volume Discounts: Give them a better price per unit if they buy in larger quantities.
- Free Shipping Thresholds: This one is a classic for a reason. 93% of shoppers say it encourages them to buy more, making it a powerful psychological nudge.
Customer Lifetime Value: Playing the Long Game
While AOV is all about a single transaction, Customer Lifetime Value (CLTV) zooms out to look at the big picture. It measures the total revenue you can reasonably expect from a single customer throughout their entire relationship with your brand.
This metric is where you shift from chasing one-off sales to building long-term relationships. A customer who makes ten small purchases over two years is often way more valuable than someone who makes one huge purchase and vanishes. Understanding CLTV is what justifies your investment in great customer service, loyalty programs, and retention marketing.
It answers the most important question: how much is a customer really worth? Once you know that, you can make much smarter calls about how much you should be willing to spend to get them—and keep them.
Customer Acquisition Cost: The Price of Growth
Finally, there’s Customer Acquisition Cost (CAC). This is the total amount you spend to land one new customer. It rolls up all your sales and marketing costs—ad spend, content creation, even salaries—and divides it by the number of new customers you brought in.
CAC is your reality check. If it costs you $100 to acquire a customer, but their first purchase is only $50 (your AOV), you’re in the red on that transaction. This is where the magic happens when you look at these metrics together. That $100 CAC might be perfectly fine if you know your average CLTV is $500, because you’ll make a healthy profit over time.
A sustainable business model absolutely requires your CLTV to be significantly higher than your CAC. Keeping an eye on this ratio ensures your marketing budget is actually generating a return and that your growth is profitable. Without it, you’re just flying blind.
Decoding Your Checkout Funnel to Reduce Cart Abandonment
The checkout funnel is where casual window shoppers turn into actual customers. It's the most crucial part of their entire journey with you.
Think about it: when someone adds an item to their cart, they're showing serious intent to buy. Losing them at this final hurdle is like fumbling the ball on the one-yard line. It’s a huge missed opportunity, and one that hurts.
A high cart abandonment rate is one of the biggest red flags for any ecommerce business. It's a direct signal that there’s friction in your user experience—specific roadblocks that are actively turning eager buyers away. Tracking this metric isn't just about watching a number go up or down; it's about dissecting a critical process to find out exactly where and why your revenue is leaking out.
This is how key metrics flow together to build a profitable business, starting with getting the conversion, then growing the sale, and finally keeping the customer long-term.
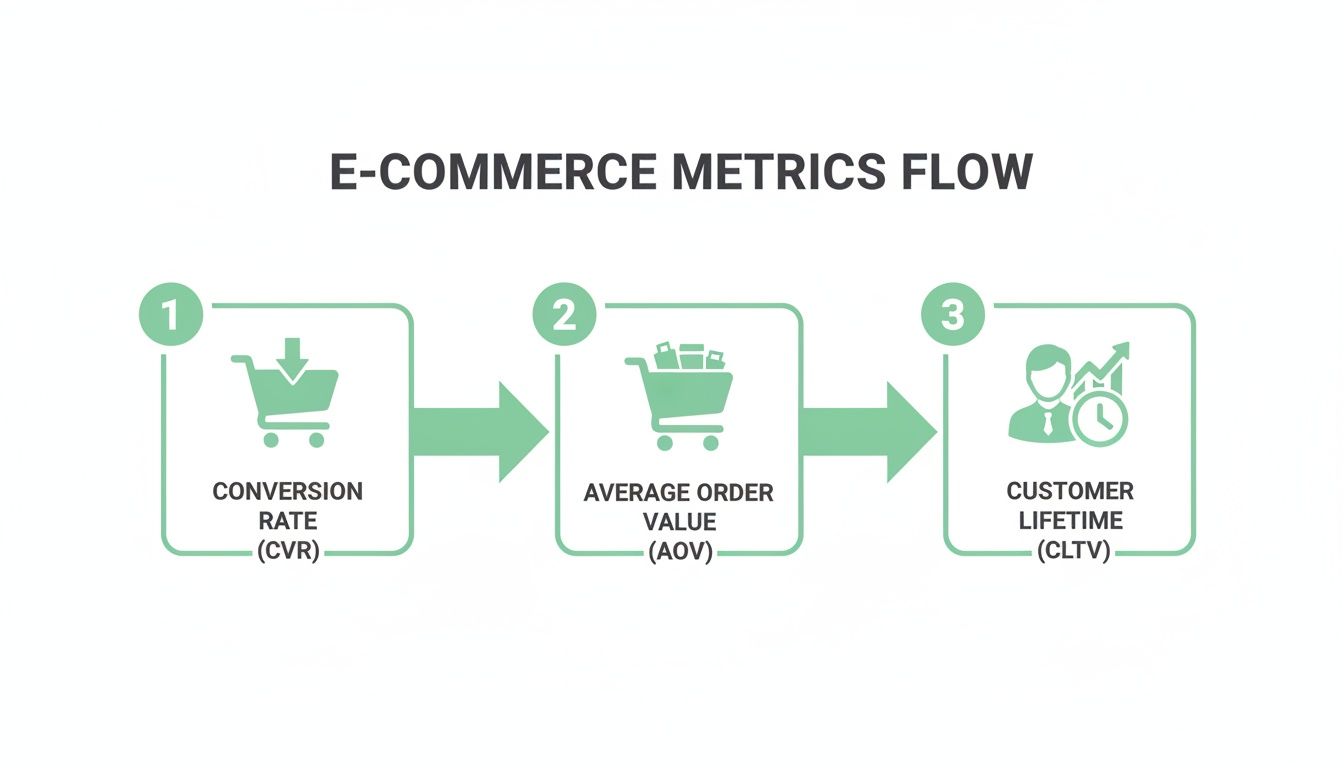
As the diagram shows, success starts with Conversion Rate (CVR), gets amplified by the size of each sale (Average Order Value), and is sustained by building long-term Customer Lifetime Value (CLTV).
Uncovering Common Checkout Culprits
To figure out what’s going wrong, you have to put yourself in your customer's shoes and walk through the checkout process yourself. The path from "Add to Cart" to "Purchase Confirmation" is surprisingly fragile, with a few common points where people tend to drop off.
Globally, shopping cart abandonment rates have crept above 70%, which is a massive challenge for ecommerce stores. This directly impacts conversion rates, which hover at a slim average of just over 2%. This data shows just how many sales get agonizingly close to the finish line before slipping away.
So, what causes people to leave? Let's look at the usual suspects:
- Unexpected Costs: This is the big one. High shipping fees, taxes, or other charges that magically appear at the final step are the number one reason for abandonment.
- Forced Account Creation: Making someone create an account before they can buy adds a ton of unnecessary friction. A guest checkout option is absolutely essential.
- A Complicated Checkout Process: Too many steps, confusing forms, or a clunky layout can easily overwhelm and frustrate potential buyers.
- Payment and Security Worries: A lack of trust signals, limited payment options, or a payment gateway that looks unprofessional can scare customers away right at the end.
When Silent Data Killers Sabotage Sales
While user experience issues are common, there’s a more sinister problem that often lurks in the shadows: broken data tracking. These "silent data killers" can completely sabotage your checkout funnel without any obvious visual clues.
For instance, a misconfigured consent banner could be blocking analytics events from firing, making it look like users are dropping off when they're actually trying to move forward. Or maybe a broken pixel on the payment confirmation page is failing to record a completed sale.
Your analytics might show a massive drop-off on the payment page, leading you to believe there's a problem with your payment options. In reality, the tracking event that confirms a successful payment is simply broken, and your sales are being severely underreported.
This is where a complete picture of the customer journey becomes so critical. Without accurate tracking at every single step, you can't pinpoint the real source of friction. You could end up wasting weeks trying to "fix" a perfectly fine page while the real issue is buried in your data implementation. To learn more about this, check out our guide on how to conduct a customer journey analysis in GA4.
Beyond just the funnel's design, the nuts and bolts of your payment systems can also have a huge impact on conversion. For deeper insights into improving the payment experience, resources on optimizing your payment processes can be invaluable. By combining a smooth user experience with flawless data tracking, you can transform your checkout funnel from a leaky bucket into a powerful conversion engine.
Mastering ROAS and Marketing Attribution
Once customers start converting, the big question becomes: how much did it cost to get them here, and was it worth it? This is where Return on Ad Spend (ROAS) and marketing attribution come into play. These metrics are your window into connecting the ad budget you spend directly to the revenue it brings in.
It's easy to mix up ROAS with Return on Investment (ROI), but they're not the same beast. ROI gives you the big picture of your overall business profitability. ROAS, on the other hand, is laser-focused on a single ad campaign’s performance. It answers one simple question: for every dollar I pumped into this ad, how many dollars did I get back?
Understanding and Calculating ROAS
Figuring out your ROAS is pretty straightforward. Just take the total revenue generated from a specific ad campaign and divide it by what you spent on that campaign.
ROAS = Total Revenue from Ads / Total Cost of Ads
Let's say you spend $1,000 on a Google Ads campaign, and it pulls in $5,000 in sales. Your ROAS is 5:1. Simple, right? You earned $5 for every $1 you spent. This calculation makes it easy to compare the performance of different channels—like deciding whether to double down on Facebook Ads or your latest influencer push.
The Challenge of Marketing Attribution
Calculating ROAS looks simple on paper, but its accuracy hangs entirely on your marketing attribution model. Attribution is just a fancy way of saying you’re giving credit to the different marketing touchpoints a customer interacts with before buying. The real problem is that the customer journey is almost never a straight line.
The old-school "last-click" attribution model, which gives 100% of the credit to whatever the customer clicked right before a sale, is often flat-out wrong. It completely ignores all the other valuable interactions—like the blog post they read last week or the social media ad that first caught their eye.
Think about it. A customer might see your brand on Instagram, click a retargeting ad on Facebook a few days later, and then finally search for your brand on Google to make a purchase. A last-click model gives all the glory to Google, acting like Instagram and Facebook never existed. This skewed perspective can trick you into cutting budget from top-of-funnel channels that are actually doing the heavy lifting of building awareness. That's why developing more sophisticated, data-driven attribution models in GA4 is so critical for seeing the full picture.
How Bad Data Wrecks Your ROAS
The single biggest threat to getting ROAS and attribution right is bad data. Your calculations are only as good as the numbers you feed them, and a few common tracking errors can send your results completely off the rails.
Here’s how data integrity issues can sabotage your marketing metrics:
- Inconsistent UTM Tagging: If one person on your team uses
utm_source=facebookand another usesutm_source=Facebook, your analytics platform sees them as two separate sources. This splits the data, making your campaign look like a dud when it's actually performing well. - Broken Ad Pixels: If the tracking pixel on your confirmation page fails to fire, those conversions simply disappear from your records. Your ROAS will tank, and you might end up pausing a highly profitable ad because you think it's failing.
- Mismatched Campaign Data: When the campaign name in your ad platform doesn't line up perfectly with what's in your analytics tool, the data can't connect. This leads to underreported revenue and a completely flawed attribution story.
This screenshot shows how a data observability platform gives you a heads-up on these kinds of issues in real time.
The dashboard instantly flags anomalies and validation errors, making sure the data fueling your ROAS calculations is clean and trustworthy. Without this kind of automated monitoring, you’re stuck making critical budget decisions based on broken or incomplete information—a surefire recipe for wasted ad spend.
Setting Realistic Benchmarks for Your Industry
Looking at your ecommerce metrics in a vacuum is like checking your car's speedometer without knowing the speed limit. A number like a 2% conversion rate might feel good or bad, but without any context, it’s just a number. That context is the secret ingredient to setting goals you can actually hit and getting a real read on your store's health.
One of the biggest mistakes you can make is comparing your performance to broad, global averages. It's a recipe for frustration. Every industry, every region, and every business model plays by a different set of rules. You wouldn't expect a high-end B2B software company to have the same conversion rate as a fast-fashion brand, so why hold your own store to an irrelevant standard?
Why Industry Averages Matter
Think about it: the journey to buy a new car is worlds apart from buying a t-shirt. These massive differences in how people behave, how often they buy, and how much they spend are what create such dramatic swings in performance benchmarks from one industry to the next.
Take conversion rates, for example. They're all over the map. One analysis of 14 different industries found an all-industry average of 2.9%, but the results were wildly different at the sector level. Personal care products soared to 6.8% and food & beverages hit a healthy 4.9%. Meanwhile, general retail and home decor trailed behind at 1.9% and 1.4%. It's a clear picture of how purchase intent shapes results. If you want to go deeper, you can read the full research about industry conversion rates.
This is exactly why digging up reports specific to your vertical isn't just a nice-to-have; it's non-negotiable. The goal is to measure yourself against your actual competitors and peers, not the entire ecommerce universe.
Segmentation Beyond Industry
Even beyond your specific vertical, other factors can dramatically change what a "good" metric looks like. To get a truly clear picture of your performance, you have to slice and dice your data.
Here are a few key segments to always keep in mind:
- Device Type: It's no secret that mobile conversion rates are often lower than desktop. If most of your audience is on mobile, your overall conversion rate will naturally look different from a store with mostly desktop visitors.
- Traffic Source: Someone coming from a branded search ad is ready to buy. They'll convert at a much higher rate than a user who just stumbled upon your brand for the first time through a social media post.
- Region: Customer behavior, cultural norms, and purchasing power can vary wildly from one country to the next.
Before you even think about comparing your metrics to an external benchmark, you have to be absolutely sure your own data is clean. A simple tracking error can make it look like you're failing when the real problem is just bad measurement.
At the end of the day, faulty data is the biggest roadblock to any meaningful benchmarking. If your tracking pixels are misfiring or your UTM tags are a mess, the metrics you're looking at will be skewed. This can create the illusion that you’re falling behind industry standards when, in reality, your analytics setup is just failing to capture what's really happening. Clean, validated data is always the first step before any comparison can tell you anything useful.
The Hidden Data Killers Sabotaging Your Metrics

So, you’ve defined your metrics and set some realistic benchmarks. But when you look at your reports, something still feels… off. You think you’re looking at a map of your business, but it's more like a funhouse mirror—distorting reality and pointing you down the wrong path. This is what happens when invisible errors corrupt your data right at the source.
These "hidden data killers" are the silent saboteurs of your ecommerce metrics. They aren’t obvious bugs that crash your site. They’re subtle, persistent tracking errors that quietly poison your analytics dashboards, leading to flawed strategies and wasted ad spend. It’s time to move past the theory and into the real-world problems that plague even the sharpest teams.
The Aftermath of a Simple Update
Picture this: your dev team pushes a routine website update. The site looks great, and on the surface, everything is working fine. But behind the scenes, a small change to the site's code broke the connection to your marketing pixels.
Suddenly, your ROAS for a key campaign tanks. It looks like a top-performing ad set has inexplicably failed overnight. Without knowing the pixel is broken, your first instinct is to kill the campaign, cutting off what was actually a valuable revenue stream—all because of a phantom performance issue. This is a classic case of a tiny technical glitch having a massive financial impact.
A single broken pixel can make a profitable marketing channel appear worthless. Manual audits might eventually catch this, but by then, days or weeks of sales data have already been lost, and poor decisions have been made based on faulty information.
When Third-Party Scripts Go Rogue
Your ecommerce site probably relies on a handful of third-party scripts for things like live chat, customer reviews, or personalization tools. While they’re useful, these scripts can sometimes interfere with your core analytics tracking by firing off rogue or duplicate events.
A common scenario is a third-party tool firing its own "add_to_cart" event that doesn't match your analytics schema. This can lead to massively inflated add-to-cart numbers, making your conversion funnel look much healthier at the top than it really is. You might start celebrating a surge in engagement, totally unaware that the data is just noise.
Here are a few common data killers to watch for:
- Broken Pixels: After a site redesign or code push, marketing and analytics pixels can stop firing altogether, leading to underreported conversions and sales.
- Schema Mismatches: Your
dataLayersends product information in one format (likeproduct_id), but your analytics tool expects another (item_id). This mismatch leaves you with incomplete or missing product performance data. - Inconsistent UTM Tagging: One team member uses
utm_source=facebookwhile another usesFacebook. This simple inconsistency splinters your data, making it impossible to get a clear picture of channel performance.
The Cost of Inconsistent Campaign Tagging
Inconsistent UTM tagging is one of the most common—and damaging—self-inflicted wounds in marketing analytics. It’s a problem that gets worse as your team grows, quickly turning your campaign reports into a chaotic mess.
When tagging conventions aren't strictly enforced, you can’t accurately attribute revenue to the right source. This leads to misinformed budget allocation. You might overinvest in a channel that looks like a superstar, only because data from several other channels is accidentally being lumped in with it.
These problems all point to a critical vulnerability: manual checks and periodic audits just aren't enough anymore. They are slow, reactive, and can't possibly catch the thousands of potential data issues that can pop up every day. This constant data decay sets the stage for a more modern, automated solution to ensure your ecommerce performance metrics are always reliable.
Achieving True Data Confidence with Analytics Observability
After diving into the silent data killers that poison your reports, one thing becomes crystal clear: the old ways of validating data just don't cut it anymore. That frantic cycle of discovering a problem, scrambling to find its source, and patching it days later means you're always making decisions with yesterday's broken information.
This is where a totally different approach, analytics observability, changes the entire game.
Think of it as a 24/7 security detail for your data. Instead of waiting for a manual audit to tell you a tracking pixel broke last week, an analytics observability platform keeps a constant watch on your entire Martech stack in real time. It becomes the single source of truth that marketing, analytics, and development teams can all stand behind.
This is how you move from a reactive "find-and-fix" mess to a proactive state of prevention, finally restoring trust in your ecommerce metrics.
Moving From Data Doubt to Proactive Prevention
An automated observability platform is built from the ground up to neutralize the silent data killers we've talked about. It works quietly in the background, validating every step of your data's journey to give you genuine confidence that the numbers in your dashboards reflect reality.
Here’s how it delivers immediate value:
- Continuous Monitoring: The platform automatically discovers and maps out your entire Martech stack, watching every event from the moment it fires in the dataLayer to its final destination.
- Real-Time Alerts: You get an instant ping in Slack or email the moment something breaks—a sudden traffic anomaly, a malformed event, or a schema mismatch. No more surprises.
- Automated Validation: It constantly checks your marketing pixels from platforms like Google and Facebook, making sure every dollar of ad spend is accounted for and your ROAS calculations are solid.
By automating the tedious, error-prone work of data validation, teams can stop wasting hours chasing ghosts in the machine. Instead, they can focus on strategic work that actually moves the needle.
This proactive stance makes sure your data foundation is always solid. You can get a much deeper look into this approach by exploring this complete guide to automated marketing observability and seeing how it builds a more resilient analytics strategy.
Building a Single Source of Truth
The ultimate goal is to end the expensive "blame game" that erupts between teams when data goes sideways. When marketers, analysts, and developers are all looking at the same validated information, collaboration just clicks into place.
An observability platform creates this unified view. It delivers detailed root-cause analysis that pinpoints exactly what broke, where it happened, and why. This level of clarity empowers teams to resolve issues faster and, more importantly, stop them from happening again.
By restoring confidence in the ecommerce metrics that steer your business, you can finally make every decision with certainty, knowing your data is accurate, complete, and trustworthy.
Stop flying blind and start trusting your data. Trackingplan provides a fully automated observability and analytics QA platform to help you detect and fix tracking issues in real time, ensuring your ecommerce metrics are always accurate. Get started with Trackingplan.