Data Explorer
Welcome to the evolution of Trackingplan's Property Values Histogram, designed to provide you with deeper insights into your data values and streamline your analysis processes like never before!
What's New?
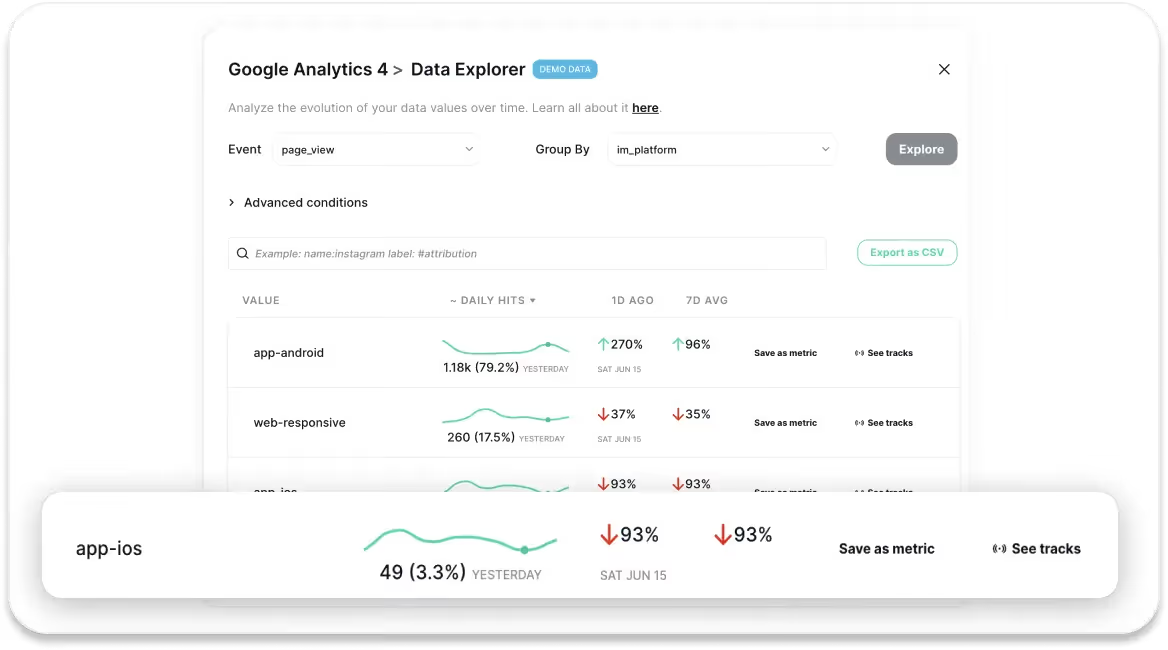
With Trackingplan's Data Explorer, you'll be provided with a new chart displaying all values sorted by their frequency and proportion. This will allow you to analyze the evolution of your data values over time, providing valuable insights without depending on a specific event to understand how your data behaves.
In there, in a simple interface and without the need for SQL knowledge, you’ll be able to delve into the behavior of an event by filtering by values of its properties, metadata, DataLayer values, and attribution data.
Plus, you can now search for advanced conditions and even download samples for each value to view specific example payloads!
How Does it Benefit You?
Deeper Analysis
With Trackingplan’s Data Explorer, all the data collected during a real session can be explored and the behavior of the data can be studied without requiring the reproduction of the error or the user's environment (language, browser, device, etc...).
- Visualize Data Evolution: Analyze the evolution of your data values over time with ease, gaining valuable insights into data behavior.
- Advanced Search: Search for advanced conditions to make the search process more efficient and effective, enabling you to pinpoint specific data trends.
- Easily create Metrics: From each of the values displayed, you’ll be able to save them as metrics. Custom metrics allow you to monitor certain events without the noise of potential errors in these properties.
- See tracks: But that’s not all! You can also see tracks for each of your values to be provided with a real data example of what is sent to your providers when your events are triggered, showing you the real picture of what the browser captured to help you get all the necessary context to debug issues in record time.

Google’s Consent Mode & Trackingplan’s Data Explorer
In addition to standard tracking parameters, Google consent mode parameters will be tracked as attributions in Trackingplan’s Data Explorer, providing a comprehensive view of user consent actions within your analytics ecosystem. Learn more about Google’s Consent Mode & Trackingplan here.
.avif)
Moreover, by using the advanced conditions menu, you can swiftly pinpoint specific consent actions, such as those whose consent has been denied.

Get Started Today
Ready to explore Trackingplan's Data Explorer and gain deeper insights into your data? Get started to avoid all small and hard-to-detect data issues or ask for a demo.