
A data agent answers “what was revenue by channel?” in a sentence. It is the wrong tool for “which kinds of sessions convert, and what does next month look like?” That is an analysis: several steps, a model, charts, and choices someone should be able to inspect later. In BigQuery, the agent for that is the Data Science Agent, and it works in a notebook.
This guide runs three analyses on your agent layer with it: an exploration, a forecast, and a segmentation. The point is not the results, since the public sample is obfuscated. It is learning how to direct the agent and check its work.

Goal of this guide: three analyses in a notebook, written by the agent, reviewed and rerun by you.
You need: the agent_layer tables from guide 4, or the pipeline from guide 9.
Open the agent
The Data Science Agent runs in Colab Enterprise notebooks. Your project needs four APIs enabled: BigQuery, Gemini for Google Cloud, Dataform, and Compute Engine.
In BigQuery, open your project, go to Notebooks > New notebook > Empty notebook, and click the spark button, Toggle Gemini in Colab. A side panel opens where you write prompts.
To give it data, select a BigQuery table with the table selector, type its name as project_id:dataset.table, or mention it with @, which searches the tables in the current project. You can also upload a CSV file.
How it works: plan, accept, run
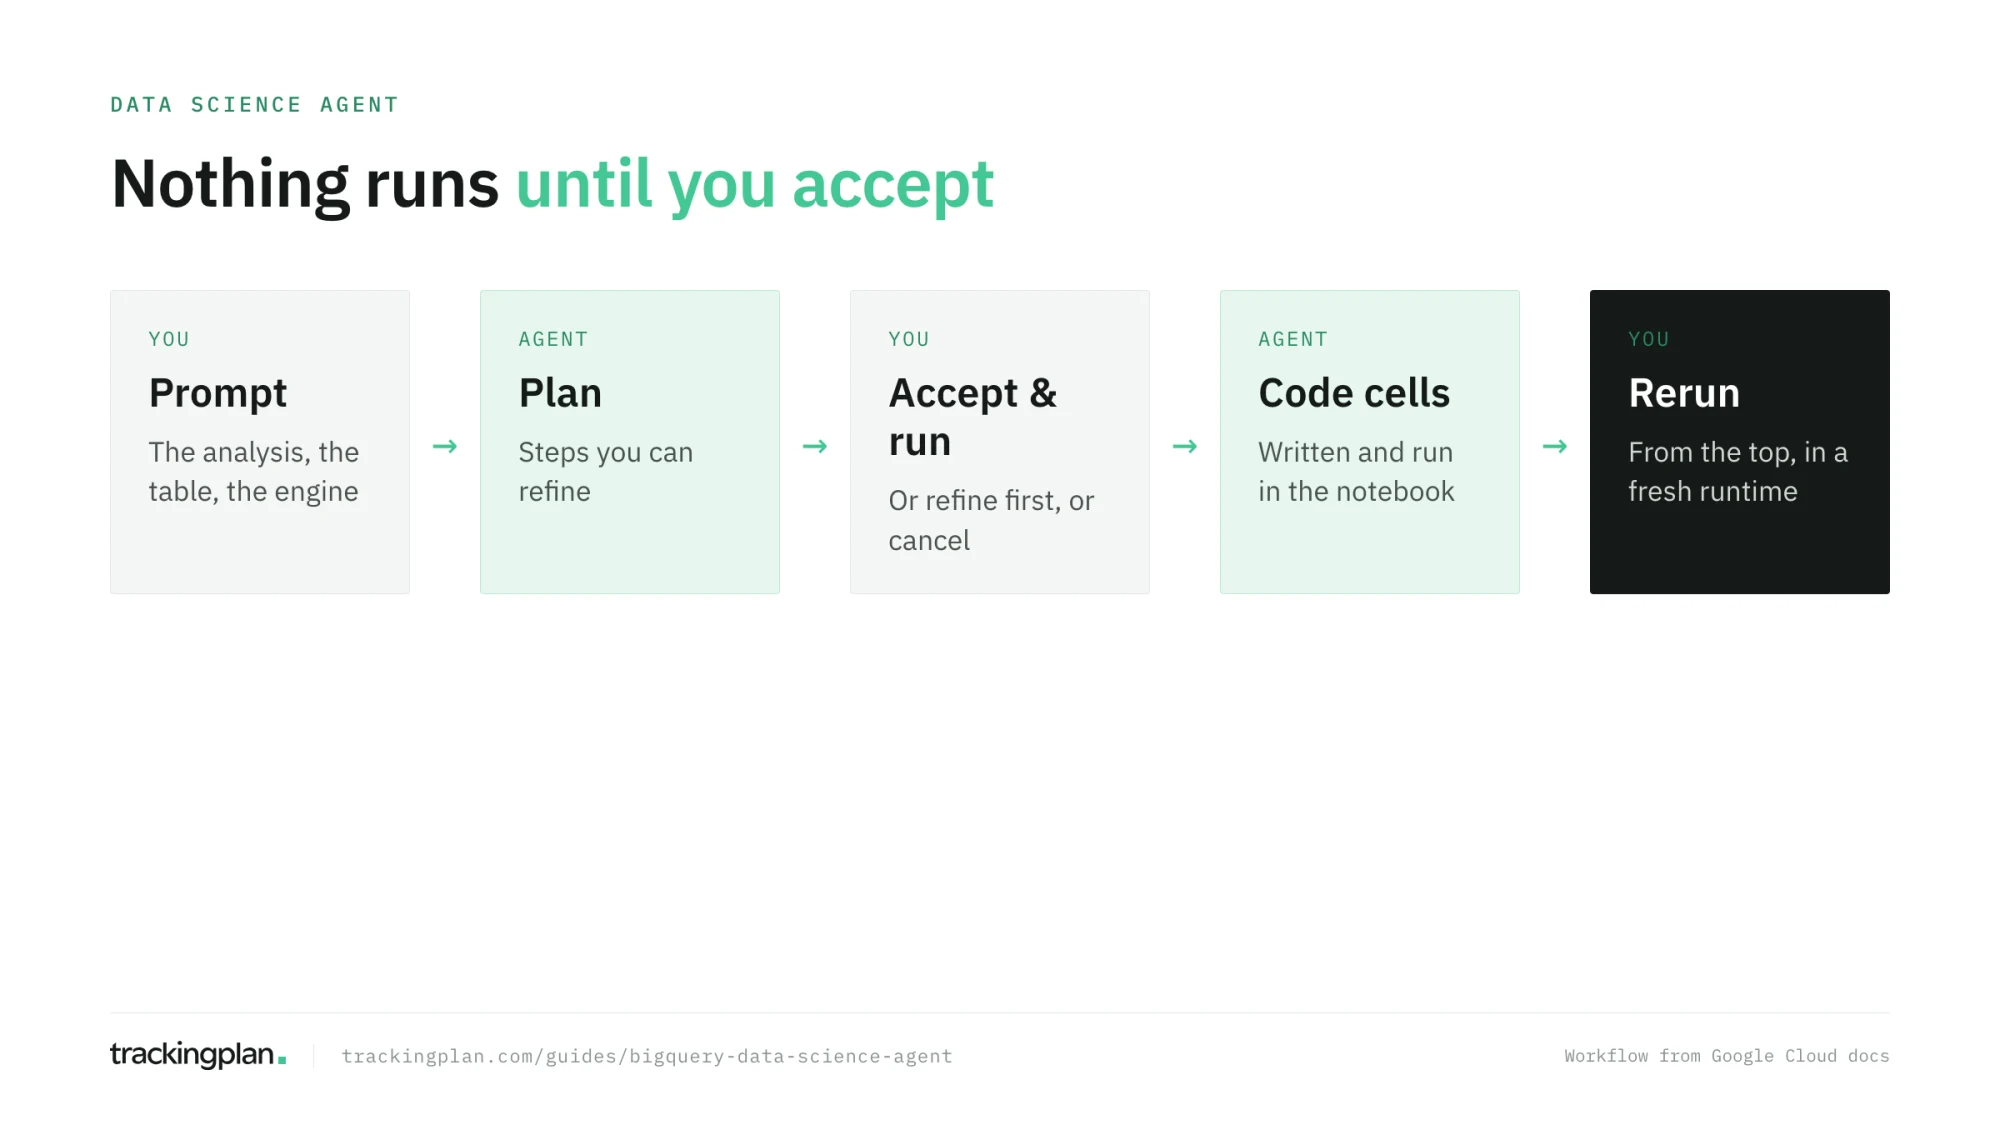
You describe the analysis; the agent writes a plan of steps. You can refine the plan before anything runs. When you click Accept & run, it writes code and text cells into the notebook and runs them on the notebook’s runtime. Later steps can ask for another Accept & run, and Cancel stops it at any point.
The result is an ordinary notebook. The code stays when the agent is done: you can read it, change it, rerun it, and share it. That is the main difference from a data agent’s answer, and the main reason to use this agent for anything you will present.
Choose the engine with the prompt
By default the agent writes Python with open-source libraries such as scikit-learn, pulling data into the notebook. A keyword in the prompt changes that:
| Say in the prompt | It uses |
|---|---|
| nothing | Python with open-source libraries |
| “SQL” or “BigQuery ML” | BigQuery ML, inside BigQuery |
| “BigQuery DataFrames” or “BigFrames” | BigQuery DataFrames |
| “Apache Spark” or “PySpark” | PySpark |
For GA4 data at any real scale, prefer BigQuery ML or BigQuery DataFrames: the work runs in BigQuery instead of copying the table into the notebook.
Analysis 1: explore the sessions
Explore @agent_layer.sessions: row count, date range, share of missing values
per column, sessions and conversion rate by device_category and medium, and
a chart of daily sessions. Point out anything that looks unusual.
Read the plan before you accept it. Check that it computes conversion rate as converted sessions over all sessions, not something else. When it runs, look at the missing values first: on the public sample, some columns hold placeholder values, and on your own data a column that is 40% empty is a tracking question before it is an analysis question.
Analysis 2: forecast daily revenue
Using BigQuery ML, build a daily revenue series from @agent_layer.purchases
and forecast the next 30 days. Show the forecast with its prediction
interval on a chart, and evaluate the model on the last 14 days of history.
Saying “BigQuery ML” makes the agent build the series and the model in SQL. Check three things in the code: that every day appears in the series, including days with no purchases; that the evaluation holds out the last days rather than random ones; and that the chart shows the interval, not only the line. Three months of obfuscated sample data won’t produce a forecast worth trusting; the exercise is to read how it was built.
Analysis 3: segment the sessions
Cluster the sessions in @agent_layer.sessions into four to six segments using
device_category, medium, page_views and converted. Describe each segment in
plain language with its size and conversion rate, and explain how you chose
the number of segments.
Clustering always finds segments, whether or not they mean anything. Ask the agent to justify the number it chose, and read the description of each segment against the numbers in the notebook, not only its summary.
Check its work
Everything from guide 6 applies, with more code to read. For any analysis you will share:
- Rerun the notebook from the top in a fresh runtime. If it doesn’t run, it isn’t done.
- Check the first query of every step against the checklist from guide 2.
- Look for silent filters: rows dropped for missing values, outliers removed, dates cut off.
- Ask the agent to explain any step you don’t understand, in a new prompt.
Bring the results back to your data agent
An analysis is most useful when its results become something people can ask about. Three ways to close that loop:
- Segments as a column. If the segmentation holds up, ask the Data Engineering Agent from guide 9 to add the segment to
agent_layer.sessions, with a description that says how it was computed and when. Your data agent can then answer “conversion rate by segment”. - Definitions in the glossary. Each segment gets a glossary term in your data agent, with the plain-language description from the notebook, so “high-intent mobile sessions” means the same thing to everyone who asks.
- Forecasts as a table. Write the forecast to a table, with the date it was produced, and add a verified query that reads it. People asking “what do we expect next month?” then get the number your analysis produced, not a new one improvised in a chat.
Each of these turns a one-off notebook into context the whole team uses, and each one needs a test case in your set from guide 8.
When to use which agent
| You want | Use |
|---|---|
| A number, now, in a chat | A data agent (guides 5 to 8) |
| A pipeline that rebuilds tables every day | The Data Engineering Agent (guide 9) |
| An analysis with steps, charts, or a model, that someone can rerun | The Data Science Agent |
Exercise
Run the three analyses. For each one, write down every choice the agent made that you didn’t specify: a filter, a parameter, a definition. Then rerun the notebook from the top and confirm it reproduces.
How to know you got it right
- You refined at least one plan before accepting it.
- Your forecast was built with BigQuery ML and evaluated on held-out days.
- Your notebook reruns from the top without errors.
- You can say when you would use this agent instead of a data agent.
Resources
- Use the Data Science Agent, Google Cloud docs: setup, data sources, the plan workflow, and example prompts.
- Boost Productivity with Gemini in BigQuery, Google Cloud Skills Boost: an introductory course on Gemini’s help across BigQuery, including notebooks and data canvas.
- Advanced SQL, Kaggle Learn: analytic functions, the SQL behind most time series work.
FAQ
What is the BigQuery Data Science Agent? An agent inside Colab Enterprise notebooks in BigQuery Studio. You describe an analysis, it writes a plan, and after you accept it, it writes and runs the code in the notebook: exploration, charts, forecasting, and machine learning, on BigQuery tables or CSV files.
How is the Data Science Agent different from a data agent? A data agent answers a question with a query and a number, in a chat. The Data Science Agent runs a multi-step analysis in a notebook, with Python or BigQuery ML, and leaves you the code. Use the data agent for questions, and the Data Science Agent for analysis you want to inspect, rerun, or hand over.
Can the Data Science Agent use BigQuery ML? Yes. By default it writes Python with open-source libraries; mention SQL or BigQuery ML in the prompt and it uses BigQuery ML instead. Mentioning BigQuery DataFrames or Spark selects those libraries.
Next: Build your own: the Conversational Analytics API, ADK, and MCP.