
A campaign launches, the dashboards look normal, and three hours later someone notices that mobile conversions have disappeared. The investigation starts with the tag manager, then moves to browser network requests, dataLayer states, warehouse tables, consent settings, and ad-platform diagnostics. By the time the team finds the broken event, marketing has already made decisions using incomplete data.
That workflow is no longer reliable enough for modern analytics stacks. Digital implementations connect tag managers, analytics platforms, customer data tools, validation layers, warehouses, attribution models, and advertising destinations. A failure in one component can appear as a missing event in another, a schema violation somewhere else, and a misleading dashboard trend downstream. Automated root cause analysis changes the task from searching through symptoms to tracing evidence back to the component that introduced the failure.
Why Manual Debugging Fails Modern Analytics Stacks
Manual debugging usually begins after the business has already felt the impact. An analyst receives a message about falling conversions, checks the reporting interface, and compares the current period with an earlier baseline. The data may show a real decline, but it doesn't explain whether a campaign changed user behavior or whether the measurement system stopped recording purchases.
The analyst then opens the tag manager and inspects recent versions. They check browser requests for missing parameters, compare dataLayer payloads, query warehouse tables for null properties, and review consent configuration. Each check answers a narrow question. None necessarily connects the answers into a reliable causal chain.
A broken advertising pixel can resemble a traffic problem. A renamed event property can look like a warehouse transformation error. A consent configuration change can suppress events only for particular browsers, regions, or device types. The more tools a company adds, the harder it becomes for one person to maintain a complete mental model of every dependency.
The cost of symptom-first investigation
Traditional root cause analysis often follows the first visible anomaly. A dashboard shows fewer purchases, so the team examines the dashboard query. The query looks correct, so someone checks the warehouse table. The table contains fewer rows, which sends the investigation toward ingestion. Later, the team discovers that the original problem began in a tag manager deployment.
That sequence creates avoidable delay because each system exposes only part of the story. The Forge Reliability failure analysis guide is useful background for teams formalizing failure investigations, particularly when they need to distinguish symptoms, contributing factors, and an originating cause.
Practical rule: Treat every visible analytics anomaly as an observation, not a diagnosis.
Automated RCA works differently. It continuously observes the implementation, detects deviations from expected behavior, and connects related signals across the stack. Instead of asking an analyst to inspect every tag and destination manually, it can identify that a missing purchase event, a property mismatch, and a downstream reporting gap share the same upstream component.
Why the old workflow breaks down
Reactive debugging assumes that people can reconstruct system behavior after the incident. Modern martech systems make that assumption fragile. Dependencies change through releases, consent updates, campaign configuration, schema edits, and vendor-side changes. A single deployment can alter what reaches several destinations without producing an obvious browser error.
Automation doesn't remove the need for human judgment. It gives the team a better starting point, with the affected event, probable origin, downstream impact, and supporting evidence assembled before the investigation becomes a chain of guesses.
How Automated Root Cause Analysis Works
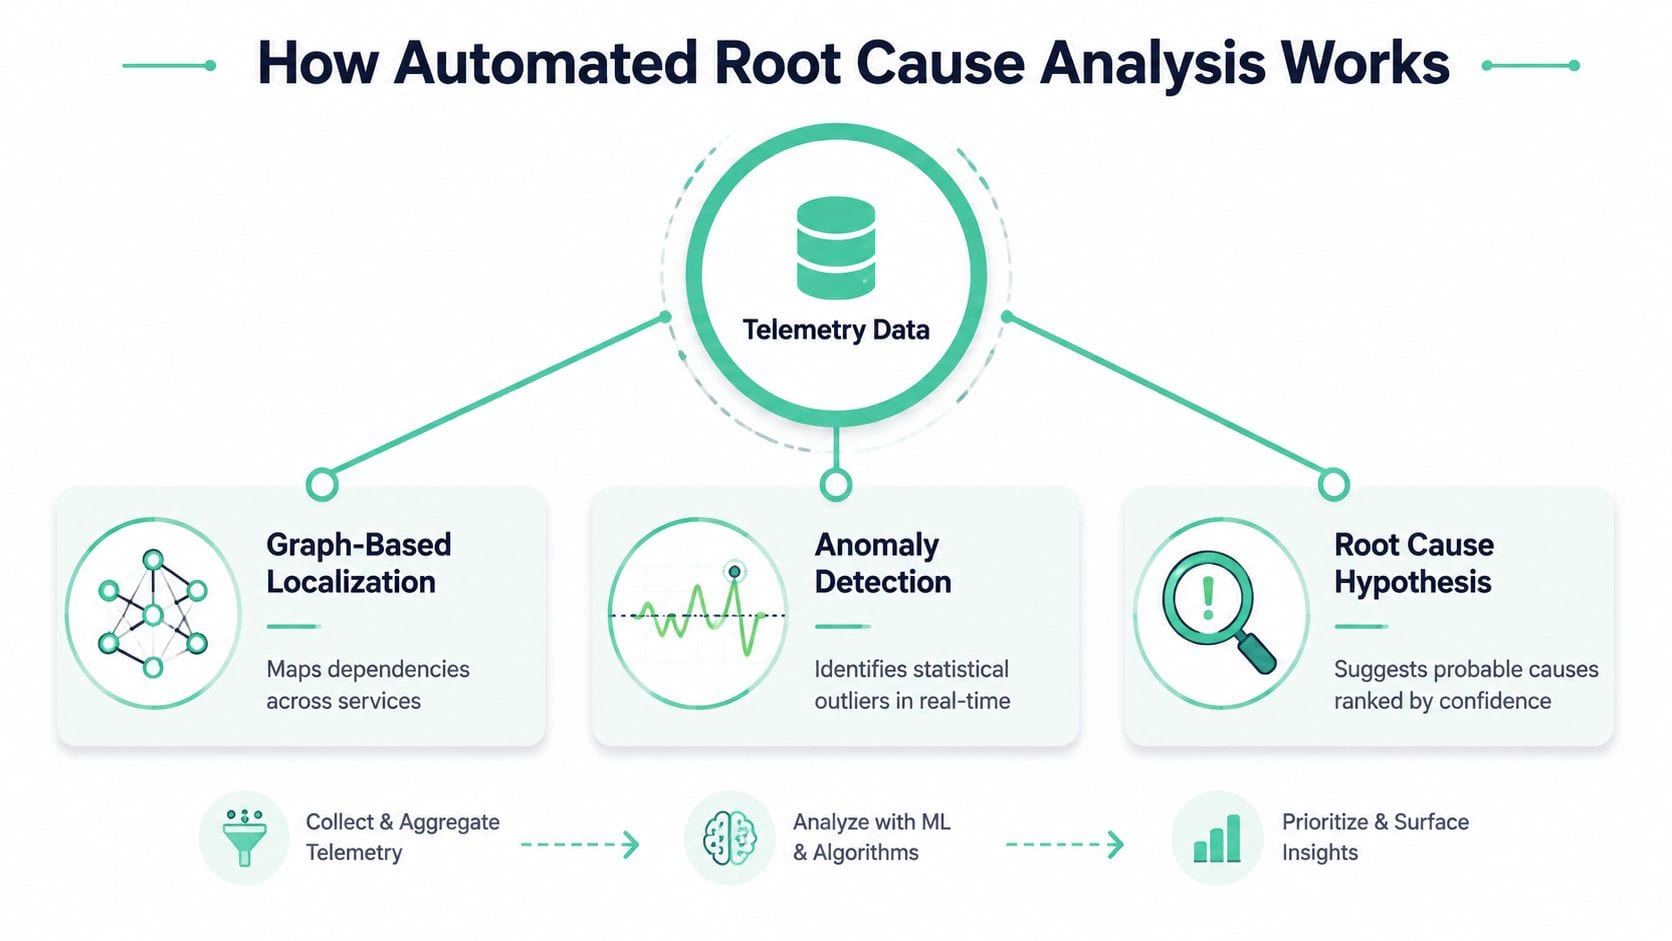
Production RCA begins with telemetry, then builds an explanation from evidence. For analytics teams, telemetry can include event volumes, property values, validation results, browser requests, data-quality signals, warehouse records, and destination responses. The system detects abnormal behavior and compares the relationships among affected signals instead of treating each alert as an isolated failure.
Graph-based localization supplies the dependency model. A graph connects sources, transformations, validation rules, analytics tools, and destinations. When several nodes report problems, the algorithm searches for the component that best explains how the issue spread. The node producing the loudest alert may be downstream, so ranking it first can send an investigation in the wrong direction.
Why one signal isn't enough
A missing Google Analytics event can leave evidence across several layers:
- Collection layer: The browser no longer sends the expected event.
- Validation layer: The event violates a required schema or property rule.
- Warehouse layer: The corresponding record never arrives or contains an unexpected field.
- Reporting layer: A dashboard shows a drop in conversions.
- Destination layer: An advertising platform receives incomplete conversion data.
A metric-only system may find the dashboard anomaly. A log-only system may expose an ingestion warning. A trace-only system may follow one request while missing the wider data-quality effect. Multi-source RCA compares these signals and ranks the upstream node that explains the full pattern.
The RCAEval benchmark reflects this requirement. It defines 735 real failure cases across three microservice systems and includes 15 reproducible baselines spanning metric-based, trace-based, and multi-source methods. That structure is useful for evaluation, but benchmark performance does not establish production reliability. Analytics teams still need to test whether a tool ranks the right dependency during their incidents, with their schemas, consent rules, and destination behavior.
Segment analysis finds the affected slice
Analytics failures rarely affect every user equally. A tag may fail only on mobile, a consent rule may affect a particular region, or a schema mismatch may appear on one checkout path. Segment analysis isolates that subset by sampling records, comparing segments, clustering related failures, and measuring bad rows against good rows.
A device type, browser group, campaign, event version, or destination can then become a stronger root-cause candidate than an overall traffic metric. Teams evaluating Trackingplan's debugging behavior can review how its AI debugger identifies the root cause of analytics errors. The useful test is whether its recommendation links the anomaly to observable evidence and a specific dependency, not merely whether it produces a plausible explanation.
Building an Automated RCA Pipeline for Analytics
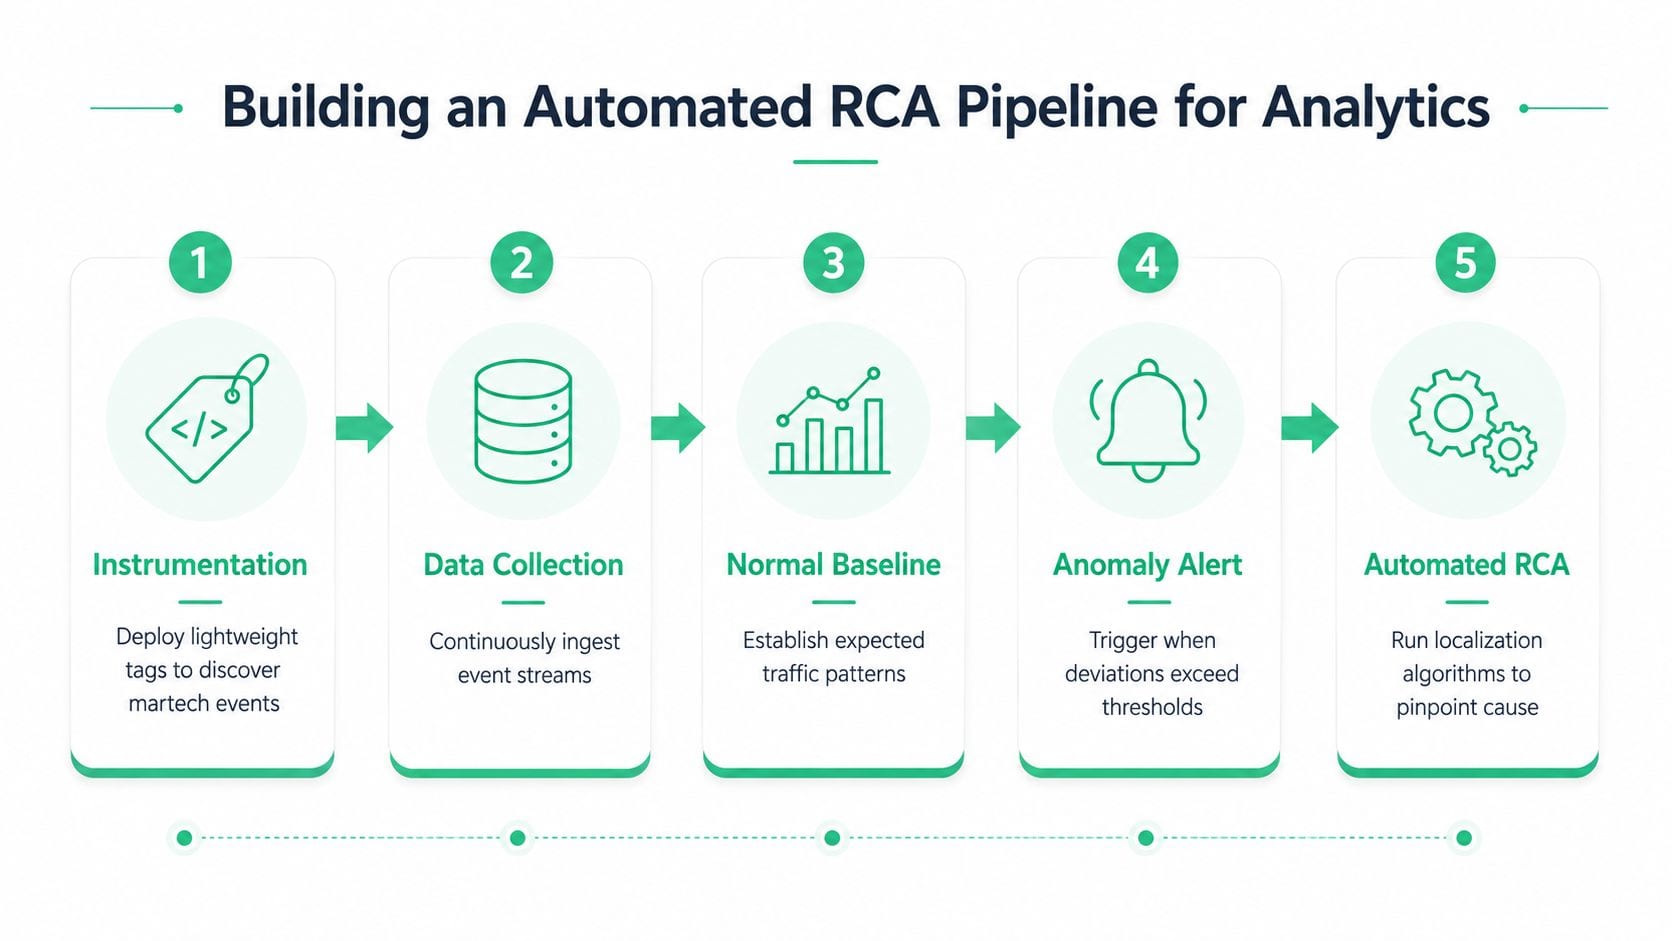
A dependable pipeline begins before the first alert. It starts by defining what the analytics implementation is supposed to emit, where each event should go, which properties are required, and how downstream teams use the data.
Start with instrumentation and lineage
Deploy lightweight tags or SDKs that can observe the implementation from the dataLayer through analytics and marketing destinations. The instrumentation should identify events, properties, pixels, requests, and relevant context without requiring analysts to maintain a separate manual inventory.
Next, build lineage. A useful lineage map shows how a source event moves through transformations and validation rules before reaching Google Analytics, Adobe Analytics, Segment, Snowplow, warehouse tables, attribution models, and ad platforms. Without that map, anomaly detection can tell you that something is wrong but may not explain where the defect entered the system.
Data quality monitoring becomes more useful when paired with field-level lineage and a data catalog. This combination can identify the issue, trace it toward its origin, and show which downstream use cases depend on the affected field, as described in this overview of automated root cause analysis for data quality.
Establish expected behavior
The system needs a normal baseline before it can distinguish an incident from ordinary variation. Monitor traffic patterns, event presence, property distributions, UTM conventions, pixel delivery, consent outcomes, and schema compliance.
Useful checks include:
- Traffic anomalies: Identify unexpected changes in event or page activity.
- Missing or rogue events: Detect events that disappear or arrive without an approved definition.
- Schema mismatches: Flag renamed, missing, or incorrectly typed properties.
- Campaign errors: Catch inconsistent UTM values and tagging conventions.
- Pixel failures: Detect broken or missing requests to advertising destinations.
- Privacy issues: Surface possible PII leaks or consent misconfigurations.
The alert should reach the person who can act. Integrate notifications with Slack, email, or Microsoft Teams, then route incidents by product area, destination, or severity. A generic channel full of unranked warnings recreates the manual triage problem in a different interface.
Connect detection to diagnosis
When a deviation appears, automated RCA should traverse the lineage graph, compare related telemetry, rank possible causes, and show the affected downstream paths. The output should include the event or property involved, the suspected originating component, the evidence supporting the hypothesis, and the remediation options.
Trackingplan can be used as one implementation option for this pattern. Its platform discovers martech implementations, monitors analytics and marketing signals, alerts teams about anomalies and validation problems, and connects detected issues with automated root cause analysis across tools such as Google Analytics, Adobe Analytics, Segment, Snowplow, and major ad platforms.
Benchmark Accuracy Versus Production Reality
A benchmark score answers a narrow question. It tells you how a method performed on a defined collection of cases under particular evaluation rules. It doesn't automatically tell you how the same method behaves when telemetry is incomplete, event names drift, several releases overlap, or multiple causes produce similar symptoms.
That distinction is visible in fine-grained RCA research. The peer-reviewed Nezha study reported 89.77% average top-1 accuracy at the code-region and resource-type level across two benchmarks, using unified event representations and fault-free versus faulted pattern comparison. The result is technically meaningful, but a controlled benchmark still differs from a live analytics stack with noisy requests, fragmented observability, consent variation, and changing campaign logic. See the Nezha research paper and publication details for the method's context.
Ask for production evidence
A vendor demonstration can show a clean diagnosis. Your evaluation should test messy incidents from your own environment, including partial failures and ambiguous signals.
Ask these questions before buying:
- Production accuracy: How often does the system identify the correct originating component in actual incidents?
- Evidence quality: Can the tool show the events, properties, requests, and lineage links behind its recommendation?
- Incomplete telemetry: What happens when one destination, log source, or trace is unavailable?
- Stack similarity: Can the vendor demonstrate results on a stack with comparable tags, destinations, warehouses, and consent controls?
- Human correction: Can analysts mark a recommendation as correct, incomplete, or wrong?
- Reproducibility: Does the same evidence produce a stable explanation when the incident is reviewed later?
A recent discussion of production-grade reliability highlights the central weakness in many RCA evaluations: benchmark capability can diverge from live incident performance when telemetry is noisy and causal paths are unclear. Buyers should therefore request production incident accuracy, not only laboratory scores. The real-time anomaly detection perspective is relevant here because detection quality and diagnosis quality are connected. An RCA engine can't explain an incident it never detects, and a sensitive detector can create triage overload if its findings lack context.
Look for evidence-driven diagnosis
The direction of travel is away from static alerting and toward multi-step diagnosis. In a 2026 observability study, an agentic framework was evaluated across 1,200 production-style troubleshooting tasks, improving task success from 61.8% to 86.7%, cutting user intervention by 3.5×, and reducing effective time-to-resolution by about 42%. The same study reported that adaptive memory reduced token consumption by up to 4.8× and nearly doubled failure-recovery performance, as detailed in the 2026 observability study.
Those results support further testing, not blind trust. A strong evaluation asks whether the system can preserve its reasoning when the data is contradictory, incomplete, or operationally inconvenient.
Real Incident Walkthrough From Detection to Resolution
Consider a mobile checkout issue. Trackingplan detects a 35% drop in purchase events from mobile traffic and associates the anomaly with a validation failure affecting checkout_complete. The detection alone tells the team that the data changed. The value of automated RCA comes from connecting that change to the deployment that introduced it.
The lineage view shows that a recent tag manager release changed the event property from transaction_id to order_id. The event still fires, so a simple event-count monitor might miss the defect. The validation layer catches the property mismatch, while revenue reporting and attribution lose the field needed to associate the purchase with the correct transaction.
What the team sees
The incident view should answer four questions quickly:
- What changed? The tag manager deployment altered the property name.
- Where did it begin? The originating component is the checkout tag configuration.
- What is affected? Mobile purchase events, validation status, attribution logic, and revenue reporting.
- What can we do? Revert the tag change or update the approved schema, after confirming the business impact.
That context changes the remediation decision. Reverting the deployment restores the established contract. Updating the validation rule may be correct only if order_id is an intentional replacement and every downstream consumer has been updated.
The incident response automation guidance from Trackingplan provides relevant context for connecting detection, investigation, and response. Trackingplan's video page says its AI agent helps users stop spending hours digging through warnings and possible root causes by showing the cause quickly and enabling fast action. The page also points to a specific YouTube video snippet from the company's channel, which teams can review alongside the written product material at the Trackingplan YouTube videos page.
Why the tracking plan matters
After remediation, the team should update the tracking plan and preserve the incident evidence. An approved definition for checkout_complete can specify the required transaction property, expected destinations, and validation behavior. Future releases can then be checked against that contract before they create another reporting gap.
Without that control, the same failure can return under a different tag version or campaign configuration. Automated RCA accelerates the diagnosis, but the tracking plan turns the lesson into an enforceable expectation.
Trust and Interpretability in AI-Assisted Diagnosis
An automated recommendation isn't a command to deploy a fix. It is a hypothesis supported by evidence, and the team should be able to inspect that evidence before changing production instrumentation.
Trust requires more than a likely cause. Analysts need to see the affected event, the relevant property, the dependency path, the timing of the anomaly, and the competing explanations the system considered. A confidence level can help prioritize review, but confidence without provenance is only another opaque signal.
Combine deterministic checks with AI reasoning
LLM-only workflows can summarize complex incidents, but they can also produce explanations that sound coherent without being grounded in the actual telemetry. That risk makes deterministic validation rules important. Schema contracts, required properties, destination expectations, consent rules, and lineage relationships provide fixed reference points that an AI system can reason over without inventing missing evidence.
Research on interpretability and evaluation standards identifies two unresolved problems: teams lack consistent ways to validate whether generated propagation graphs are correct, and LLM-assisted RCA can introduce hallucination risk. The research on explainable and trustworthy AI-assisted RCA supports a cautious adoption model based on proof, confidence, and human review.
Fine-grained localization offers another trust signal. Nezha converts heterogeneous data into a unified event representation and compares fault-free with faulted patterns, reaching code-region or resource-type localization rather than stopping at a broad service label. That level of specificity is more actionable because it points an engineer toward a configuration, transformation, or resource class instead of merely naming the system where the symptom appeared.
A useful standard: Never approve an automated remediation unless a human can explain which evidence supports the diagnosis and what evidence would disprove it.
Teams should also record corrections. If analysts reject a recommendation, they should capture the actual cause and the missing signal. Those corrections improve evaluation, expose blind spots, and help distinguish a model problem from an observability problem.
Measuring RCA Effectiveness and Continuous Improvement
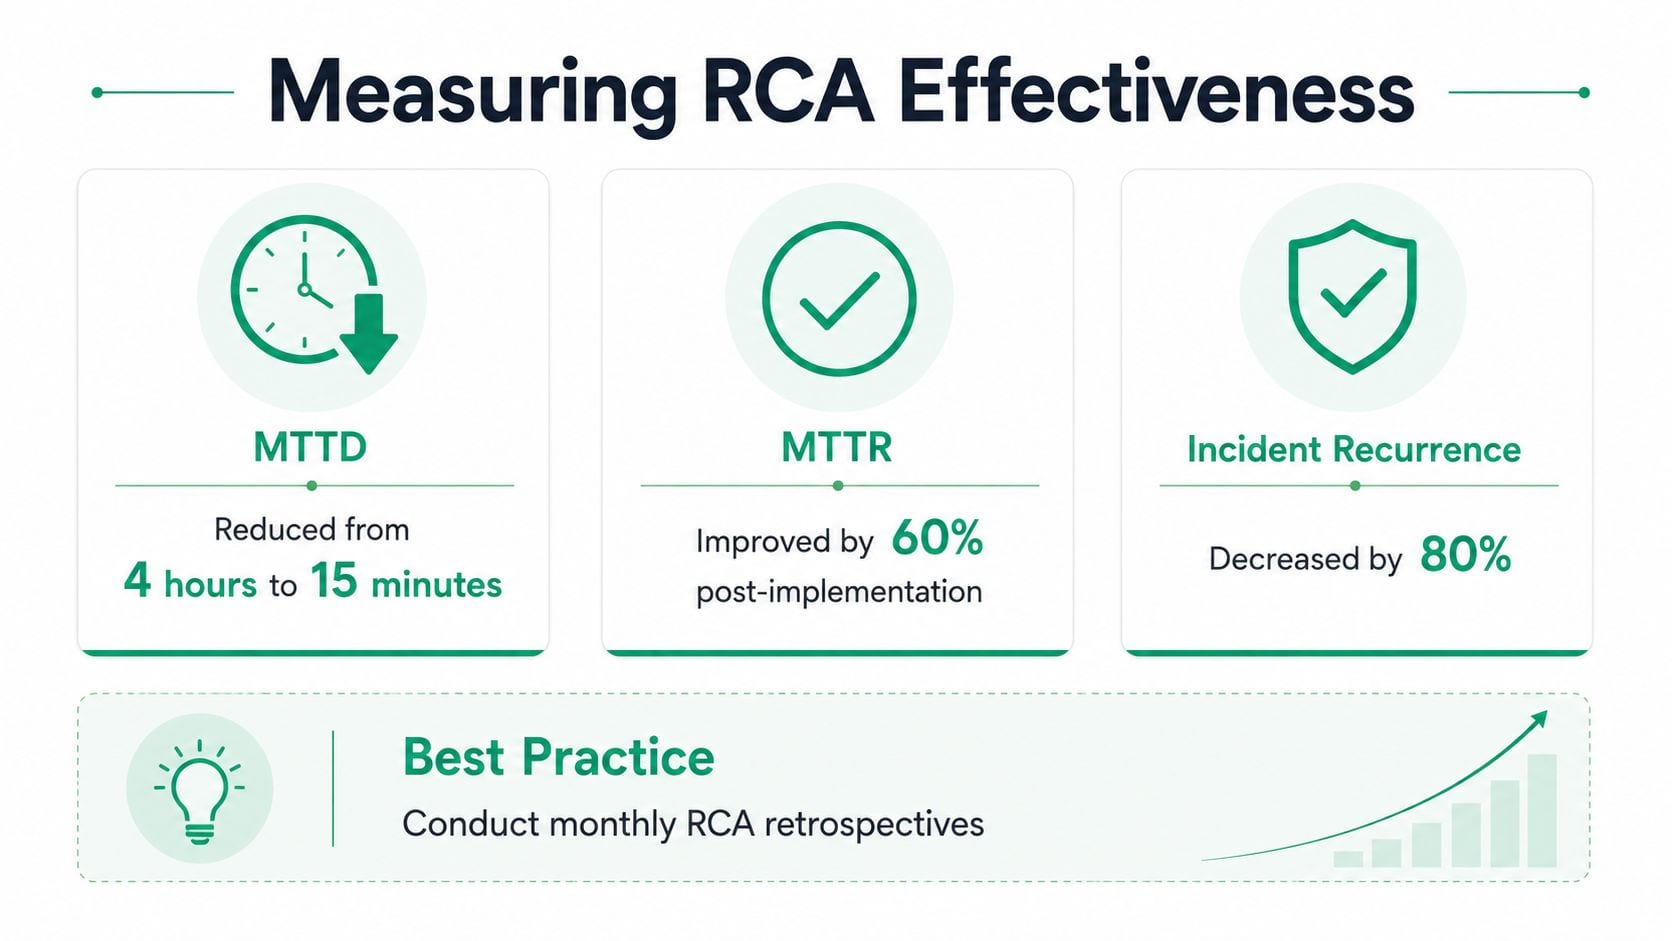
Measure RCA as an operational capability, not as a feature checklist. The first question is whether the team detects incidents earlier. The next is whether it identifies the correct cause, resolves the issue efficiently, and prevents recurrence.
Track the following metrics over a consistent reporting period:
- Mean time to detection: How long the issue exists before the monitoring system identifies it.
- Mean time to resolution: How long the team takes to restore trustworthy data or complete remediation. The mean time to resolution guidance from Trackingplan provides useful context for interpreting this measure.
- Root-cause coverage: The share of incidents for which the team confirms an originating cause.
- False-positive rate: How often alerts lead to no actionable issue.
- Recurrence rate: How often a similar failure returns after remediation.
- Human correction rate: How often analysts revise or reject the automated diagnosis.
Build the improvement loop
Establish a baseline before changing the workflow. Record how analysts currently detect, investigate, document, and resolve analytics incidents. Then compare automated results with human-confirmed outcomes, rather than treating every generated explanation as correct.
Maintain a detailed tracking plan as the implementation evolves. New events, properties, destinations, consent states, and campaign conventions should enter the plan with owners and validation rules. Review low-severity alerts as well as urgent failures because repeated small anomalies often reveal a systemic implementation defect.
Post-incident reviews still matter when RCA is fast. Ask what signal detected the issue, which evidence identified the cause, what remained uncertain, and whether the remediation changed the underlying control. Teams responsible for operational health can also benefit from broader process guidance, such as this data-driven retention playbook, when they're designing feedback loops that preserve knowledge across changing teams.
The strongest operating model treats automation as an analyst's force multiplier. Machines monitor continuously, correlate evidence, and surface likely causes. Humans validate business meaning, approve risky changes, and convert each incident into a stronger contract for the next release.
Trackingplan helps analytics teams discover martech implementations, monitor events and properties, detect anomalies, and trace failures through their data lineage with automated root cause analysis. Visit Trackingplan to evaluate your current incident workflow and see how its observability and analytics QA capabilities can support faster, evidence-based debugging.