Learn how real time anomaly detection works, from algorithms to streaming architectures. A practical guide for analysts to find and fix data issues fast.
Your campaign launched cleanly. Paid traffic is flowing, the dashboard is updating, and the daily numbers look close enough to normal that nobody panics.
Then someone notices a week later that a key event property changed format during a release. Conversions still fired, but attribution logic broke downstream. Retargeting audiences were built on flawed inputs. Channel comparisons became noisy. The analytics team now has two jobs at once: figure out what happened and explain which reports can no longer be trusted.
That's the operational gap real-time anomaly detection closes.
For digital analysts, this isn't an abstract machine learning topic. It's an early warning system for data quality. It watches events, properties, schemas, and traffic patterns as they arrive, so teams can catch problems while a campaign is still running, not after budgets, dashboards, and stakeholder confidence have already taken a hit.
When Good Data Goes Bad Unexpectedly
Most analytics failures don't look dramatic at first.
A tagging update goes live and one parameter starts sending the wrong value type. A mobile release suppresses a checkout event on one screen. A media team launches new campaign links with inconsistent UTM naming. None of these always causes an obvious outage. Your reports still load. Sessions still appear. Revenue may still show up somewhere. That's what makes the issue dangerous.
The problem with delayed visibility
Digital teams usually spot these issues through downstream symptoms:
- A dashboard looks off and an analyst starts investigating
- A stakeholder asks a question the team can't answer confidently
- A campaign underperforms on paper because attribution inputs became unreliable
- A QA review catches drift late after the implementation has already been live
By the time someone notices, the bad data has already spread into reporting, audience creation, optimization decisions, and internal trust.
Practical rule: If a team discovers tracking problems from a weekly report, the detection happened too late for operational analytics.
That's why batch-style review keeps failing modern marketing stacks. Analysts don't work with static datasets anymore. They work with event streams coming from websites, apps, server-side pipelines, consent layers, CDPs, ad platforms, and warehouses. Problems can start with one release and surface everywhere else within hours.
What teams actually need
A useful monitoring layer doesn't wait for a person to remember a dashboard check. It evaluates incoming behavior continuously and asks simple but powerful questions:
- Did volume drop where it normally doesn't?
- Did a new event appear that nobody defined?
- Did a required property disappear?
- Did a familiar event start carrying unfamiliar values?
- Did a campaign traffic pattern suddenly behave unlike its recent baseline?
Those are anomaly questions. They're not only about traffic spikes or fraud. In digital analytics, they're often about data quality drift.
When teams adopt real-time anomaly detection, they stop treating broken tracking as an occasional cleanup exercise. They start treating it as an operational reliability problem, similar to uptime, performance, or failed deployments.
What Is Real-Time Anomaly Detection
A campaign launches at 9:00 a.m. By 9:07, purchase events start arriving without the revenue property your dashboards and bidding logic depend on. Real-time anomaly detection is the system that notices that change while the campaign is still running, not after analysts find the gap in tomorrow's report.
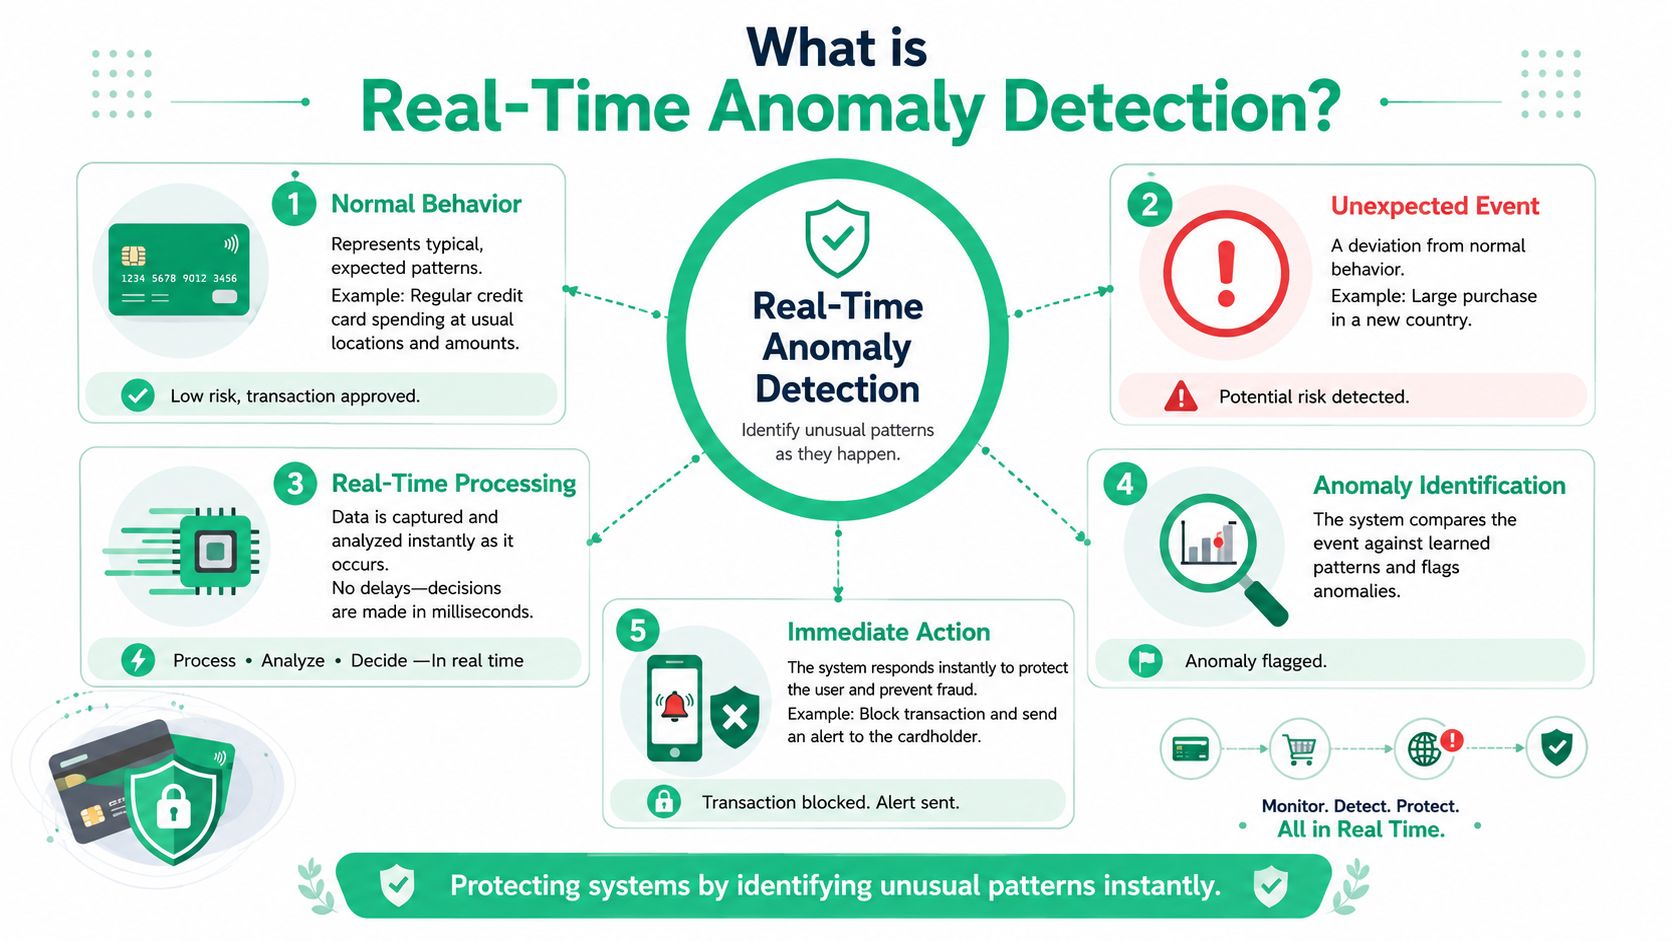
Breaking the term into plain English
Real-time anomaly detection combines three ideas: speed, deviation, and automation.
Real time means the system checks incoming data fast enough for the team to respond while the cause is still visible. In a digital analytics stack, that could mean catching a broken tag, missing parameter, or sudden traffic shift during the same release window, campaign burst, or consent change that caused it.
Anomaly means behavior that departs from an expected pattern in a way that matters operationally. Sometimes that is a sharp drop in event volume. Sometimes it is subtler, like a familiar event arriving with a new property name, an empty value where one is required, or a source-medium mix that no longer matches recent behavior. The key idea is context. An anomaly is not just "different." It is different enough to threaten data quality or trust in reporting.
Detection means software performs this check continuously. Analysts should not have to refresh charts all day to notice that checkout events slowed down or that a destination payload changed shape. The monitoring layer compares fresh data against rules, baselines, or learned patterns and raises a signal when the difference crosses a threshold.
What this means in day-to-day analytics work
For digital analysts, this is less about abstract data science and more about operational control.
A useful way to picture it is an assembly line quality check. Events keep moving through the line from site or app to tag manager, analytics tools, ad platforms, CDP, and warehouse. Real-time anomaly detection inspects the flow while it is in motion. If one part starts arriving damaged, mislabeled, or in the wrong quantity, the team gets a warning before the defect spreads through attribution reports, audiences, and optimization logic.
That is why anomaly detection sits so close to data observability for analytics teams. Both focus on whether the data pipeline is behaving as expected. Observability gives teams visibility into the health of the system. Anomaly detection adds a decision layer that identifies unusual behavior quickly enough to trigger action.
What gets flagged in practice
In a marketing and analytics stack, anomaly detection often watches for patterns like these:
- Volume anomalies, such as pageviews, conversions, or consent events dropping below their recent range
- Schema anomalies, such as a required property disappearing or a new unexpected field appearing
- Value anomalies, such as revenue turning negative, currencies changing format, or campaign parameters arriving empty
- Timing anomalies, such as events arriving late, out of order, or stopping during a period when they normally continue
- Relationship anomalies, such as a spike in sessions without a corresponding rise in pageviews or purchases
If you want a second reference that explains how these patterns are evaluated in time-series data, this practical guide to anomaly detection is a useful companion.
Good real-time anomaly detection protects the reliability of analytics by catching abnormal behavior before it becomes accepted reporting.
Common Anomaly Detection Algorithms Explained
Some detection methods act like strict guards. Others behave more like adaptive investigators. Both can be useful. The right choice depends on how predictable your metric is, how fast you need a result, and how much historical context you have.
Statistical methods for predictable signals
Statistical methods work well when you need speed, clarity, and straightforward behavior.
Two common examples are Z-score and interquartile range (IQR). In streaming operations described by Tinybird, both are used to evaluate whether an incoming point sits too far outside a recent pattern. Z-score checks how far a point deviates from the average relative to standard deviation. IQR looks at the middle spread of recent values and flags points outside that band.
These methods fit many digital analytics checks:
- event volume per minute
- spikes in error events
- drops in checkout completion
- sudden changes in pageview distribution
- property values that drift outside expected bounds
They're especially useful when analysts want alerts they can explain quickly to marketers or developers.
Machine learning methods for changing baselines
When behavior shifts throughout the day, across campaigns, or between weekdays and weekends, static rules often become noisy. That's where adaptive models help.
A key milestone in streaming analytics has been the use of Random Cut Forest, or RCF. OpenObserve describes RCF as an unsupervised algorithm optimized for streaming workloads. In the same production-oriented guidance, the model is typically trained on at least 24 hours of high-quality, gap-free data, and teams often use a 98th-percentile threshold for alerting. The article also gives a concrete trigger example where values above roughly 230,000 events per minute are flagged as anomalies in production-style monitoring, as explained in OpenObserve's Random Cut Forest guide.
That's a useful operational lesson for analytics teams. Adaptive models aren't magic. They need good recent history, and they still require threshold decisions.
Side-by-side trade-offs
| Method | Type | Best For | Pros | Cons |
|---|---|---|---|---|
| Out-of-range checks | Rule-based statistical | Required fields, invalid values, hard business limits | Fast, easy to explain, easy to implement | Rigid when normal behavior changes |
| Timeout windows | Rule-based statistical | Missing events, broken tags, stalled feeds | Great for “something stopped” failures | Doesn't detect subtle drift |
| Rate-of-change rules | Rule-based statistical | Sharp jumps or drops in metrics | Useful for release and traffic incidents | Can overreact to natural bursts |
| IQR | Statistical distribution-based | Metrics with recent local variation | Handles shifting windows better than fixed limits | Still depends on window quality |
| Z-score | Statistical distribution-based | Stable metrics with measurable spread | Simple and efficient for streams | Less useful when data is strongly seasonal |
| Random Cut Forest | Unsupervised machine learning | Streaming time series with evolving baselines | Learns recent normal behavior, supports real-time scoring | Needs clean training data and thoughtful thresholding |
If you want a broader implementation-oriented read that complements this overview, this practical guide to anomaly detection gives a useful timeseries perspective.
For warehouse-centered teams, it also helps to connect these ideas to SQL-first monitoring patterns such as anomaly detection in BigQuery.
Start with the simplest method that reliably catches the problem you care about. Complexity is only helpful when simple rules stop matching reality.
The Streaming Architecture Behind the Magic
A model can spot unusual behavior only if the event reaches it fast enough, with enough context, and in the right shape. That is why real-time anomaly detection is as much a data engineering problem as a statistical one.
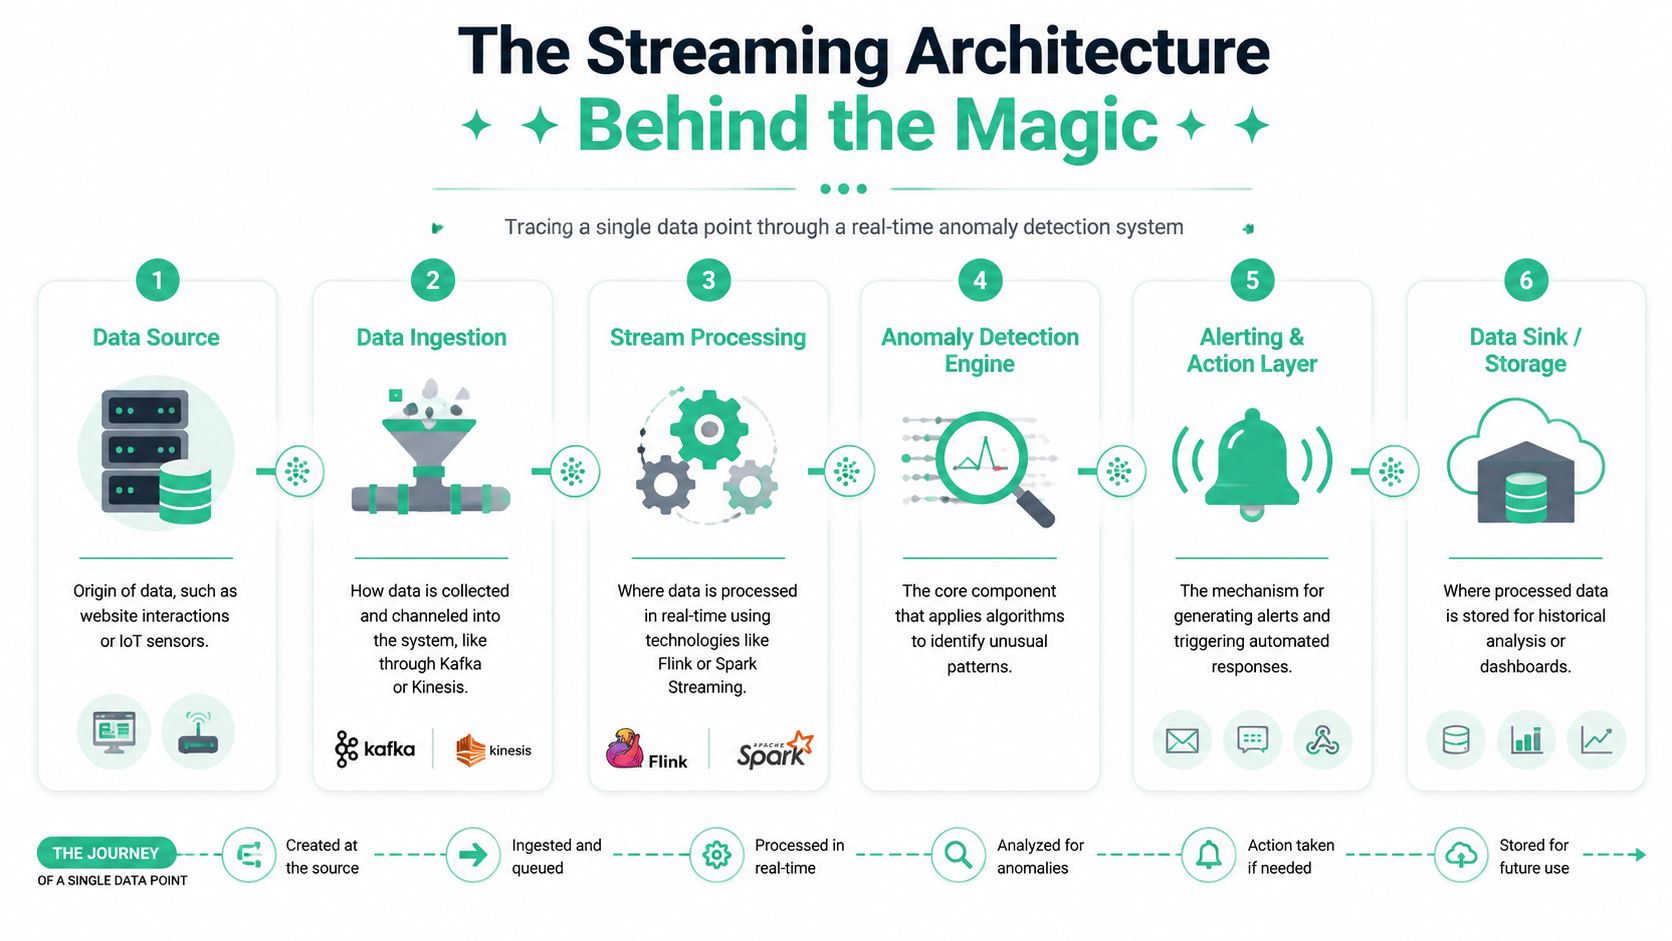
Following one event through the system
Start with a familiar analytics scenario. A shopper clicks Add to Cart on your site, and your team expects that event to appear in GA4, your warehouse, and any downstream marketing tools within seconds.
The event begins at the source layer. That might be the browser, a mobile app, or a server-side endpoint. A collection layer then captures it through a tag, SDK, or API call and places it onto a stream so multiple systems can read it as it arrives, rather than hours later in a batch file.
From there, the processing layer checks the event against what “healthy” looks like. Did the event volume suddenly fall after a release? Did a required property disappear? Did a new field appear that no one approved in the tracking plan? If the answer is yes, the system scores that change and routes an alert to Slack, email, or an incident workflow. In parallel, the same event is usually written to storage so analysts can verify what happened and compare it with historical behavior.
That full path matters. If one step is delayed or inconsistent, the alert arrives after dashboards have already been questioned and decisions have already been made on bad data.
Why streaming changed monitoring
For digital analytics teams, streaming changed the timing of quality control. The question is no longer limited to whether yesterday's totals looked off. The better question is whether the event stream is behaving correctly right now, while the release is still fresh and the campaign is still live.
That shift is what makes anomaly detection operational. Instead of discovering a broken purchase event in a morning report, the team can catch the break close to the moment it starts. In marketing and analytics stacks, that difference is expensive. A few hours of bad collection can distort attribution, audience building, bidding signals, and executive reporting.
Streaming platforms and real-time analytical stores made that workflow practical by letting teams inspect events continuously, keep short rolling baselines, and score changes as data arrives. As noted earlier, this is the architectural change behind modern real-time anomaly detection systems.
The core components in plain language
A practical setup usually includes six parts:
- Data sources where user and system activity originates, such as websites, apps, backend services, and ecommerce platforms
- Collection layer that captures events through tags, SDKs, server-side endpoints, or event APIs
- Streaming backbone that moves events from producers to consumers with low delay and reliable ordering where needed
- Processing engine that applies rules, baselines, and anomaly scoring logic to each incoming event or short time window
- Alerting layer that sends the result to people or systems that can act on it
- Storage layer that keeps the event history for dashboards, audits, replay, and model tuning
The streaming backbone works like a conveyor system in a warehouse. Events keep moving, and different consumers can inspect the same package for different reasons. One service may look for missing parameters. Another may track volume drops by country. A third may archive the raw event for later analysis.
If your team is evaluating the transport layer itself, this overview of Apache Kafka integrations for analytics pipelines is a useful reference point.
The key idea is simple. “Real time” is not a single feature. It is a coordinated flow across collection, transport, processing, alerting, and storage. When those pieces are designed well, anomaly detection helps analysts protect data quality before bad data spreads through the rest of the stack.
Anomaly Detection for Your Analytics and Marketing Stack
For digital analysts, the most useful application of anomaly detection isn't generic outlier scoring. It's continuous QA across the marketing and analytics stack.
![]()
Where anomalies show up in daily analytics work
Anomalies often appear as implementation failures disguised as business changes.
A sudden drop in add_to_cart could mean demand changed. It could also mean a front-end update broke the selector or renamed the event. A spike in page_not_found tied to one campaign may reflect user behavior, but it may also reveal malformed landing URLs or bad UTM construction. A new event appearing in the stream might represent a valid feature rollout, or it might be a rogue implementation bypassing the tracking plan.
For analysts, those distinctions matter because the downstream effects are different. If the problem is real user behavior, you optimize media or product. If the problem is instrumentation, you fix data collection before anyone draws conclusions.
Practical anomaly types in martech operations
A useful monitoring setup should watch for several classes of issues:
- Traffic anomalies such as an unusual drop in a key event after a release
- Schema drift when an event still arrives but properties change shape or type
- Unexpected events that weren't defined in the implementation plan
- Campaign tagging errors where naming conventions or UTMs break segmentation
- Destination failures when a pixel or analytics endpoint stops receiving expected payloads
A tool-focused observability layer can provide help. Platforms like Trackingplan continuously monitor analytics and marketing instrumentation across websites, apps, and server-side stacks, and they alert teams about issues such as missing events, rogue events, schema mismatches, broken pixels, campaign tagging errors, and consent-related misconfigurations.
The operational question isn't “Did data arrive?” It's “Did the right data arrive, in the right shape, at the right place, at the right time?”
Turning alerts into faster investigation
The best anomaly alerts narrow the search space.
An analyst shouldn't receive a vague message that “traffic looks strange.” They should get enough context to ask the next smart question immediately:
- Which event changed?
- Which property or destination was affected?
- When did the shift start?
- Did it begin after a deployment, campaign launch, or consent change?
- Is the problem isolated to one device type, geography, or source?
That context is what makes the difference between a helpful alert and noise.
If your team wants a product walkthrough format instead of documentation, this video gives a more visual look at how monitoring and alerting fit into analytics QA workflows:
Best Practices for Actionable Alerts
Many teams don't fail at detection. They fail at alert design.
An alerting system that fires too often gets ignored. One that fires too late becomes reporting. The goal is a signal that is specific enough to trust and detailed enough to act on.
Tune for action, not for sensitivity alone
Start by mapping alerts to decisions.
If a missing purchase event needs immediate engineering attention, that alert should be urgent. If a low-impact content event drifts slightly from baseline, it may belong in a daily review queue instead. Treating every anomaly as equally important creates alert fatigue fast.

Useful practices include:
- Prioritize business-critical events first, such as revenue, lead, signup, consent, and attribution signals
- Separate hard failures from soft drift so teams know what needs immediate response
- Route alerts by owner because marketers, analysts, and developers won't handle the same issues
- Include investigation context like event name, affected property, first-seen time, and impacted destination
Handle seasonality before it handles you
Many false positives come from normal periodic behavior.
Traffic often behaves differently by hour, weekday, campaign cycle, or release cadence. For data with strong seasonal patterns, newer methods that explicitly decompose the signal into periodic components can significantly cut detection time and reduce maximum detection delay compared with generic detectors, according to the 2024 Scientific Reports study on periodicity-aware anomaly detection.
That finding matters outside server telemetry too. Marketing and product data often has repeating rhythms. If your model ignores those rhythms, it may treat normal Monday surges or weekend dips as incidents.
Build trust with a response workflow
Alerts only work when people know what happens next.
A lightweight operating checklist helps:
- Define an owner for each alert family
- Set response expectations so urgent alerts don't sit in a shared inbox
- Log resolutions to refine thresholds over time
- Review noisy alerts and either improve them or remove them
- Send alerts where work already happens such as Slack, Jira, PagerDuty, or Teams
If your team is comparing delivery options, this overview of analytics alert systems for data teams is a practical starting point.
Trackingplan's YouTube channel also includes walkthrough-style videos that can help teams see how alert configuration fits into a broader analytics QA process.
An alert earns trust when the recipient can answer two questions immediately: “Is this real?” and “What do I check first?”
From Reactive Fixes to Proactive Data Governance
A mature analytics team does more than catch breakages fast. It designs a system that learns from each incident and reduces the chance of seeing the same failure twice.
That is the shift from monitoring to governance.
In practice, real-time anomaly detection becomes a control layer across the marketing and analytics stack. A spike in missing purchase events should not end as a Slack alert that someone acknowledges and forgets. It should feed a better rule, a cleaner schema contract, a stronger release checklist, or an automated safeguard that pauses a risky change before it reaches every downstream tool. The goal is not only to detect bad data earlier. The goal is to make bad data harder to produce.
This matters for digital analysts because data quality problems rarely stay in one place. One broken tag can distort campaign reporting, audience building, bidding signals, experimentation readouts, and executive dashboards within hours. Real-time detection gives teams a chance to contain the issue. Good governance uses that signal to improve the process behind the issue, whether that process lives in GTM, a CDP, a warehouse pipeline, or a destination connector.
The next step for many teams is automated remediation. Low-risk cases can trigger a predefined response, such as opening a Jira ticket, rolling back a tracking change, pausing a downstream sync, or routing events to quarantine for review. Analysts still need visibility and approval paths, but the operating model starts to look less like firefighting and more like quality engineering for data.
Reliable insight starts earlier than the dashboard. It starts with controls around collection, validation, change management, and response. Real-time anomaly detection is the sensor. Proactive governance is the discipline that turns those signals into a more dependable analytics program.
If your team wants a practical way to monitor analytics implementations, campaign tagging, schema drift, missing events, and destination issues without relying on manual audits, Trackingplan is worth evaluating as part of your data quality workflow.