Digital analytics is how you turn raw clicks, taps, and scrolls into a clear story about your users. At its heart, it’s the process of gathering, measuring, and analyzing digital data from your websites and apps to truly understand user behavior and make smarter business decisions.
Think of it as the indispensable guide for your business, turning a sea of anonymous user actions into strategic, actionable direction.
Imagine trying to run a retail store completely blindfolded. You hear the front door chime, but you have no idea who’s coming in, what they're looking at, or why they're leaving empty-handed. Running a business online without digital analytics is exactly like that—a total guessing game.
Digital analytics is the map that lights up this unknown territory. It gives you the tools to see what your customers are doing online, just as a store manager would watch shoppers move through the aisles. Instead of asking vague questions, you can finally get concrete answers to your most pressing business problems:
To really get a handle on it, the entire digital analytics process can be broken down into four fundamental pillars. Each one builds on the last, creating a powerful cycle that transforms raw data into real-world improvements for your business.
This cycle is the engine that drives modern digital strategy. Let's look at each stage.
Following this systematic approach isn't just a good idea—it's becoming essential. The global data analytics market is expected to explode from USD 64.75 billion in 2025 to a staggering USD 785.62 billion by 2035. That number alone shows just how seriously businesses are taking data to get a competitive edge.
To round out your understanding, it’s also helpful to see how digital analytics fits alongside related fields like what is business intelligence analytics, which often takes a wider view of all business data. For a deeper dive into the fundamentals and more advanced topics, our library of guides on digital analytics has you covered.
To really get what digital analytics is all about, you have to speak its language. The analytics world is full of terms that can sound a little intimidating at first, but they all boil down to a handful of core concepts. Once you get a handle on these building blocks, any analytics report will start to click, transforming from a confusing spreadsheet into a clear story about your users.
At the heart of it all is data collection. Think of your analytics tool as a tireless digital note-taker, meticulously recording every meaningful action a user takes on your website or app. This is all made possible by small snippets of code—often called tracking codes or pixels—that observe and report back on user behavior.
This whole process can be broken down into a simple, continuous loop.
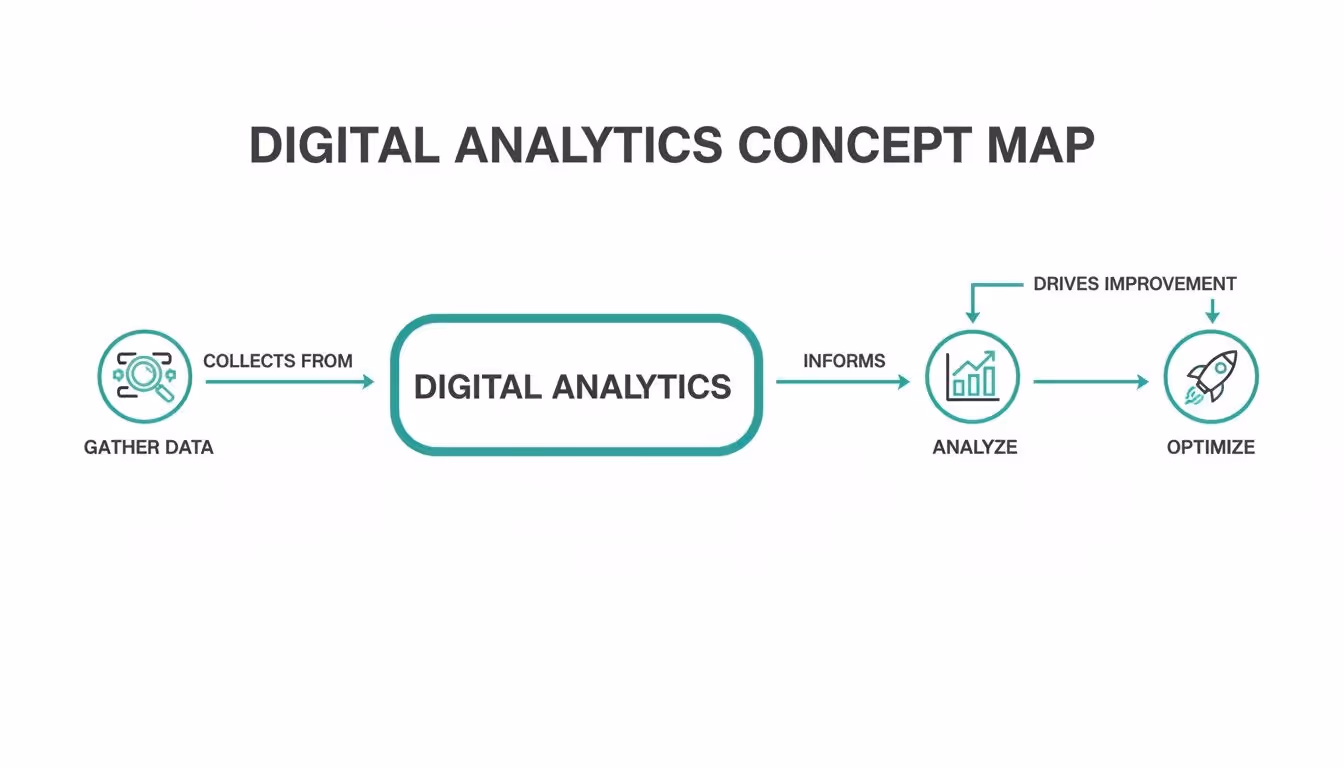
As you can see, you gather data, analyze it to find out what’s actually happening, and then use those insights to optimize the experience. Then you start all over again.
Two of the most common terms you’ll run into are metrics and dimensions. The easiest way to keep them straight is to think of metrics as the what and dimensions as the who, where, or how.
A metric is a number. It's a raw, quantifiable measurement of something happening. For example, "500 visitors" is a metric. Simple.
A dimension, on the other hand, adds context to that number. It describes the data. If you find out those 500 visitors came "from organic search," the phrase "from organic search" is the dimension. It gives the number meaning.
Key Takeaway: Metrics are the numbers in your reports (e.g., sessions, pageviews, conversion rate). Dimensions are the labels you use to slice and dice those numbers (e.g., country, traffic source, device type).
Without dimensions, metrics are just numbers floating in a void. It's the combination of the two that unlocks real, actionable insights.
Modern analytics is built around the idea of events. An event is just a specific action a user takes. Instead of only tracking something broad like page views, event-based analytics lets you zoom in on the granular interactions that actually matter to your business.
Think of each event as a verb in the story of a user's journey.
video_playedadd_to_cartform_submittedlogin_successfulEach one tells you something specific the user did. But events get way more powerful when you add more detail through event properties and user properties.
video_played event, a property could be video_title: "Product Demo" or video_duration: "120 seconds".plan_type: "Premium" or join_date: "2024-05-15".When you put it all together, you get a rich, detailed picture. You don't just know someone played a video; you know a premium user who joined last month played the 120-second product demo. Now that’s useful.
Finally, let's talk about attribution modeling. Imagine your business scores a goal—a customer makes a purchase. Attribution is how you figure out which players on your team deserve credit for that goal.
Was it the striker (a Google Ad) who took the final shot? Or maybe it was the midfielder (a blog post) who made the crucial pass that set everything up?
Different attribution models assign credit in different ways:
Choosing the right model helps you understand which marketing channels are actually moving the needle, allowing you to invest your time and money a lot more wisely. It’s the final building block that connects user actions to real business results.

Okay, the concepts are one thing, but seeing analytics in action is where everything clicks. Data on its own is just a pile of numbers. Its real magic comes from empowering teams to make smarter, faster decisions that actually move the needle on business goals.
Let's step away from the theory and look at a few real-world scenarios. Think of these as mini-stories showing how different teams use analytics to solve nagging problems and turn user behavior into a roadmap for growth.
Picture an e-commerce marketing team watching their customer acquisition cost (CAC) creep up. They were pouring more money into ads, but sales weren't keeping pace. Instead of just guessing or making blind budget cuts, they dove into their analytics platform.
Looking at their attribution data, they found the culprit: a high-budget ad campaign driving tons of clicks but almost zero conversions. The analytics painted a clear picture—users from this ad were hitting the landing page and bouncing almost immediately.
Armed with that knowledge, they paused the failing campaign and shifted that budget to another channel. This other channel had less traffic, but its conversion rate was through the roof. The impact was immediate.
This is a classic example of analytics providing the hard evidence needed to stop wasting money and start investing it wisely. It’s a core function of web analytics, a market that’s set to explode from USD 7.98 billion in 2025 to USD 16.36 billion by 2030, all thanks to the non-stop growth of e-commerce. You can discover more insights about this growing market if you're curious.
A SaaS company’s product team was stumped. Sign-ups were strong, but a huge chunk of new users were dropping off during onboarding and churning within days. Their gut told them the product was just too complex.
But the data told a different story. By building a funnel report in their analytics tool, they could see exactly where users were getting stuck. The report showed a massive, unexpected drop-off at a single step: the prompt to "invite your team." It was an optional step, but its placement was so confusing that users were just giving up and leaving.
Key Insight: The product team learned that a seemingly minor UI decision was having a major negative impact on user activation and long-term retention.
They quickly launched an A/B test. One version had the old flow, and the new one moved the "invite" prompt until after the main setup was done. The results were staggering: the new flow increased onboarding completion by 45%.
Over in the sales department of a B2B company, the team was overwhelmed. They were treating every lead the same, wasting hours on prospects who were just kicking tires. They desperately needed a way to spot the serious buyers.
The solution? They connected their analytics platform to their CRM and built a lead scoring system based on what users were actually doing on the site. Different actions were assigned points, creating a clear signal of intent.
Now, whenever a lead's score hit a certain number—let's say 50 points—the system automatically flagged them as a "hot prospect" and pinged a sales rep. This simple change let the team zero in on people ready to talk, boosting their lead-to-close rate by 25%.
These stories show that digital analytics isn't just for data scientists locked in a back room. It’s a practical tool for marketers, product managers, and salespeople to answer their biggest questions, break down silos, and get everyone focused on what truly works.
Collecting mountains of digital analytics data can feel like a huge win, but it’s only the first step. The real value comes when you can actually trust that data enough to make critical business decisions. Unfortunately, many organizations stumble into common pitfalls that silently corrupt their data, eroding trust and turning expensive analytics platforms into digital ghost towns.
Having data isn’t enough; you need data integrity. The moment teams lose confidence in the numbers, they go right back to guesswork and gut feelings. That completely defeats the purpose of having analytics in the first place.
Let's break down the most common mistakes that can derail your entire analytics strategy before it even gets off the ground. These issues range from simple human error to complex technical breakdowns, but they all lead to the same ugly outcome: unreliable insights and wasted potential.
One of the most frequent—and damaging—issues is the lack of a standardized naming convention. Just imagine one team tracks a button click as CTA_Click, another calls it buttonClick, and a third logs it as Clicked-Get-Started-Button. When you try to build a report on how many users clicked that one button, the task becomes nearly impossible.
This seemingly small oversight creates immense "data chaos." Reports become fragmented and confusing, forcing analysts to spend hours just trying to piece together related events instead of actually uncovering valuable insights.
Key Takeaway: A consistent naming convention acts as a universal language for your data. Without it, your analytics becomes a collection of disconnected whispers instead of a clear, unified story about your user journey.
This inconsistency makes it incredibly difficult to perform accurate analysis, compare performance over time, or have any real confidence in the conclusions you draw from the data.
Another classic pitfall is when website or app updates silently break existing analytics tracking. A developer might change a button's ID or refactor a section of code, completely unaware that those changes are tied to crucial analytics events. Suddenly, your "Purchase Complete" event stops firing, and you're left with a massive, gaping hole in your revenue data.
These breaks often go unnoticed for weeks, sometimes even months, leading to incomplete datasets and seriously flawed conclusions. By the time someone realizes data is missing, it's often too late to recover what was lost. This forces teams to make decisions based on an incomplete picture of reality. This is one of the most common issues, and you can learn more about how to spot the 7 signs your analytics is broken and how to fix it in our detailed guide.
Perhaps the most seductive pitfall of all is the focus on vanity metrics. These are the numbers that look impressive on the surface but have little to no real connection to business outcomes. Think total page views, social media likes, or the number of app downloads.
Sure, these numbers can feel good to report in a meeting, but they don't tell you if your business is actually growing or if users are finding value. A million page views mean nothing if none of those visitors ever convert into paying customers. Focusing on these metrics can lead your team down the wrong path, optimizing for numbers that don't actually contribute to the bottom line.
True success in digital analytics comes from focusing on actionable metrics that are directly tied to your business goals. These include:
Making the switch from vanity to actionable metrics is essential. It ensures your efforts are concentrated on activities that genuinely drive sustainable growth and improve the user experience, making your analytics strategy a true asset rather than a source of misleading confidence.
After seeing how easily data can go off the rails, it’s obvious that a reactive approach to digital analytics is a recipe for disaster. Just having data isn't enough; you need data you can actually trust to make decisions. The solution is to shift from fixing broken reports after the fact to proactively guaranteeing data quality from the very start. This is the whole idea behind analytics observability.
Think of analytics observability as an automated security system for your data pipeline. Instead of you manually digging through reports to find weird numbers, it constantly watches the flow of data from your site and apps into your analytics tools, flagging problems the second they pop up.
This proactive approach turns analytics from a messy, unreliable chore into a trustworthy engine for making smart calls. It gives your teams the confidence they need to stop second-guessing the numbers and start using them to drive growth.
Modern observability platforms don't just sit around waiting for problems to surface in your dashboards. They get to work by automatically scanning your digital properties to build a complete, living map of your entire analytics setup. This map includes every single event, property, and user trait you're supposed to be tracking.
Once that baseline is locked in, the system acts like a vigilant watchdog, constantly on the lookout for any deviations or errors.
add_to_cart event, you’ll get an alert in minutes, not weeks.price property is mistakenly sent as text instead of a number—before that bad data ever pollutes your reports.This continuous validation is the key to building and maintaining trust in your digital analytics. It systematically eliminates the "garbage in, garbage out" problem that plagues so many organizations.
Of course, to truly trust your analytics, implementing robust data cleaning best practices is also non-negotiable, as it perfectly complements this automated verification.
When you adopt an observability strategy, you fundamentally change how your entire organization deals with data. That endless, frustrating cycle of discovering data gaps, scrambling to find the cause, and trying to clean up months of corrupted historical reports finally comes to an end.
This shift brings huge benefits. Instead of constant firefighting, your teams can focus on strategic projects, moving forward with full confidence in the numbers that guide them. This is more important than ever.
The advanced analytics market, valued at USD 94.63 billion in 2025, is projected to reach an incredible USD 305.42 billion by 2030. This growth is all fueled by the demand for reliable, data-driven decisions.
For a deeper dive into how this all works in practice, you can learn how to bulletproof your digital analytics with data validation. In today's world, this kind of proactive quality assurance isn't a luxury—it's a must-have for any business that wants to make smart, data-informed moves.
Alright, you’ve made it. You now have a solid grasp of what digital analytics is, why it's so important, and how to make sure the data you're collecting is actually reliable. The path from raw clicks to confident, data-backed decisions should be looking a lot clearer now.
So, what's next? It's time to put that knowledge into practice. The key is to start small and build momentum. Don't try to boil the ocean by tackling everything at once. Focus on manageable steps that deliver real value right away.
Before you start digging through reports, take a quick inventory of what you’ve already got. This isn't a massive, multi-week project. Just set aside an hour to answer a few basic questions and get a baseline.
This quick check-up will show you what’s working, what's missing, and where your biggest opportunities are hiding.
Key Takeaway: A simple audit turns the vague idea of "improving analytics" into a concrete to-do list. It gives you a clear path forward.
Start by asking these simple questions:
The best analysis always starts with a great question. Instead of getting lost in a sea of dashboards, pick one critical business question you want to answer this week. This laser focus keeps your analysis purposeful and stops you from chasing vanity metrics.
Your question needs to be specific and tied to a business goal. For instance:
Once you have your question, jump into your analytics tool and hunt down the answer. Nailing that first insight is a powerful win.
Getting good at digital analytics is an ongoing process, not a one-and-done task. As you get more comfortable, you'll naturally want to go deeper. Luckily, there are tons of fantastic, beginner-friendly resources out there to help you along.
Here are a few of the best places to keep learning:
By taking these small, actionable steps, you'll be well on your way to making smarter decisions and driving real growth for your business.
As you dive into digital analytics, you're bound to have some questions. It's a field that can feel massive at first, but the core ideas are actually pretty simple. We've put together answers to some of the most common questions we hear to give you a solid starting point.
Think of this as your quick-start guide. It’s designed to clear up the concepts that trip up beginners and even pop up for seasoned pros. Let's get into it.
At its heart, the goal of digital analytics is to turn all that raw data from your website and apps into clear, actionable insights. It’s about finding the story hidden inside the numbers—who your users are, how they found you in the first place, and what they actually do once they arrive.
Ultimately, these insights give you the power to make smart decisions that improve the user experience, sharpen your marketing campaigns, and drive real business growth. It connects the dots between what users do and what the business needs to achieve.
The easiest way to think about it is that digital analytics is a specialist, while Business Intelligence (BI) is a generalist. Digital analytics zooms in on user behavior specifically within your digital channels—your website, app, and social media platforms.
Business Intelligence (BI), on the other hand, takes a much wider lens. It pulls together data from all corners of the company, including sales, finance, and operations, to give you a report on the overall health of the business. For example, digital analytics might tell you why users are abandoning their shopping carts, while BI will tell you how that cart abandonment is hitting your quarterly revenue.
Getting started doesn't have to be a huge, complicated project. The best way to approach it is to work backward from your business objectives.
Start small by keeping an eye on just a handful of core metrics. As you get more comfortable, you can start expanding what you track and analyze.
Absolutely. You definitely don’t need a Ph.D. in statistics to get real value out of digital analytics. Today's platforms are built for marketers, product managers, and business owners—not just data scientists. They rely on intuitive dashboards and visual reports to make the important stuff easy to understand.
The single most important skill you can have is curiosity. It all comes down to asking good questions about your business and then using the data to hunt down the answers. You don't need to understand complex algorithms to see where your traffic is coming from or which pages people love the most.
Of course, all of this hinges on one critical thing: accurate data. At Trackingplan, we provide a fully automated observability platform that makes sure your analytics data is always complete and trustworthy. It gives you the confidence to make the decisions that will actually drive growth. Learn how Trackingplan can help you build a reliable analytics foundation.
