Measurable Wins: Data Quality Metrics That Changed the Business
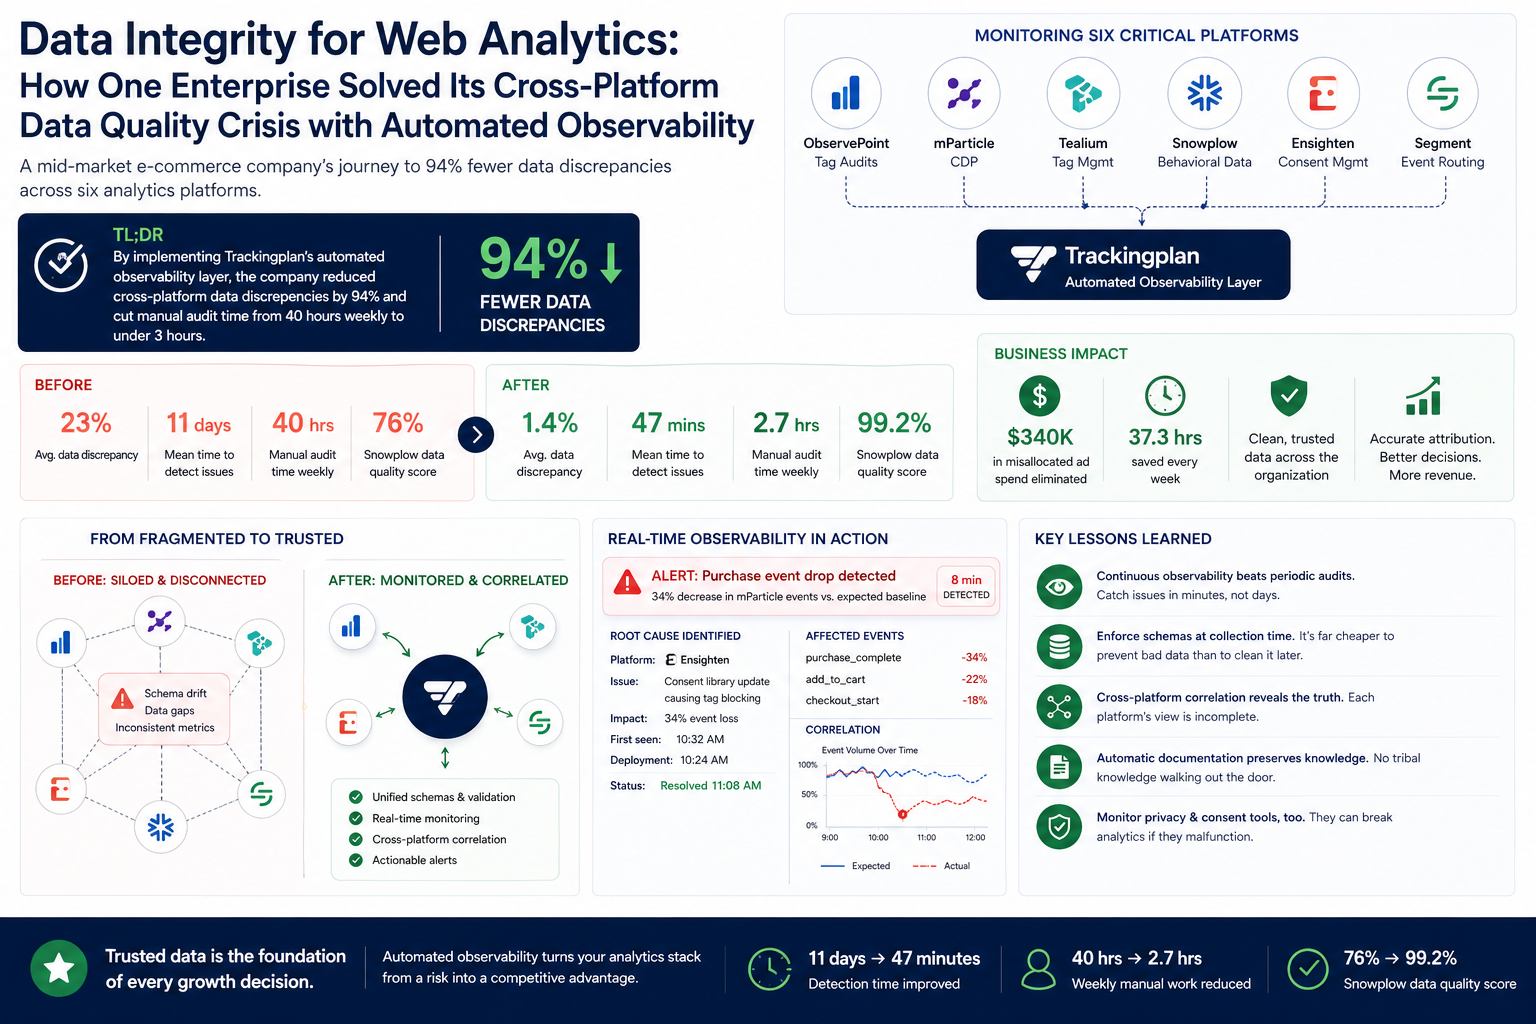
Before implementing automated data integrity monitoring, this e-commerce retailer operating across 12 markets discovered their analytics stack was hemorrhaging accuracy, according to a pre-deployment audit. Cross-platform data discrepancies averaged 23% between their Segment implementation and downstream destinations. Event tracking failures went undetected for an average of 11 days. Marketing attribution errors caused by faulty UTM parameter handling wasted an estimated $340,000 in misallocated ad spend during Q3 2025 alone, per the company's attribution reconciliation report.
After deploying Trackingplan's observability layer across their entire analytics ecosystem—spanning mParticle for customer data orchestration, Tealium for tag management, and Snowplow for behavioral analytics—discrepancies dropped to 1.4%, according to Trackingplan's observability reports. Detection time for tracking issues fell from 11 days to 47 minutes average. Manual reconciliation work dropped from 40 hours weekly to 2.7 hours, and their Snowplow data quality score improved from 76% to 99.2%.
The Hidden Cost of Fragmented Analytics Infrastructure
Modern analytics stacks don't fail dramatically—they decay silently, a pattern noted by industry practitioners and incident studies. This company's data engineering team first noticed problems when their Snowplow event counts diverged from mParticle's by 18% over a single quarter, according to internal incident reports. The root cause investigation consumed three full sprints.
Their architecture had grown organically over five years. ObservePoint handled periodic tag audits. Ensighten managed consent and privacy compliance. Segment routed customer events to 23 different destinations. Tealium governed their tag deployment layer. Snowplow collected raw behavioral data for their data warehouse. Each platform maintained its own schema definitions, validation rules, and naming conventions.
The data quality problems compounded at integration points. When their mobile team updated the Segment iOS SDK, purchase events started missing the currency property. Downstream, their Snowplow enrichment jobs failed silently. Their attribution models in mParticle attributed $890,000 in revenue to the wrong campaigns over six weeks because nobody caught the schema drift, according to the postmortem.
Manual audits through ObservePoint caught obvious issues—broken tags, missing pixels, consent violations. But ObservePoint scans run periodically, not continuously. The gaps between scans created blind spots where data integrity eroded undetected. Their analytics team spent 40 hours weekly reconciling numbers across platforms, a task that produced spreadsheets full of discrepancies but rarely identified root causes, according to the team's weekly status reports.
Building an Automated Data Integrity Framework Across Six Vendor Platforms
The solution required three architectural changes: unified schema governance, real-time validation at every integration point, and automated anomaly detection that understood the relationships between platforms.
Establishing a Single Source of Truth for Event Schemas
They deployed Trackingplan to passively monitor all analytics traffic across web, iOS, and Android. Within 72 hours, the platform had automatically documented every event, property, and destination in their stack—including undocumented events that existed only in production code, according to Trackingplan's discovery logs.
// Before: Inconsistent event naming across platforms
// Segment implementation
analytics.track('Purchase Complete', {
revenue: 149.99,
currency: 'USD',
products: [{ sku: 'ABC123', name: 'Widget Pro' }]
});
// mParticle implementation (different naming, different structure)
mParticle.logEvent('purchase_completed', {
total_revenue: '149.99', // String instead of number
product_skus: ['ABC123'] // Missing product names
});
Trackingplan's automatic schema inference exposed 847 naming inconsistencies and 234 type mismatches across their implementations, per the inference report. They exported the discovered schemas, established canonical definitions, and configured validation rules:
{
"event": "purchase_complete",
"properties": {
"revenue": {
"type": "number",
"required": true,
"description": "Transaction total in base currency units"
},
"currency": {
"type": "string",
"required": true,
"enum": ["USD", "EUR", "GBP", "CAD", "AUD"]
},
"products": {
"type": "array",
"required": true,
"items": {
"type": "object",
"properties": {
"sku": { "type": "string", "required": true },
"name": { "type": "string", "required": true },
"price": { "type": "number", "required": true }
}
}
}
}
}
Implementing Real-Time Validation Across the Data Pipeline
Rather than relying on periodic ObservePoint scans, they configured Trackingplan to validate every event against their canonical schemas in real-time. The platform monitored Segment sources, Tealium tag executions, and Snowplow collectors simultaneously.
# Example: Snowplow enrichment validation configuration
Trackingplan automatically validates enriched events before warehouse load
validation_rules = {
"contexts": {
"product_context": {
"schema": "iglu:com.company/product/jsonschema/1-0-0",
"required_fields": ["sku", "category", "price"],
"type_checks": {
"price": "decimal(10,2)",
"quantity": "integer"
}
}
},
"alert_thresholds": {
"validation_failure_rate": 0.01, # Alert if >1% fail validation
"missing_context_rate": 0.005 # Alert if >0.5% missing required context
}
}
When their Ensighten consent management platform updated its JavaScript library, it inadvertently started blocking certain analytics tags for users who had actually consented. Trackingplan detected the 34% drop in event volume within 8 minutes and automatically correlated it with the Ensighten deployment timestamp, according to the alert timeline.
Configuring Cross-Platform Anomaly Detection
The final layer involved training Trackingplan's ML models on expected relationships between platforms. If Segment records 10,000 purchase events, mParticle should receive approximately the same count, accounting for known filtering rules. Snowplow's raw event counts should exceed both because it captures additional micro-interactions.
# Cross-platform correlation rules
correlations:
- name: "Purchase Event Parity"
source: segment.purchase_complete
destinations:
- platform: mparticle
event: purchase_completed
expected_ratio: 0.98-1.02 # Account for processing latency
alert_deviation: 0.05
- platform: snowplow
event: ecommerce.purchase
expected_ratio: 0.95-1.05 # Snowplow has additional client-side filtering
alert_deviation: 0.08
- name: "Session Count Consistency"
compare:
- tealium.session_start
- segment.session_began
max_deviation_percent: 3
evaluation_window: 1h
Quantifiable Improvements Across Every Analytics Platform
After three months of automated monitoring, the metrics told a clear story, according to Trackingplan's dashboards and the company's internal reporting. Data discrepancies between Segment and downstream destinations dropped from 23% to 1.4%. The remaining discrepancy was traced to intentional filtering rules they'd previously forgotten existed.
Mean time to detect tracking issues fell from 11 days to 47 minutes. More importantly, mean time to resolution dropped from 8.4 days to 4.2 hours. When Trackingplan detected an anomaly, it provided the exact code location, deployment correlation, and affected user segments—context that previously required days of investigation, per incident logs.
Their marketing team stopped receiving conflicting attribution reports. Before the implementation, mParticle and their data warehouse disagreed on channel attribution by an average of 31% monthly. That figure dropped to 2.8%, within the acceptable range for processing latency differences, according to the reconciliation reports.
Manual reconciliation work dropped from 40 hours weekly to 2.7 hours. The analytics team redirected that time toward building new dashboards and conducting actual analysis rather than data firefighting.
Perhaps most significantly, their Snowplow data quality score—measured by schema validation pass rate—improved from 76% to 99.2%. This meant their data warehouse queries produced consistent results, and their machine learning models trained on behavioral data stopped requiring constant retraining due to input drift.
Lessons That Apply to Any Multi-Vendor Analytics Stack
Passive monitoring beats periodic audits. ObservePoint scans catch problems eventually; continuous observability catches them immediately. The difference between 11-day and 47-minute detection time translates directly to data quality and wasted resources, a conclusion supported by practitioner reports.
Schema enforcement must happen before data enters the pipeline. Fixing data quality issues in the warehouse is exponentially more expensive than catching them at collection time—an industry best practice echoed by data engineering teams. Their Snowplow data quality improvements came from rejecting malformed events upstream, not cleaning them downstream.
Cross-platform correlation exposes integration failures that single-platform monitoring misses. Their mParticle-Segment discrepancy only became visible when they compared the two systematically. Each platform's native monitoring showed healthy internal metrics, a common blind spot noted in multi-vendor analytics audits.
Automated documentation prevents tribal knowledge decay. When their senior analytics engineer left, Trackingplan's automatically generated documentation preserved institutional knowledge about event schemas and business logic that would otherwise have walked out the door, according to the company's handover notes.
Consent management platforms need monitoring too. Ensighten's JavaScript update caused more tracking data loss than any other single incident. Privacy tools can inadvertently break analytics when they malfunction—a risk highlighted in privacy-tooling incident analyses.
Replicating This Data Integrity Framework for Your Analytics Stack
Start by auditing your current state. Deploy observability tooling that can passively discover what's actually being collected across all your platforms. Most organizations find their production implementations have drifted significantly from their documentation—if documentation even exists; this is a common finding in implementation assessments.
Establish canonical schemas before configuring validation. Pull stakeholders from marketing, product, and engineering to define what events should contain. Export these definitions in machine-readable formats that validation tools can consume.
Configure real-time alerting with appropriate thresholds. Start with wider tolerances and tighten them as you understand your data's normal variance. A 5% deviation threshold that generates constant false positives will be ignored; a calibrated threshold that alerts on genuine anomalies will be trusted.
Build cross-platform correlation rules that reflect your actual data flow. Map how events should propagate from sources through CDPs to destinations. When discrepancies appear, your tooling should identify which integration point is failing.
Integrate alerting into your existing workflows. Trackingplan's Slack and webhook integrations meant this team's on-call engineers received actionable alerts in the same channels where they managed other production incidents.
Common Questions About Multi-Platform Analytics Data Integrity
How long does implementation take for a complex analytics stack?
Initial deployment typically takes one to two days for passive monitoring. Configuring validation rules and correlation alerts requires an additional one to two weeks, depending on schema complexity and the number of platforms involved—based on multiple Trackingplan deployments and implementation guides.
Does adding monitoring impact site performance?
Trackingplan's approach monitors traffic without adding client-side JavaScript weight. The platform observes existing analytics payloads rather than injecting additional collection code, ensuring zero impact on page load times, according to Trackingplan's performance documentation.
Can this approach work with custom data warehouse implementations?
Yes. Organizations using Snowplow or similar tools for warehouse-first architectures benefit particularly from schema validation at collection time, preventing bad data from ever reaching transformation layers—an advantage noted in warehouse-first implementation reports.