
Monday morning starts with a familiar question: why did conversions drop overnight? The marketing dashboard shows a sharp decline, but nobody knows whether customers changed their behavior or a tracking event stopped firing. The CMO wants an answer, the analyst is checking filters, and the engineer is searching deployment logs.
The hidden issue often sits between the website, analytics tools, warehouse, and dashboard. That system is the data pipeline, and it determines whether raw activity becomes trusted information or spreads errors through every downstream report. Understanding what is a data pipeline means looking beyond data movement. Modern pipelines also enforce quality, preserve meaning, control latency, and reveal failures before they reach decision-makers.
When Your Dashboard Lies to You
A marketer launches a campaign and expects purchase events to appear in the reporting dashboard. The landing page works, traffic arrives, and the ad platform records clicks. Yet the dashboard shows fewer conversions than expected, while the CRM tells a different story.
The analytics tool may be working exactly as designed. If the event was renamed, a required property disappeared, consent logic blocked the request, or a connector stopped delivering records, the dashboard can only calculate from what it receives. A pipeline that transports data without validating it can turn a small implementation change into a misleading business narrative.

The invisible chain behind a metric
A conversion number usually depends on several connected steps:
- Collection: A website or app captures an interaction such as
purchase,signup, oradd_to_cart. - Ingestion: A tracking layer, API, event stream, or connector receives the record.
- Storage: Raw data lands in a warehouse or lake.
- Transformation: Models clean, join, deduplicate, and interpret the records.
- Delivery: Dashboards, CRM systems, and advertising platforms receive usable outputs.
A failure at any point can produce stale, incomplete, or inconsistent results. The problem becomes harder when each team owns only one part of the chain. Marketing manages campaign tags, product owns the interface, engineering controls releases, analytics defines metrics, and data teams operate warehouse models. Without shared ownership, everyone may assume another team is checking the full journey.
Practical rule: A dashboard number is only as trustworthy as the least observable step that produces it.
A data pipeline doesn't merely move rows from one database to another. It should identify whether the incoming data matches the expected structure, whether records arrive on time, and whether the final output still represents the business definition behind the metric. The rest of the architecture follows from that idea: move data reliably, test it continuously, and make responsibility visible when something breaks.
The Anatomy of a Modern Data Pipeline
A useful analogy is a municipal water system. Sources are reservoirs where raw material enters, the pipeline is the treatment plant and network of pipes, and destinations are faucets where people consume the finished product. Water that reaches a faucet isn't useful merely because it traveled. It must also be filtered, measured, routed, and protected from contamination.
Data works the same way. Websites, databases, mobile apps, ad platforms, CRMs, and event tools produce the raw input. Warehouses, dashboards, reports, machine learning models, and operational platforms consume the output.
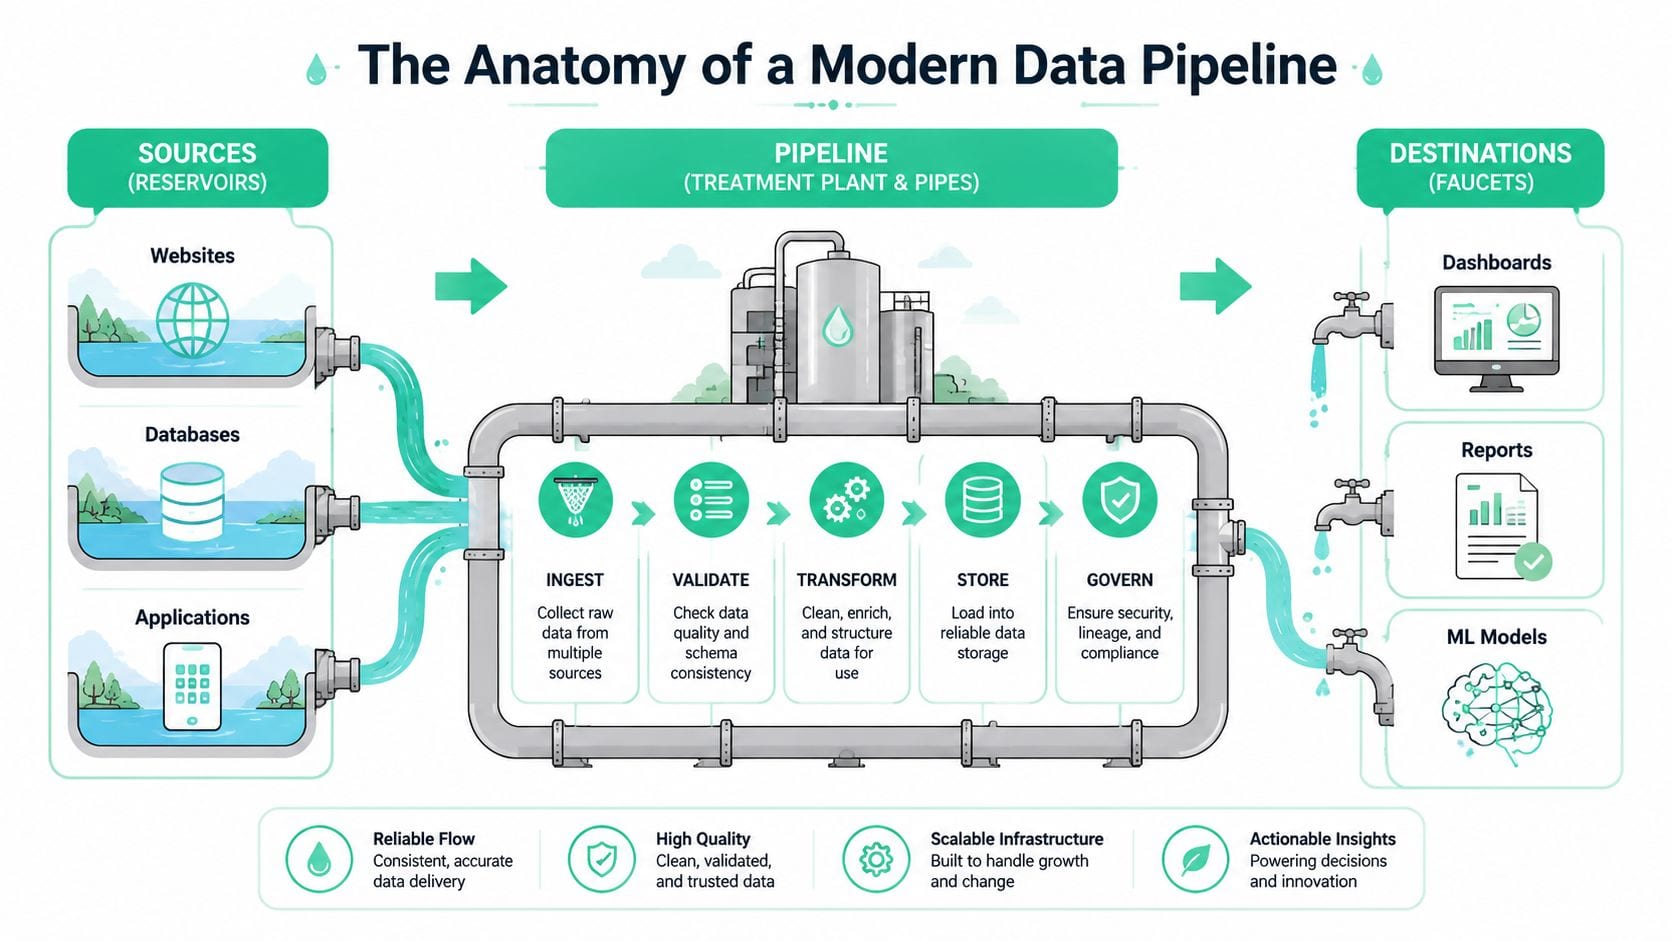
Four stages to sketch on a whiteboard
A modern ELT flow commonly has four stages. Extract pulls raw data from ad platforms, CRMs, and web events. Load lands that raw data in a warehouse. Transform runs models, identity resolution, and quality checks. Activate pushes modeled outputs back to CRM and advertising destinations, as described in this modern data stack reference.
You can map familiar tools to those stages:
- Extract: Google Analytics, Segment, application databases, and advertising APIs provide source records.
- Load: Snowflake stores the incoming data so teams can preserve the raw form and query it later.
- Transform: SQL or dbt models standardize names, resolve identities, apply business rules, and create trusted tables.
- Activate: Looker reads modeled data for reporting, while ad platforms or CRMs receive audiences and attributes for operational use.
The boundaries aren't always rigid. A tool can collect an event and route it to several destinations, while a warehouse can support both analytical queries and downstream activation. The important point is that each stage has a clear job and a defined handoff.
A pipeline needs behavior, not just steps
A one-off script may move data once, but a production pipeline runs repeatedly and responds to changing conditions. The production pipeline overview describes a data pipeline as a repeatable, observable process that moves data from raw to trusted while handling failures, typically combining ingestion, transformation, and delivery.
That means the design should answer practical questions. What happens when a source is unavailable? Can the team retry without duplicating records? How will it detect a missing field? Who receives the alert? What does the business do with partially processed data?
Teams designing regulated or finance-heavy workflows can also review top financial data integration tactics for additional context on connecting systems while preserving consistency and control. The same whiteboard should include the event definitions and collection layer, not just the warehouse. A clear data layer implementation helps teams understand how business interactions become structured events before those events enter the broader pipeline.
Choosing Between ETL ELT Batch and Streaming
The terms describe different decisions, so they shouldn't be treated as interchangeable labels. ETL and ELT describe where transformation happens, while batch and streaming describe how data arrives and gets processed.
A structured system for moving data into storage or analytics environments has roots in the 1970s, when organizations began using centralized databases and ETL-style processing to combine information for reporting and analysis, according to this historical timeline of ETL and ELT. Data warehousing later made this approach mainstream. Cloud warehouses changed the practical trade-off by making it easier to load raw data first and transform it inside the warehouse.
ETL versus ELT
With ETL, the pipeline extracts data, transforms it in an external processing layer, then loads the prepared result. This approach can help when data must be filtered or reshaped before it enters a destination, especially where storage, compute, or compliance constraints require that ordering.
With ELT, the pipeline extracts data and loads it in raw form before transformation. SQL and modeling tools then create curated tables inside the warehouse. This preserves source detail and makes reprocessing more flexible when business definitions change.
Neither pattern is automatically correct. Ask where transformation should happen, how much raw history must be retained, what privacy rules apply, and whether the destination has suitable compute.
Batch versus streaming
Batch processing groups records into bounded windows. It's generally easier to test, replay, and reconcile because the team can inspect a defined input period. Daily reporting, scheduled finance workflows, and many warehouse transformations can work well with this model.
Streaming processes events continuously. That supports low-latency use cases, but the system must manage late events, out-of-order events, state, windows, and replay. A streaming pipeline can produce a fast answer that is wrong if it doesn't account for events arriving after the initial calculation.
| Architecture | Best For | Typical Latency | Complexity | Cost Profile |
|---|---|---|---|---|
| ETL | Controlled preprocessing and systems that require transformed data before loading | Scheduled or workflow-dependent | Moderate, with transformation outside the destination | Depends on external processing and storage |
| ELT | Cloud warehouse analytics and iterative modeling | Scheduled or near real time | Moderate, with transformation inside the warehouse | Depends on warehouse compute and workload |
| Batch | Reporting, reconciliation, and replayable processing windows | Delayed, based on the schedule | Lower operational complexity | Often easier to control for predictable workloads |
| Streaming | Event-driven decisions and continuously fresh outputs | Low latency | Higher, because timing, state, replay, and backpressure matter | Depends on event volume and always-on processing |
Latency is the time from ingestion to usable output. Throughput is the amount of data processed per second. Production design must balance both, because a pipeline that delivers quickly but falls behind under load won't remain reliable. Teams evaluating real-time behavior can use real-time anomaly detection as part of a broader monitoring strategy.
A practical heuristic is simple. Choose batch when freshness can wait and replayability matters most. Choose streaming when a delayed event changes an operational decision. Choose ELT when a capable cloud warehouse should hold raw data and run flexible models. Choose ETL when preprocessing before storage is necessary. If the team is new to production data operations, start with the simplest architecture that meets the freshness requirement, then add streaming complexity only for a clear business reason.
A Real Marketing Analytics Pipeline in Action
Consider a marketing team that wants to connect campaign activity, website behavior, and executive reporting. The pipeline begins when a visitor interacts with a website. A tag manager captures the event and sends it to Segment, which routes the record to downstream systems.
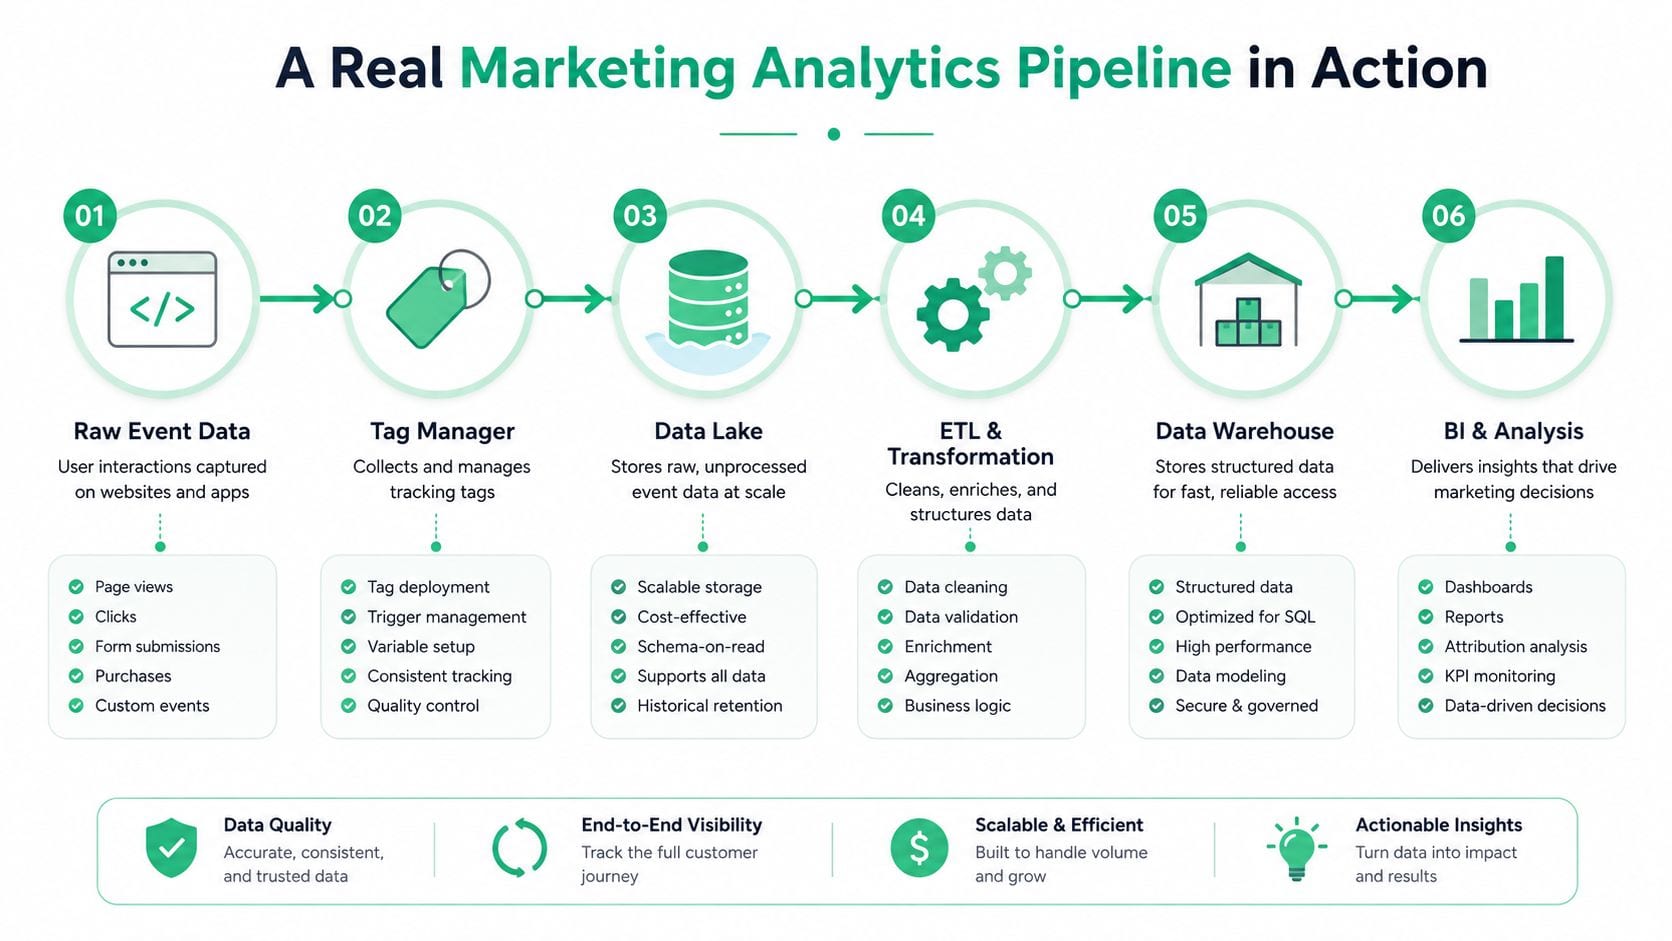
Following one event through the stack
The event should carry a stable name and a predictable set of properties. A purchase event might include an order identifier, product information, value, currency, and consent context. The exact fields depend on the organization's tracking plan, but every receiving system needs an agreed contract.
The flow might look like this:
- Website: A visitor submits a form or completes a purchase.
- Tag manager: The implementation collects the interaction and applies the required tags.
- Segment: The event is routed to configured analytics and marketing destinations.
- Snowflake: Raw events land in the warehouse, retaining the original payload for traceability.
- dbt: Models standardize fields, resolve identities, sessionize journeys, and create attribution-ready tables.
- Google Ads and Looker: Modeled outputs support audience targeting in Google Ads and executive dashboards in Looker.
Each handoff needs a contract. Segment must send the expected event and properties. Snowflake must accept and preserve the payload. dbt must interpret timestamps, identifiers, and campaign fields consistently. Looker must query a defined model rather than allowing every dashboard author to recreate attribution logic independently.
Why the model matters
Raw clicks rarely answer business questions directly. A model can connect events into user journeys, distinguish sessions, attach campaign information, and separate meaningful conversions from duplicate or malformed records. That transformation creates a reusable analytical surface for marketing, product, and finance.
The activation step completes the loop. A warehouse table isn't the final destination if the marketing team needs an audience in Google Ads or the executive team needs a current Looker dashboard. The pipeline must deliver trusted outputs into the places where people make decisions.
A broken event at the beginning can therefore affect every later stage. If the purchase name changes, the warehouse may load records under an unexpected structure, dbt models may exclude them, and both the dashboard and audience logic may become incomplete. Testing the final report alone won't reveal which handoff failed. Teams need visibility across the complete path from collection to activation.
Why Pipeline Reliability Is Now a Boardroom Issue
Pipeline reliability affects decisions that executives already monitor. A silent failure can distort attribution, cause marketers to optimize toward the wrong campaign, lead product teams to misread feature usage, or create revenue figures that don't reconcile with the CRM. The technical error may be small, but the business response can be expensive in time, attention, and trust.
The scale of the operating environment adds pressure. Statista forecasts that the global amount of data created, captured, copied, and consumed will reach 149 zettabytes in 2024, while another industry estimate projects 181 zettabytes by 2026, implying about a 21.48% increase in two years, as reported in this data pipeline efficiency overview. More data creates more dependencies, more schemas, and more opportunities for an unnoticed mismatch.
Reliability has an ownership problem
A pipeline can fail because of a technical bug, but teams also create failures through unclear responsibility. Marketing may own the event requirements, engineering may own the implementation, data engineering may own warehouse jobs, and analytics may own the dashboard. If nobody owns the end-to-end metric, each team can report that its own component is healthy while the business output is wrong.
Assign an owner for every critical flow. That person doesn't need to fix every defect, but they should coordinate diagnosis, define service expectations, and confirm that the final consumer has recovered.
A reliable pipeline has both an operational owner and a business owner. One protects execution, the other protects meaning.
Governance belongs inside the architecture
Modern pipelines increasingly encode data quality, semantic consistency, latency control, and compliance logic rather than treating them as separate documentation tasks. A purchase event should have an accepted definition, a freshness expectation, and rules for sensitive properties before it reaches dashboards or advertising destinations.
That governance also requires decisions about cost and scope. Teams should identify which outputs are business-critical, which sources can tolerate delayed processing, and which checks must stop delivery rather than merely generate a warning. The data integrity guide offers useful context for building those controls into digital analytics operations.
Executives don't need to manage transformation code. They do need clear answers when a key metric changes: did customer behavior change, did the source change, or did the pipeline break? Observability turns that uncertainty into an operational question with an accountable path to resolution.
Monitoring and Observability Practices That Work
A pipeline may report a successful run while delivering incomplete or misleading data. Reliable monitoring checks both system health and data behavior, because a green status does not prove that the output still represents reality.
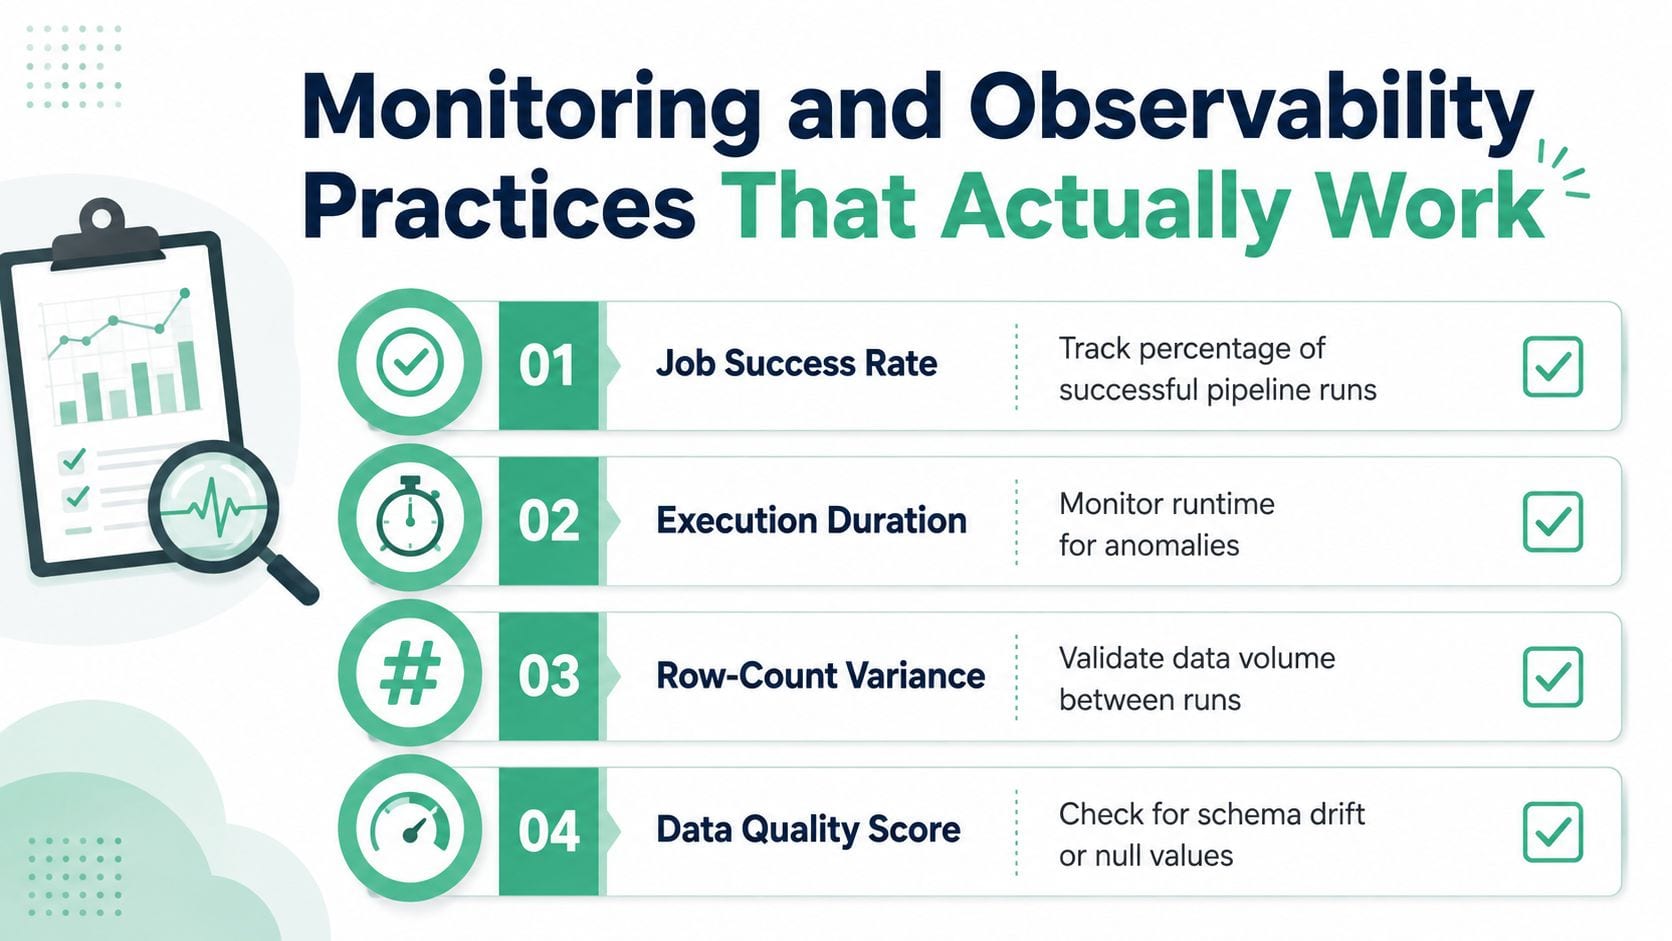
Begin with the flows that affect customers, revenue reporting, compliance audits, or machine learning models. Prioritize the most critical pipelines rather than instrumenting every workflow at once, as outlined in this data observability guide. A focused starting set gives the team clear ownership and a manageable way to improve coverage.
The signals to capture
Track operational and quality indicators that reveal different kinds of failure:
- Job success rate: Separate failed, skipped, and unexpectedly successful runs.
- Execution duration: Find runtimes that drift beyond the normal operating pattern.
- Row-count anomalies: Compare incoming and processed volumes across comparable runs.
- Schema changes: Detect added, removed, or altered fields before transformations fail.
- Null rates: Identify required properties that suddenly disappear.
- Uniqueness violations: Catch duplicate identifiers and repeated records.
- Table freshness: Confirm that downstream users receive current data.
- Query performance: Find warehouse behavior that delays dashboards or dependent jobs.
Each signal answers a different question. A success status shows that a task finished. Row counts and null rates indicate whether the result still resembles the expected input. Freshness shows whether the business receives that output when it needs it.
Protect the flow under pressure
Measure throughput, processing latency, drop rates, and export errors as well. Early filtering, multi-destination routing, and backpressure handling can reduce data loss when downstream systems slow down, as described in this observability pipeline guidance.
Set expectations for each critical flow instead of applying one universal rule. A revenue dashboard may need a freshness check, while an archival load may place greater weight on completeness and replayability. Alerts should state what changed, identify the affected source or destination, and reach people who can act.
Trackingplan can provide a monitoring layer for digital analytics implementations. It continuously discovers Martech implementations, monitors analytics pixels, detects missing or rogue events, schema mismatches, possible PII leaks, and consent misconfigurations, then alerts teams through email, Slack, or Microsoft Teams before broken tracking reaches downstream reporting. Teams can also review this data pipeline monitoring guide for additional monitoring practices.
Your Data Pipeline Implementation Checklist
Use this checklist to assess an existing pipeline or plan a new one.
- Define sources and destinations: List websites, apps, CRMs, ad platforms, warehouses, dashboards, and activation tools. Confirm what each handoff is supposed to deliver.
- Choose the architecture: Select ETL or ELT based on where transformation belongs. Select batch or streaming based on freshness needs, replay requirements, data behavior, and team maturity.
- Build transformation logic: Preserve raw inputs, document event contracts, use consistent business definitions, and make models testable and recoverable.
- Implement monitoring and alerting: Track job status, runtime, volume, schemas, nulls, uniqueness, freshness, query performance, throughput, latency, drop rates, and export errors. Start with the most critical pipelines.
- Establish ownership and governance: Name a technical owner and a business owner. Define escalation paths, privacy rules, change procedures, and the point at which bad data must be blocked.
A pipeline isn't finished when the first dashboard loads. Sources change, schemas evolve, campaign conventions drift, and business questions require new models. Review the flow regularly, test changes before release, and keep the definition of trusted data visible to every team that depends on it.
Modern tools have made pipeline construction and monitoring more accessible, but reliability still comes from deliberate design. Teams that invest in observability now build stronger data trust and make faster decisions as their systems grow.
Trackingplan provides automated observability for digital analytics across web, apps, and server-side stacks, helping teams discover tracking implementations, monitor analytics and marketing pixels, and detect broken events, schema mismatches, consent issues, and potential PII leaks. Visit Trackingplan to see how its monitoring layer can help protect the data pipeline behind your dashboards and campaign decisions.