Advanced aggregations in Data Explorer
Understanding how your tracking data behaves across sessions just got a lot more powerful. We've introduced advanced aggregations in Data Explorer — giving you sum, average, median, p50, and p75 directly in your columns, so you can go beyond raw counts and start analyzing distributions that actually reflect user experience.
The Challenge: Counts Only Tell Part of the Story
Raw event counts are a starting point, but they don't reveal how values are distributed across your data. A metric like Time Since Page Load can average out deceptively — a handful of extreme outliers can pull your mean in ways that mask what most users are actually experiencing.
Without percentile-level aggregations, spotting those patterns meant exporting data and crunching numbers externally. That's time you could spend acting on insights instead of preparing them.
The Solution: Advanced Aggregations in Data Explorer Columns
You can now apply the following aggregations directly to supported columns in Data Explorer:
- Sum — get totals across all matching events in your selection.
- Average — see the mean value at a glance.
- Median (p50) — understand what a typical event looks like, unaffected by outliers.
- p75 — identify the threshold that 75% of events fall under, a useful signal for performance monitoring.
These aggregations are now available for Time Since Page Load, giving you a much richer view of page performance signals captured in your tracking data. Need aggregations enabled for additional metrics? Reach out to our support team so they can activate for you your use case.
How It Works
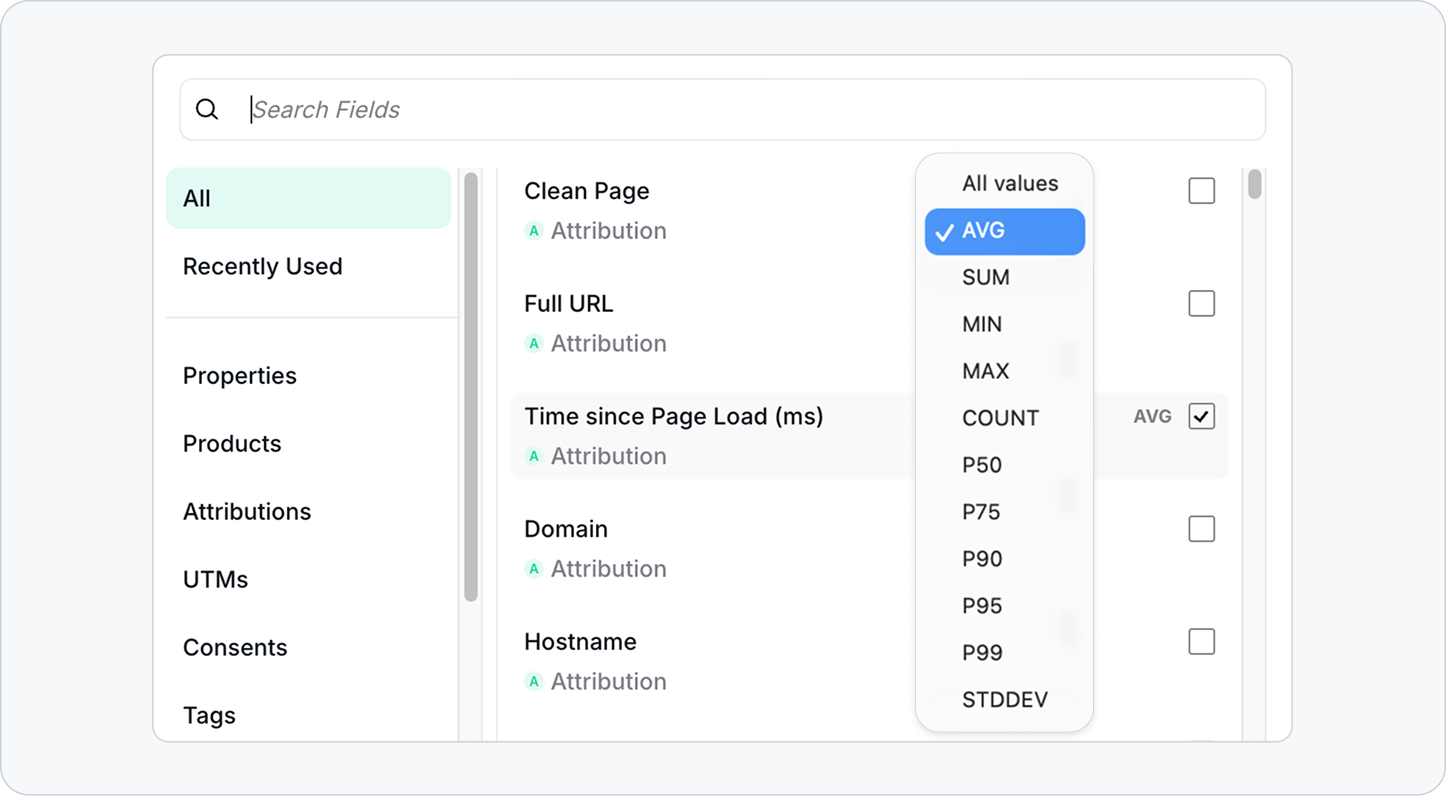
- Open Data Explorer and build or load a view with Time Since Page Load as a column.
- Select the aggregation type you want to apply — sum, average, median, p50, or p75.
- Analyze the resulting values directly in your Data Explorer view.
- Need this for another metric? Contact our support team to request it.
Advanced aggregations for Time Since Page Load are live now. Log in at Trackingplan and open Data Explorer to try them out.
Happy Tracking!