Last 24 Hours’ Traffic, Now in Hourly Detail
What’s New?
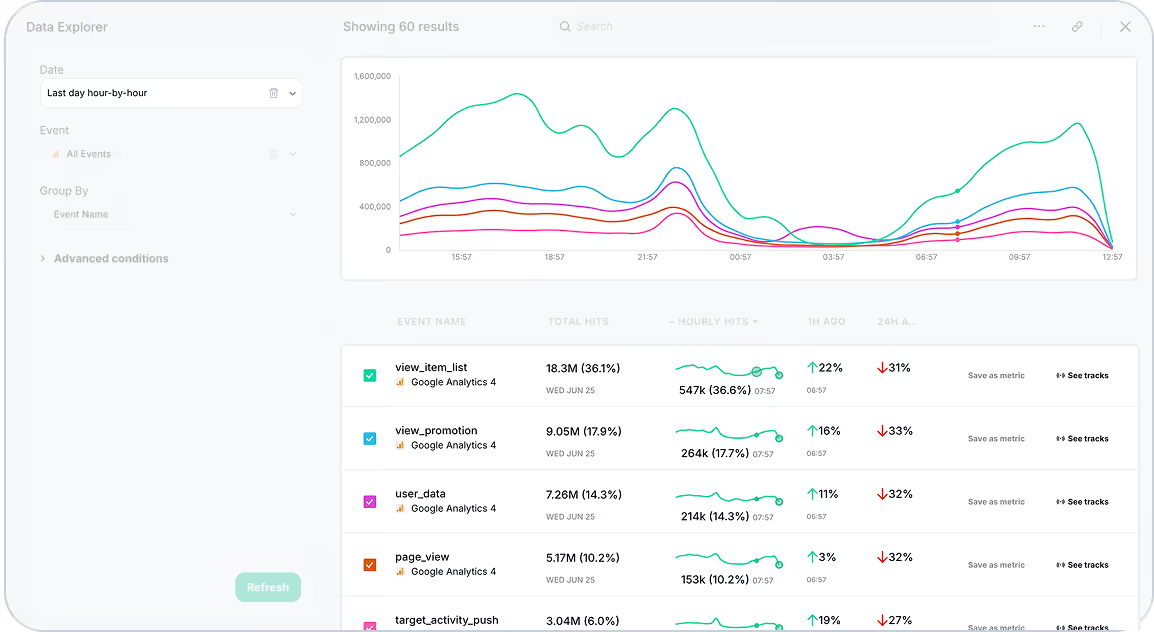
Trackingplan’s Data Explorer just got a powerful upgrade: you can now view your last 24 hours’ traffic data with hourly granularity. Instead of seeing a daily summary, this new hourly breakdown lets you track how your traffic flows and changes throughout the day.
Why It Matters
Understanding traffic trends in finer detail means you can:
- Spot traffic spikes or drops as they happen, not hours later.
- Evaluate the immediate impact of marketing campaigns, site changes, or launches with precision.
- React faster and make confident, data-driven decisions without waiting for end-of-day reports.
This feature transforms your data from a static snapshot into a dynamic tool for agile, proactive monitoring.

How It Works
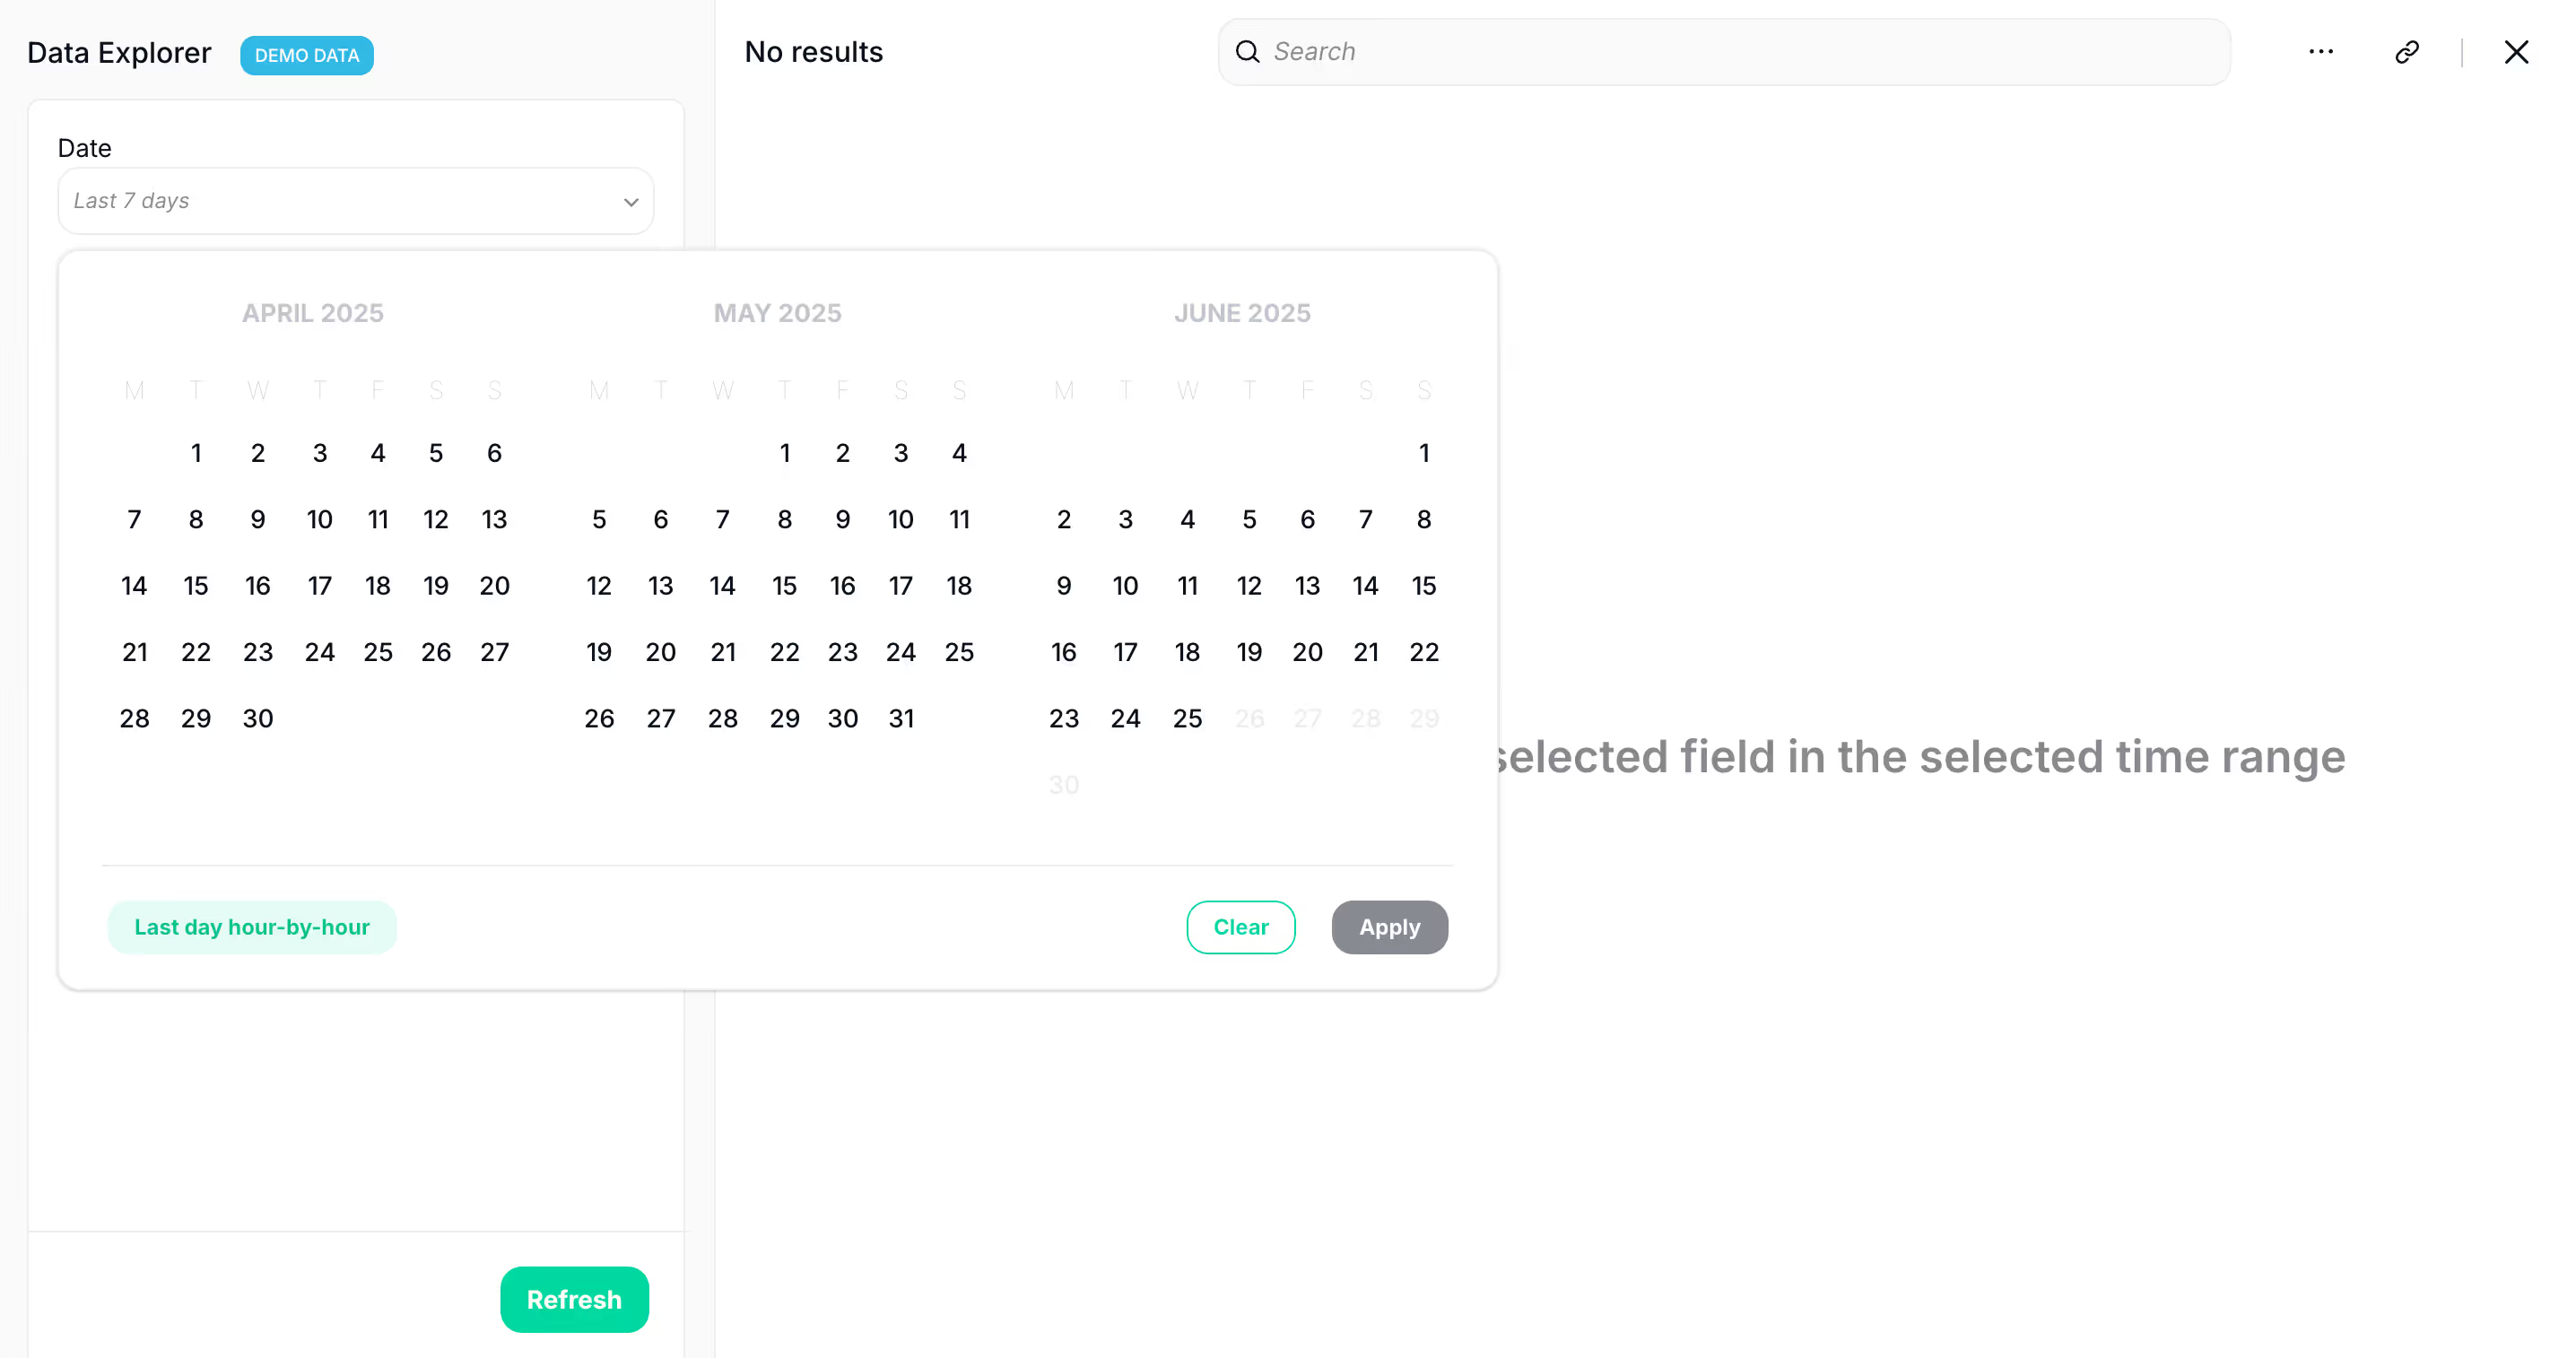
When you explore your current data in Trackingplan, simply choose the “Last day hour-by-hour” option. Your dashboard will update to show traffic trends hour-by-hour over the last 24 hours — clear, visual, and easy to interpret at a glance.
Tips & Use Cases
- Use hourly views during high-traffic events like sales or product launches to monitor performance minute-by-minute.
- Quickly identify the exact hour when an unexpected traffic surge or dip occurred, making troubleshooting simpler.
- Combine this view with your alerting setup to prioritize issues that happen in real time.
This update helps you stay ahead, turning your tracking data into actionable insights — so you can keep your site performing at its best every hour of the day.
Ready to explore? Give it a try and start exploring!
Got questions or feedback? Our support team is always here to help.
Happy tracking!