Percentages in Trackingplan Presence Map
June 24, 2025
What’s New?
We’ve enhanced the Trackingplan Presence Map to make understanding your tracking coverage easier and more precise than ever.
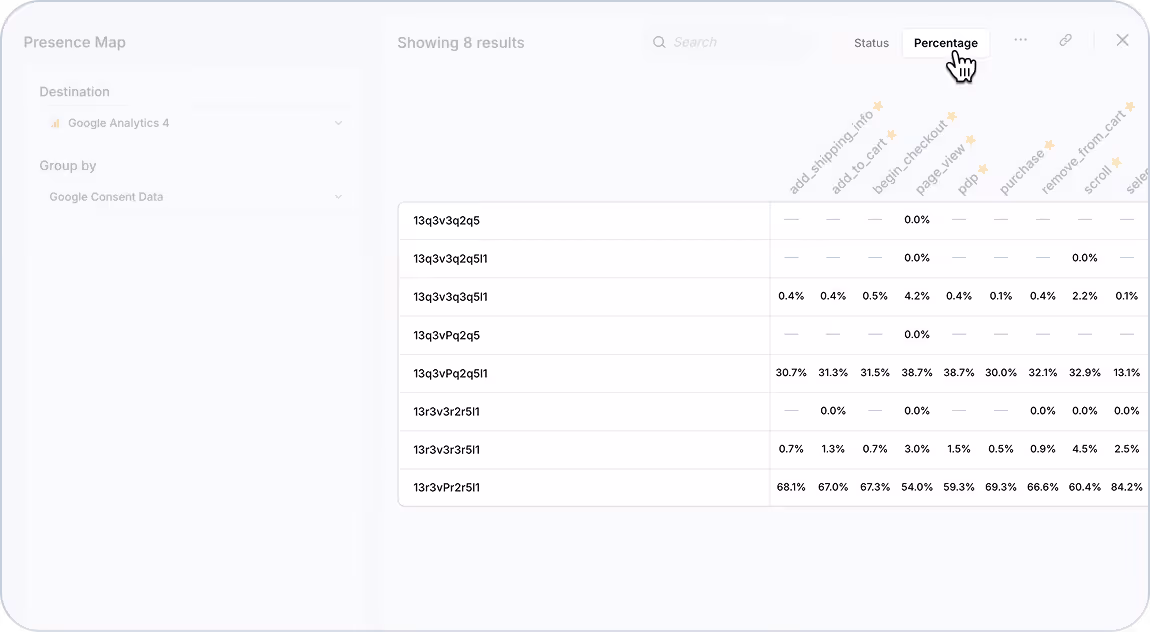
- Percentage Mode: Beyond the original color-coded indicators, you can now toggle on percentage view to see exactly how much of your site or app is tracking each event, pixel, consent setting, or DataLayer value — shown as a clear percentage.
- CSV Export: Export your full Presence Map as a CSV file for effortless sharing and deeper analysis in your favorite tools.
Why It Matters
This update turns your Presence Map into a powerful tool to:
- Quickly identify where events and pixels are consistently tracked — or where they’re missing or only partially implemented.
- Spot tracking gaps or unexpected changes right after a release or update, helping you maintain data accuracy and reliability.
- Analyze coverage trends with precision, giving you confidence that your tracking setup is complete and working as intended.
No more guessing or manually counting — just straightforward percentages to guide your audits and troubleshooting.
.avif)
How It Works
- Switch your Presence Map to Percentage Mode to see coverage rates for each event or setting across pages and dimensions.
- Use color-coded indicators for a quick visual overview, or dive deeper with exact percentages when you need more detailed insights.
- Export your Presence Map data with one click as a CSV file, perfect for team collaboration or advanced analysis.
Tips & Use Cases
- Use percentage view during QA and post-launch reviews to confirm all critical events are firing consistently.
- Share the CSV export with your developers or marketing team to align on tracking completeness and action items.
- Track long-term trends by saving exports over time, helping you spot tracking drift or improvements.
With these improvements, tracking coverage visibility becomes simpler and more actionable — helping you keep your analytics clean and your decisions confident.