How to Measure Data Quality: Key Metrics and Methods to Improve It
Meet the 6 core data dimensions you can use to know how to assess data quality to understand the impact .
Mariona Martí
Digital Marketing Specialist
June 22, 2025
8
min
Data quality is measured by evaluating key metrics such as accuracy, completeness, consistency, and timeliness. These dimensions help organizations assess the reliability of their data and identify areas for improvement across their pipelines.
By now, you’ve probably heard about how data can help you make better decisions to keep your business moving forward in the right direction. Yet, considering that data-driven decisions and policies are only as good as the data on which they are based, not knowing how to assess data quality and not having the necessary metrics to quantify the quality of the data you’re using to guide your business can result in poor-performing decision-making.
The quality of our data defines the quality of the product we serve, and for it, data exploitation can only be successful if it is sound and of high quality.
What is Data Quality?
Data quality refers to the degree to which data is accurate, complete, consistent, and reliable for its intended use. High-quality data ensures that business decisions, analytics, and operations are based on trustworthy and actionable information.
Measuring data quality involves evaluating how well your data meets specific criteria across its entire lifecycle—from collection and storage to processing and analysis.
Why Measuring Data Quality Matters?
Poor data quality can lead to inaccurate reporting, flawed decision-making, and wasted resources. Organizations rely on data to guide everything from customer interactions to strategic planning—so ensuring its quality is essential.
Key reasons to measure data quality include:
✅ Business Efficiency: Clean, reliable data reduces time spent fixing errors and allows faster decision-making.
✅ Compliance & Risk Management: Many regulations (like GDPR or HIPAA) require accurate and traceable data.
✅ Customer Experience: Inaccurate data can result in failed communications, poor targeting, and lost trust.
✅ Data Governance & Strategy: Ongoing measurement reinforces good governance practices and uncovers improvement areas.
How to measure data quality?
To understand the impact of poor Data Quality, you need to make that impact quantifiable if you want to be able to better represent the importance of fixing Data Quality to executives within your organization.
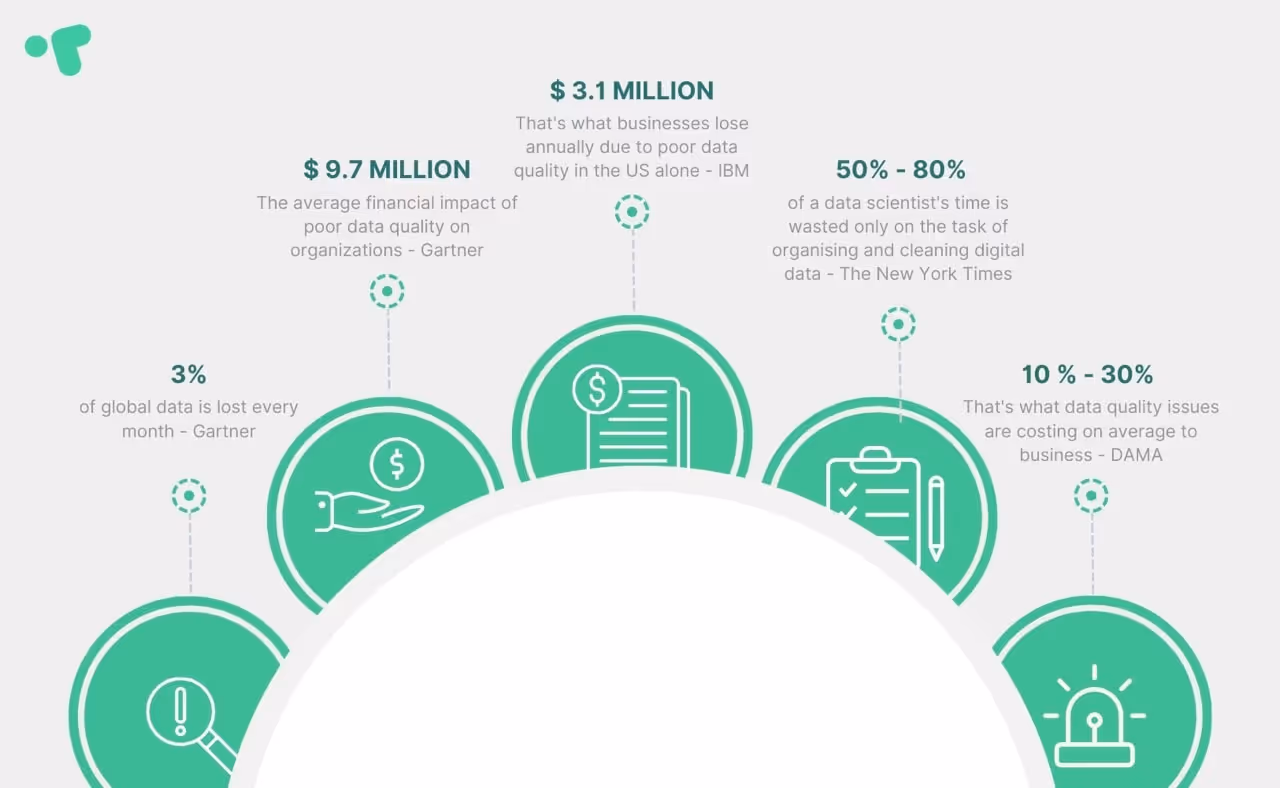
Erroneous decisions made from bad data are not only inconvenient but also extremely costly and time-consuming. According to Gartner, “the average financial impact of poor data quality on organizations is $9.7 million per year.” IBM also discovered that in the US alone, businesses lose $3.1 trillion annually due to poor data quality.
For it, there are data 6 core dimensions that can be used to measure and predict the accuracy of your Data Quality. Let’s dig into each of them in more detail:
Data quality is measured by evaluating key metrics such as accuracy, completeness, consistency, and timeliness. These dimensions help organizations assess the reliability of their data and identify areas for improvement across their pipelines.
Tools to Measure Data Quality
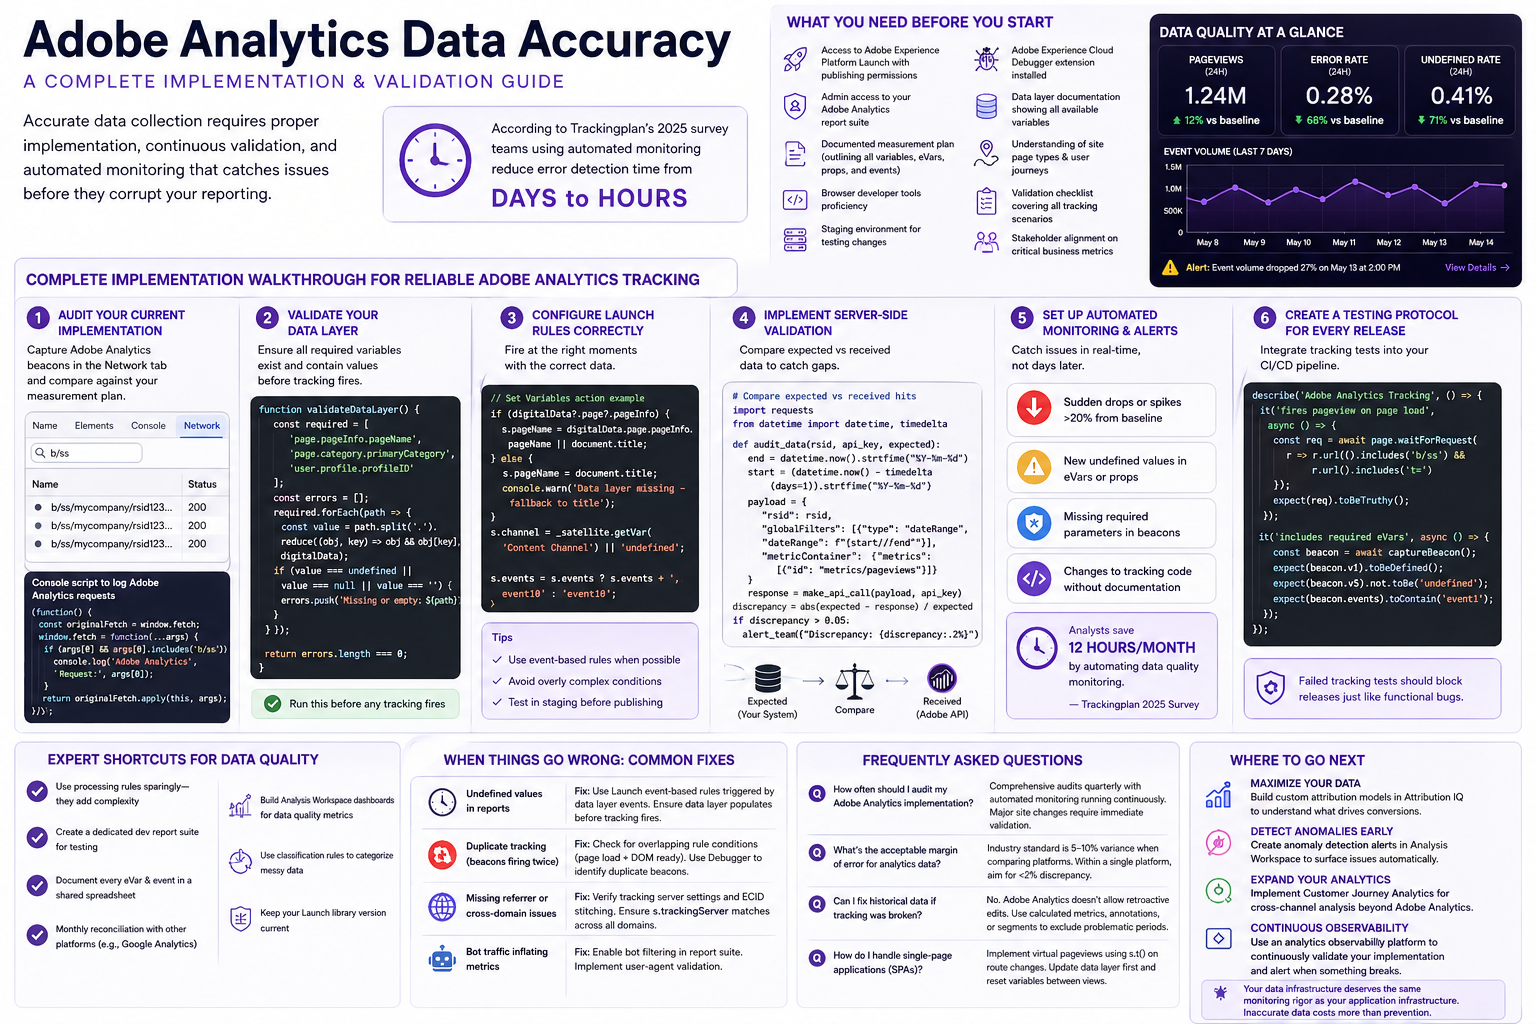
• Trackingplan: Automatically audits analytics data to detect missing events, inconsistent parameters, and schema drift. It continuously monitors marketing and product data pipelines to ensure everything is being collected correctly.
• Great Expectations: An open-source tool for writing data validation tests.
• Monte Carlo / Atlan / Collibra: Enterprise-grade data observability and governance tools that include quality metrics dashboards.
Typical Data Quality Formulas:
• Accuracy Rate (%) = (Correct Records / Total Records) × 100
• Duplicate Rate (%) = (Duplicate Records / Total Records) × 100
These formulas can be automated using data quality rules embedded in ETL pipelines or data monitoring tools like Trackingplan.
The 6 Key Data Quality Metrics
Accuracy
Accuracy is the first and most critical standard of the data quality framework and refers to the correctness of the data in its attempt to model real-world objects or events.
Inaccurate data in healthcare could mean making a fatal mistake in patient care. In retail, it might result in costly mistakes in business expansions. For marketers, this might mean targeting the wrong customers with the wrong message in the wrong media, annoying mistargeted consumers while ignoring higher-potential ones who might be interested in buying what they’re selling.
Data inaccuracies can be attributed to multiple causes, including human error, data drift, and data degradation.
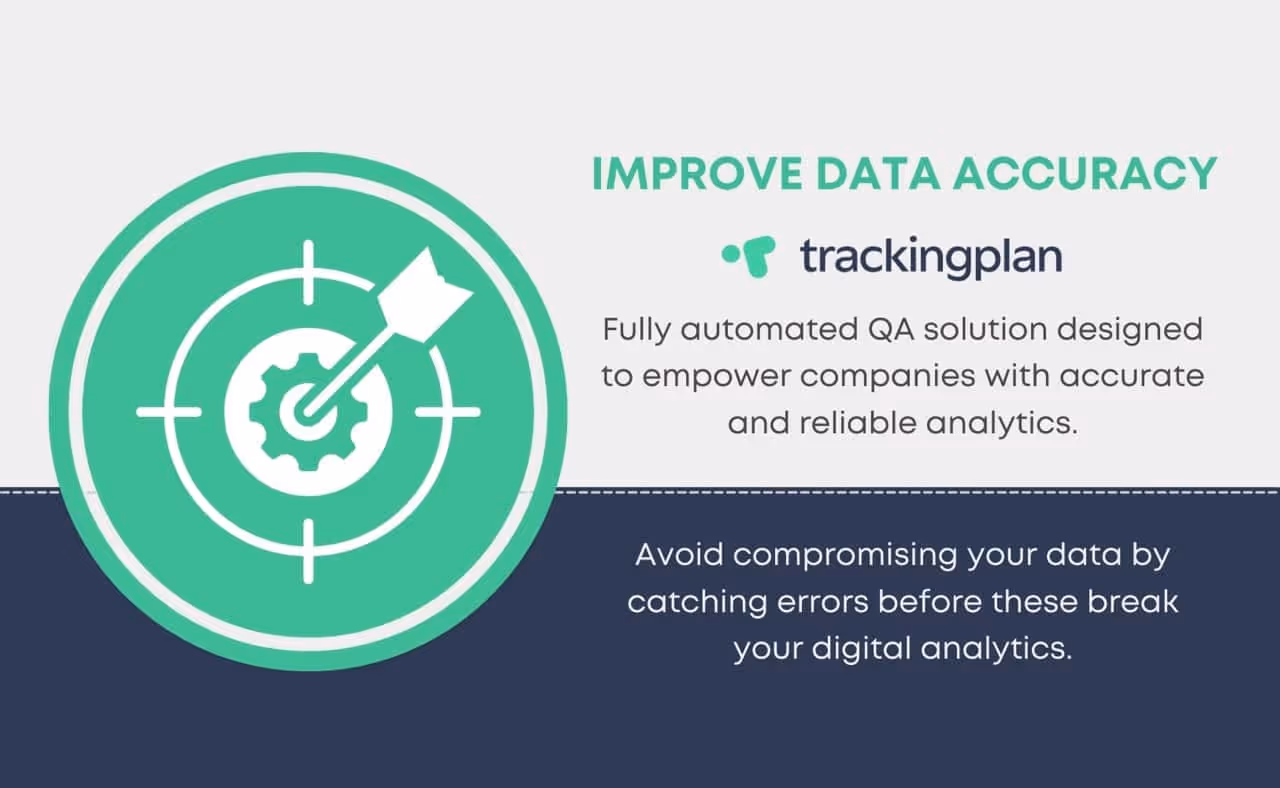
Trackingplan provides a fully automated QA solution that empowers companies with accurate and reliable digital analytics. Our end-to-end coverage of what is happening in your digital analytics at every stage of the process is designed to help you prevent your test executions do not break your analytics before going into production and offers you a quick view of the regressions found between them and their baseline so that you can understand the root cause of those errors in order to fix them before compromising your data.
Completeness
Data is considered “complete” when it fullfills the expectations of comprehensiveness. Let’s say you ask your customers to supply their names. You might set the customers’ middle names as optional, but as long as you have the first and last names, the data is complete.
In that sense, completeness does not measure accuracy or validity; it measures whether all the required data elements are present and no elements needed are missing.
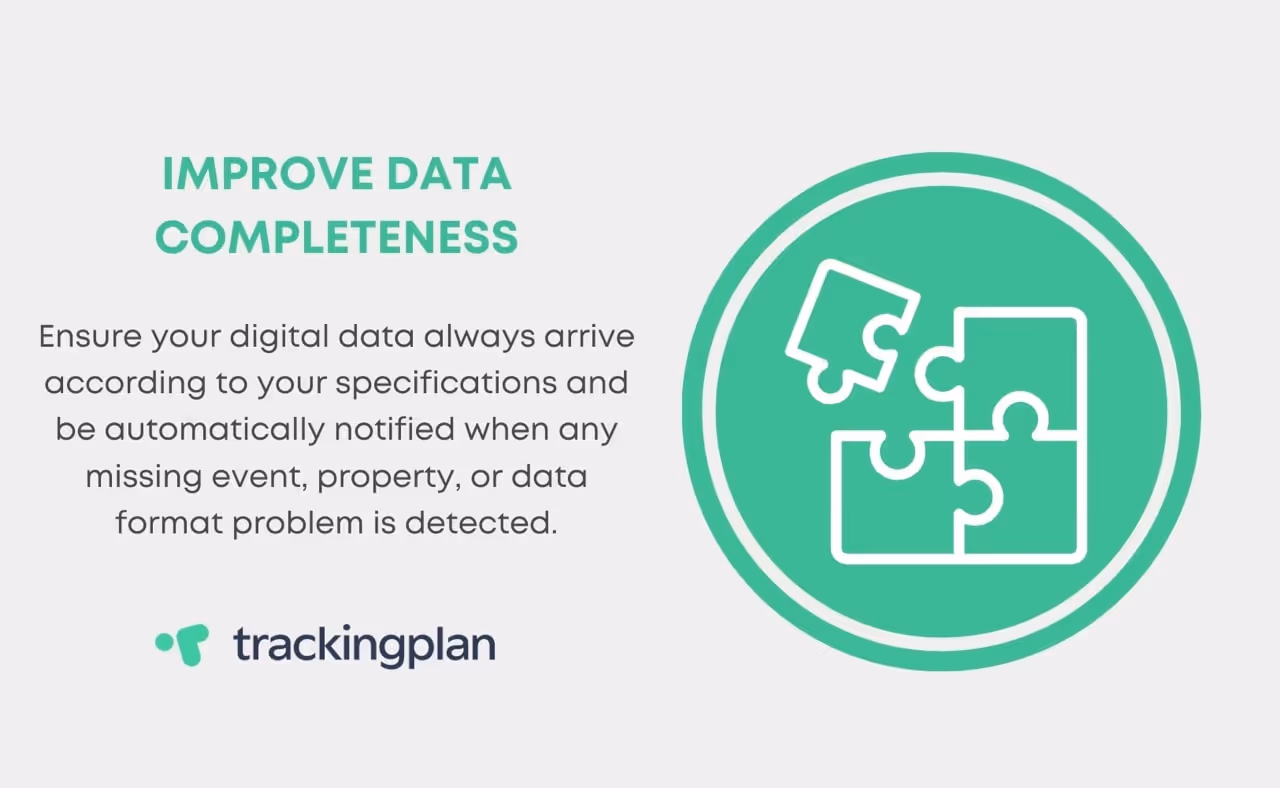
Trackingplan ensures your data always arrive according to your specifications and automatically warns you when it detects missing events or properties or any data format problem.
Consistency
This dimension refers to whether the data is internally coherent and consistent across different sources.
If that information matches, it’s considered “consistent. However, as businesses grow, it also does the increasing complexity of having a big picture of this dimension, as data is scattered across applications. With it, the possibility to spot instances in which this information conflicts with itself also becomes more and more complex while they tend to accumulate and devalue the data.
The New York Times noted that this can lead to what data scientists call ‘data wrangling’, ‘data munging’, and ‘data janitor’ work, something that forces them to spend from 50 percent to 80 percent of their time in this more mundane labor of collecting and preparing unruly digital data before it can be used for strategic decision-making.
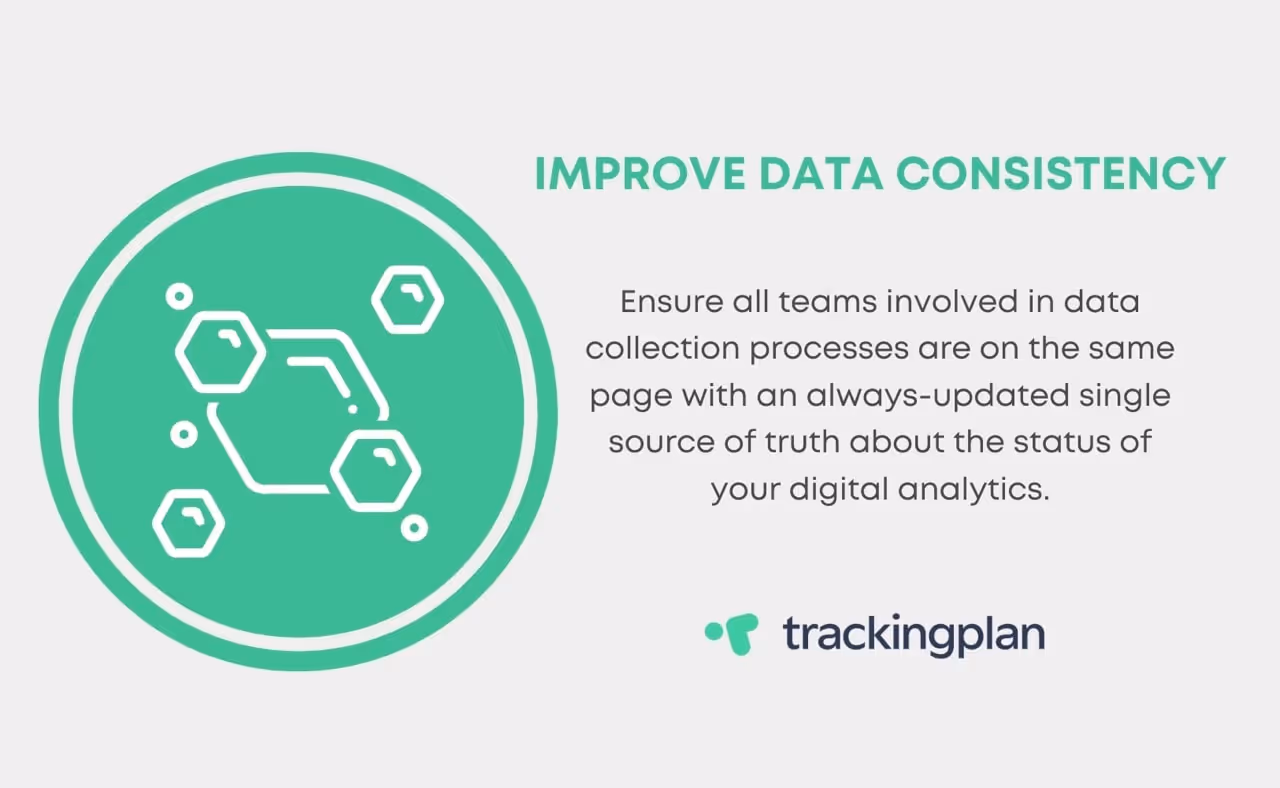
Trackingplan automatically monitors all the traffic that flows between your sites, apps, and CDP platforms. That makes us the only solution that offers a single and always updated single source of truth to show you the real picture of your digital analytics status at any given moment. All teams involved in first-party data collection can collaborate, detect inconsistencies between your events, and properties, and easily debug any related issues.
Timeliness
Timeliness refers to whether the data is available and up-to-date right when it’s needed.
An example of this dimension might be a receptionist in a hospital who needs to inform a family member about the room in which another family member is located. If the hospital’s system was expected to be updated every week, we would be talking about a serious timeliness problem. If not, consider what would happen if air traffic controllers received a single daily download from the radar system, as opposed to observing air traffic in real time.
Trackingplan offers you an always updated picture of the current state of your digital analytics in real-time that connects and ensures all teams involved in the data collection process are on the same page.
Uniqueness
Today enterprises are assaulted with data from all angles, including local databases, cloud data lakes, streaming data, applications, and system silos. These sources are likely to include a significant amount of redundancy and overlap. In this regard, uniqueness is designed to avoid duplicated data stored in multiple locations. When data is “unique”, no other records exist more than once within a database.
Using Excel formulas to identify and fix duplicate records is difficult and time-consuming, and it might take your team up to a week to identify only a portion of duplicate records. Trackingplan automatically warns you about duplicate and rogue events that deteriorate your data quality and distort your analytical results so that you can focus on what you do best.
Validity
This dimension measures how data conform to pre-defined business or format rules to which data needs to fall within these defined parameters.
For instance, if an email address didn’t have any @ characters, or a ZIP code had only four digits instead of five, we would be talking about a validity problem.
And speaking of validation errors, Trackingplan allows you to set up Regular Expressions (RegEx) to validate that all the values for your properties conform with the pattern you specify or, in case it’s not, automatically send you a warning.
Moreover, you can also set up any kind of complex validation setting, like validating whether all products logged in a cart carry a valid product_sku given the page section, with custom validation functions.
How to improve Data Quality?
Improving data quality is not a one-time fix—it’s an ongoing process that requires monitoring, validation, and team collaboration. Here are practical strategies:
Set clear data standards: Define acceptable values, formats, and validation rules for every data field.
Implement automated validation: Use tools like Trackingplan or Great Expectations to enforce rules in real time.
Train data stewards and owners: Assign responsibility to specific team members to maintain quality.
Monitor changes continuously: Detect drifts, broken schemas, or missing fields before they impact downstream reports.
Regularly clean and deduplicate data: Use scripts or tools to identify and fix duplicates or errors.
Integrate data observability into your workflows: Tools like Trackingplan can act as your “watchdog” for both product and marketing analytics pipelines.
Improving data quality leads to better insights, stronger compliance, and more confident decision-making.
Common Data Quality Issues and How to Detect Them
Even in well-governed systems, data quality issues can appear due to human error, broken integrations, or system migrations. Here are common issues and how to detect them:
Common Data Quality Issues and How to Detect Them
Even in well-managed data systems, quality issues can arise from human errors, system failures, or integration mismatches. The table below outlines the most common data quality problems and how to identify them early:
Issue
Description
How to Detect It
Missing values
Null or empty fields in critical data columns
Use validation rules or data completeness dashboards
Duplicate records
Same entity or event logged more than once
Run deduplication queries or fuzzy matching scripts
Schema drift
Unexpected changes in the structure of events or datasets
Use automated schema monitoring tools like Trackingplan
Inconsistent formats
Different representations of the same data (e.g., dates, currencies)
Standardize inputs and run profiling checks for format anomalies
Outliers or anomalies
Sudden spikes, drops, or irregular patterns in data
Set thresholds and configure anomaly detection alerts
A strong observability layer like Trackingplan can help catch these issues proactively—before they affect reports or campaigns.
Data Quality Detection vs. Data Quality Prevention
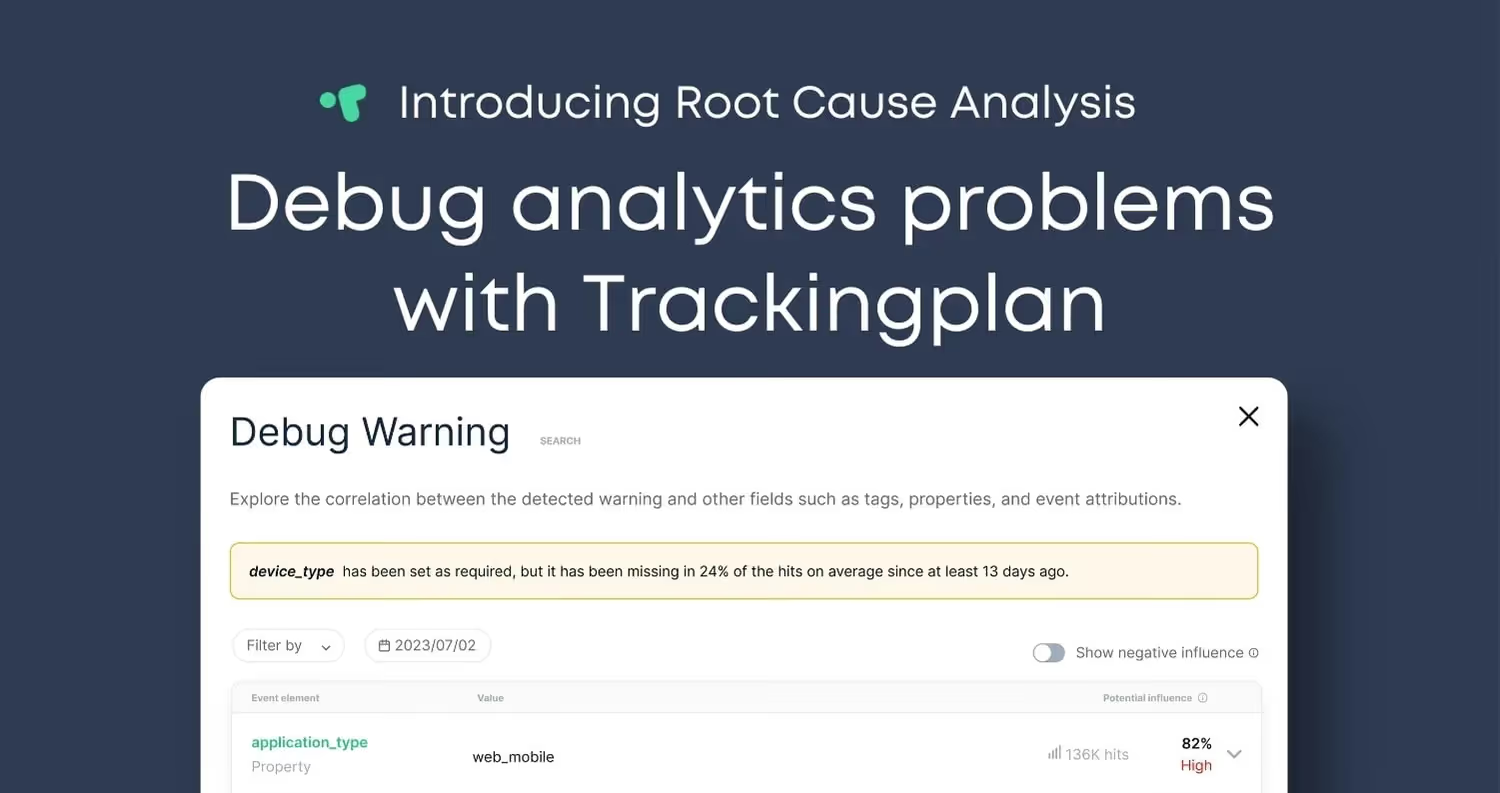
Data quality detection refers to the process of assessing the accuracy, completeness, consistency, and reliability of data in a dataset. It involves identifying errors, inconsistencies, and missing values in data and taking appropriate measures to rectify them. The goal of data quality detection is to ensure that data is fit for use and can be trusted for decision-making purposes. Data quality detection allows you to understand the state of data quality at any given team and identify errors/regressions when they happen, as well as their root cause.
Yet, the journey of improving Data Quality reaches its peak by constructing a framework that proactively prevents inaccuracies and discrepancies at the roots, rather than reacting to issues after they occur.
Data quality prevention refers to the process of proactively designing and implementing measures to prevent errors, inconsistencies, and other issues from occurring in the first place, rather than just detecting and correcting them after they occur. It involves implementing best practices and procedures to ensure that data is accurate, complete, consistent, and reliable from the outset.
if you don’t want to decide between any of these crucial processes, Trackingplan offers you a fully automated observability and analytics quality assurance solution for your digital analytics that combines both approaches.
Trackingplan creates a single source of truth where all teams involved in first-party data collection can collaborate, and automatically receive notifications when things change or break in your digital analytics, marketing automation, pixels, or campaigns to ensure your data is clean, accurate, and compliant. For more information, feel free to book a demo, or try Trackingplan for free.
Mariona Martí
Learn from Mariona, a Digital Marketing expert empowering businesses with accurate analytics and error-free attribution at Trackingplan.
By clicking “Accept All Cookies”, you agree to the storing of cookies on your device to enhance site navigation, analyze site usage, and assist in our marketing efforts. View our Privacy Policy for more information.