Learn how to prevent data loss with proven strategies. Safeguard your marketing and analytics data with actionable tips on observability and governance.
Preventing data loss in your marketing and analytics stack isn't just about having backups. It’s about proactively safeguarding the data streams that your entire business runs on. The best defense is a good offense—a clear data governance plan paired with automated monitoring that catches broken tracking, schema errors, and other silent killers before they poison your insights.
The Hidden Costs of Analytics Data Loss
When you hear "data loss," you probably think of a massive server failure or a high-profile security breach. And while those are definitely bad news, the more common and insidious threat for marketing and analytics teams is far quieter. It's the slow, silent corruption of data that happens one broken pixel or messed-up schema update at a time.
This isn't about your dashboards suddenly going dark. It's about the gradual erosion of trust in the numbers. When your analytics are unreliable, every decision you make is built on quicksand.
From Small Gaps to Big Mistakes
Here’s a real-world scenario I’ve seen play out. A team pushes a routine app update, but it accidentally breaks the purchase event tracking for iOS users. The event still fires, so no alarms go off, but a critical price property is now missing. Your dashboards won't show a total failure, but your revenue attribution will be completely wrong.
Weeks go by. The marketing team looks at the data and concludes that their latest ad campaign targeting iOS users was a flop. They pull thousands in ad spend and reallocate it. The campaign wasn't the problem at all—the broken data was. This is exactly how tiny data gaps snowball into flawed business strategies and wasted money.
The real cost of analytics data loss isn't just the missing information. It's the chain of poor decisions and misallocated investments that follows. It transforms a powerful asset into a source of organizational confusion.
The Financial Impact of Delayed Detection
This problem has a very real financial cost that goes way beyond a misguided ad campaign. The longer a data issue flies under the radar, the more expensive it becomes to fix—both in engineering hours and lost opportunities. Recent studies found the global average cost of a data breach is a staggering $4.44 million. And get this: breaches that took over 200 days to resolve cost an extra $1.39 million compared to those caught quickly. Speed is everything. You can read more on how faster detection cuts these costs in the latest data breach statistics on deepstrike.io.
While a missing analytics property might not feel like a security breach, the principle is identical: the faster you detect and contain the issue, the smaller the financial fallout. This is why preventing analytics data loss is a shared responsibility. It’s not just an IT task; it’s a mission that should unite marketing, analytics, and engineering.
Developing Your Data Loss Prevention Framework
Moving from reactive fire-fighting to proactive prevention really boils down to having a solid framework. This isn't about buying a single piece of software; it's about building a multi-layered strategy that fosters a culture of data reliability. The whole point is to answer the core question of how to prevent data loss before it starts, creating an always-on system that protects the integrity of your analytics.
A well-structured approach fundamentally changes how your teams operate. Instead of an analyst discovering a data issue weeks after the fact, your engineers can get instant alerts about tracking errors right in their development workflow. This shift makes data quality a shared, automated responsibility.
Establish Your Data Governance and Tracking Plan
The bedrock of any prevention framework is a robust Data Governance and Tracking Plan. Think of this as the constitution for your analytics—it's the single source of truth that defines exactly what data you collect, why you collect it, where it comes from, and who owns it. Without this, you're just flying blind.
A clear tracking plan documents every single event, property, and user trait. It should specify naming conventions, data types, and the business question each piece of data is meant to answer. This document isn't a one-and-done for onboarding; it's a living blueprint that developers use during implementation and analysts lean on for validation. It cuts out ambiguity and drastically reduces the chances of human error, which is a massive source of data corruption.
By creating a central, agreed-upon tracking plan, you eliminate the guesswork that leads to inconsistent tagging and broken reports. It aligns marketing, product, and engineering on a common data language, making your entire analytics setup more resilient.
This process is absolutely critical if you want to build a scalable analytics practice. You can find more practical steps on this topic by exploring our guide to bulletproof your digital analytics with data validation, which details how to set up these essential checks.
Implement Technical Safeguards and Resilient Pipelines
With a governance plan in place, the next layer involves the technical safeguards that embed data quality directly into your code. Using version control like Git for your tracking code is non-negotiable. It lets you track changes, understand who deployed what, and quickly roll back any updates that introduce errors.
Building resilient data pipelines is also crucial. This means incorporating things like error handling, retries, and dead-letter queues into your data ingestion process. If an analytics endpoint is temporarily unavailable, a resilient pipeline won't just drop the data; it will queue it up and try sending it again later, preventing nasty gaps in your reporting.
These technical measures are the guardrails that protect your data streams from the most common points of failure.
This flow chart really drives home how data loss incidents can directly harm your company's bottom line.
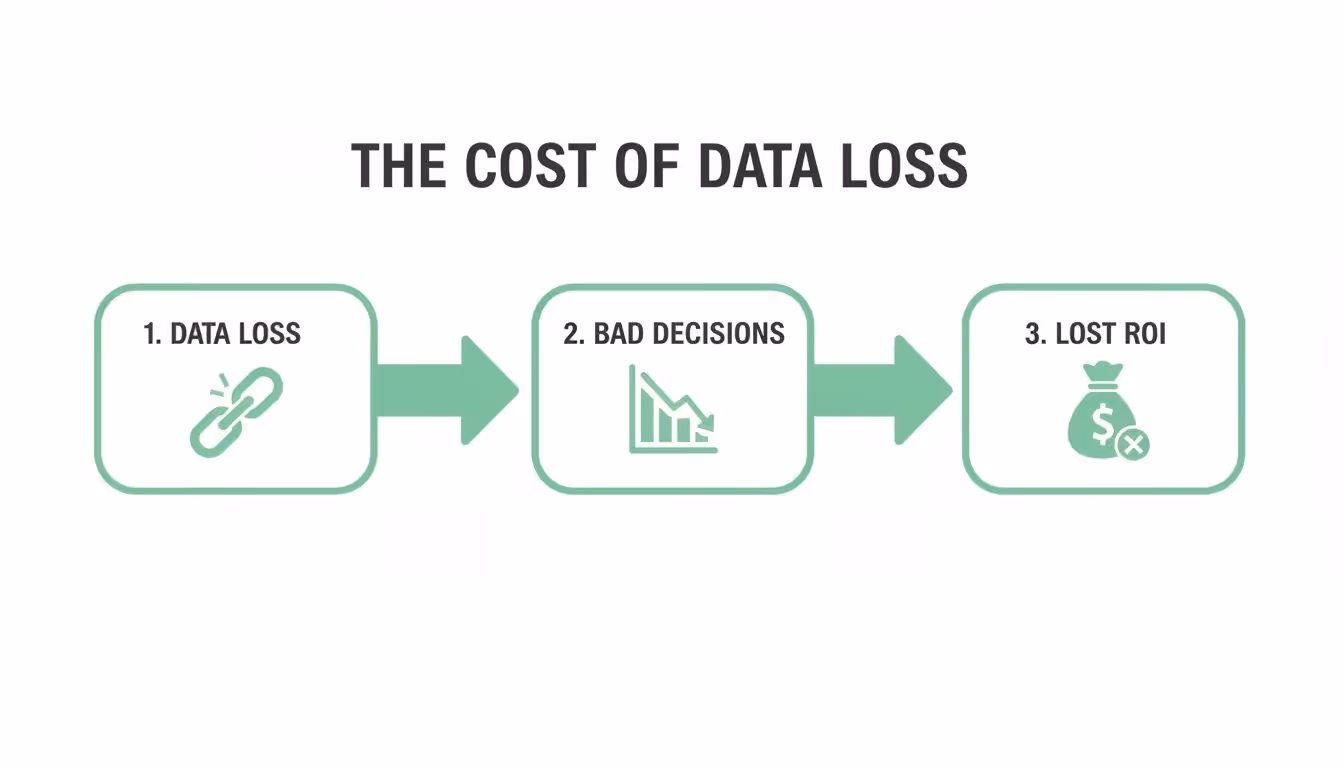
As you can see, a single data loss event can create a domino effect, leading to flawed decisions and, ultimately, hitting your financial returns.
Embrace Automated Observability
The real game-changer in a modern prevention framework is automated observability. Manual audits and periodic QA checks are simply too slow to catch issues in today's fast-paced development cycles. An observability platform continuously scans your entire analytics setup—from the dataLayer on your website all the way to third-party destinations like Google Analytics or Mixpanel.
Here’s what automated observability brings to the table:
- Real-time Anomaly Detection: It instantly flags sudden drops or spikes in event volume that could signal a broken implementation.
- Schema Validation: It automatically checks if the data being sent actually matches the structure defined in your tracking plan, catching issues like missing properties or incorrect data types on the fly.
- PII Leak Detection: These systems can identify and alert you if personally identifiable information (PII) is accidentally being sent to your analytics tools, helping you sidestep serious compliance breaches.
This approach transforms data loss prevention from a manual, tedious chore into an automated, always-on safety net. It's no wonder the data loss prevention (DLP) market reached USD 3.1 billion and is projected to hit USD 13.8 billion by 2034. Regulations and the sheer volume of cyberattacks are driving this growth. Considering that over 12,000 breaches exposed billions of records in a single recent year, investing in DLP is no longer optional.
Finally, a complete framework goes beyond just your digital measures. It also has to include the secure end-of-life management of the physical assets where data is stored. For a full breakdown of those processes, check out this definitive guide to IT asset destruction.
Securing Your Most Vulnerable Data Points

Analytics data doesn't just disappear. It breaks at specific, predictable weak spots in your tech stack. If you want to stop data loss, you first have to pinpoint where your data streams are most fragile. These vulnerabilities are often hiding in plain sight, causing silent data leaks that slowly poison your reports and lead to bad business decisions.
Instead of a scattershot approach, focus on these common failure points. This lets you apply surgical tactics to secure the client-side, server-side, and third-party tools that make up your analytics world. It’s all about being proactive, not just putting out fires.
Client-Side Tracking Breakdowns
The most common place for data loss is right on the user's device—the client-side. Your website or mobile app is a chaotic environment where your perfectly planned tracking can get derailed by things you don't directly control.
Buggy code releases are a classic culprit. A developer pushes an update that changes a button's class name or messes with the dataLayer structure, and poof—an event your marketing team depends on is broken. The site still looks fine, so these bugs can go unnoticed for weeks, quietly wrecking your attribution models.
Then you have the external forces to deal with:
- Ad-Blockers and Browser Privacy: More and more users have ad-blockers or browsers with beefed-up privacy settings that stop analytics scripts from even loading. This creates massive blind spots, especially for tracking user acquisition.
- Misconfigured Consent Platforms: GDPR and other regulations mean you need a consent management platform (CMP). If it’s not set up right, it might block tracking tags even for users who did give consent, leading to underreported traffic and conversions.
The client-side is a constant battleground for data integrity. A single bad deployment or a misconfigured third-party script can invalidate weeks of campaign data, making it the number one area to fortify in your data loss prevention efforts.
Server-Side Data Integrity Challenges
Moving your tracking server-side is a great move for data quality. It helps you get around client-side problems like ad-blockers. But it also opens up its own can of worms you need to be ready for. Server-side data loss is usually less about big volumes of missing data and more about the quiet corruption of critical data points during processing.
A major headache is maintaining data integrity in API calls. Your server-side endpoint gets data from your app, adds more info to it, and then passes it along to your analytics tools. If the payload sent from the client is messed up—say, a user_id is sent as a number instead of a string—the server might fail to process it or just drop it completely.
The data processing pipelines themselves are another failure point. A bug in your enrichment logic could accidentally strip out crucial UTM parameters or miscalculate the revenue for a transaction. For a deeper look at this, our guide on server-side tagging for data accuracy and compliance has some really practical advice.
These server-side errors are especially sneaky because they happen silently. Your client-side setup could be flawless, but the data that lands in Google Analytics or Amplitude is still wrong.
Third-Party Integration Failures
Your analytics stack isn't a silo; it's a web of interconnected third-party tools, and each one is a potential point of failure. Every marketing pixel, attribution platform, and CRM integration you add increases your data's risk surface. Data loss here usually shows up as attribution errors or campaign performance black holes.
A broken marketing pixel is a textbook example. Let's say your team launches a huge TikTok campaign, but there's a typo in the pixel implementation. Traffic will still hit your site, but none of the conversions will be tied back to the campaign. The result? Your data will show the campaign was a total flop, leading to terrible decisions about where to spend your ad budget next.
Another chronic issue is inconsistent campaign tagging. Messy UTM parameters are a nightmare. If one person on your team uses utm_source=facebook and another uses utm_source=Facebook, your analytics tool sees them as two different sources. This fragments your reports and makes it impossible to get a clear view of channel performance.
To help visualize where things can go wrong and what to do about it, here’s a quick breakdown of common scenarios.
Common Data Loss Scenarios and Prevention Strategies
Data Loss ScenarioPotential Business ImpactPrimary Prevention StrategyNew code breaks a dataLayer eventLost conversion tracking, inaccurate feature adoption metrics.Implement automated tracking validation in your CI/CD pipeline.Ad-blocker blocks the analytics scriptUnderreporting of traffic and new user acquisition by 10-30%.Use server-side tagging to move tracking logic off the client.Malformed API payload sent to serverCritical user or event properties are dropped, leading to incomplete data.Enforce a strict data schema (e.g., using JSON Schema) and set up server-side monitoring.Broken marketing pixel on a landing pageInability to attribute conversions to paid campaigns, wasted ad spend.Use an observability tool to continuously monitor third-party pixel health.Inconsistent UTM parameter casingFragmented channel reports, inability to accurately measure campaign ROI.Establish a clear data governance policy and use URL builders to enforce it.
Securing these third-party connections demands a mix of strict governance on tagging rules and automated monitoring to make sure pixels are firing correctly on all key pages and user actions.
Without this oversight, you're just hoping that dozens of external scripts will play nice on your site—and that's a risky bet. By tackling each of these vulnerable spots—client-side, server-side, and third-party—you build a resilient defense that actively prevents data loss across your entire stack.
Why Automated Monitoring Is Your Best Defense

Trying to prevent data loss with manual audits and periodic QA checks is like trying to catch raindrops in a hurricane. It just doesn't work. Modern development moves way too fast.
By the time your team gets around to its quarterly audit, bad data has likely already poisoned your reports, skewed your decisions, and burned through your budget. Manual processes are always playing catch-up, finding problems long after the damage is done.
The only way to get ahead of the chaos is to ditch the spot-checks and embrace an automated, always-on monitoring system.
The Limits of a Manual Approach
A manual approach to data quality fundamentally misunderstands the speed at which things break. A single code deployment can silently kill a critical tracking event. An A/B test might launch with busted analytics tags. These aren't just hypotheticals—they happen all the time.
Expecting an analyst to manually verify every single event and property after each release is completely unrealistic. It’s a surefire way to create a bottleneck and turn the data team into the "no" police instead of a strategic partner. This friction means corners get cut and small errors slip through, slowly eroding the foundation of your data until it's completely unreliable.
The core failure of manual QA is that it operates on a human timescale, while your digital product operates on a machine timescale. You cannot effectively police a system that changes hundreds of times a month with a process that runs once a quarter.
How Automated Observability Works
This is where automated observability tools completely change the game. Instead of a human ticking boxes on a checklist, these platforms automatically map and monitor your entire analytics ecosystem in real time.
They discover your tracking implementation as it exists right now, not based on some outdated tracking plan sitting in a forgotten spreadsheet.
This automated discovery process creates a living blueprint of your data flow. It sees every event, every property, and every destination—from the dataLayer on your site to the final payload that hits Google Analytics or Amplitude. With this map in place, the system can instantly spot any deviation from the norm.
For example, if a new deployment causes the product_price property to suddenly start sending a string instead of a number, an automated system flags it immediately. No more waiting a week for an analyst to notice the revenue reports look weird. The issue is caught at the source, the moment it happens.
Non-Negotiable Real-Time Alerts
Good automated monitoring isn’t about drowning you in notifications. It’s about delivering high-signal alerts that help your teams act fast. For any serious data loss prevention strategy, certain alerts are simply non-negotiable.
Here are the critical alerts you need to have in place:
- Traffic Anomalies: Get notified instantly about sudden, unexplained drops or spikes in event volume. A 50% drop in
add_to_cartevents right after a release is a massive red flag that demands immediate attention. - Schema Validation Failures: Alerts for any deviation from your expected data structure. This catches everything from missing properties and incorrect data types (like
user_idbeing null) to rogue events that were never part of your plan. - PII Detection: Automated scanning that flags when personally identifiable information—like emails or names—is accidentally being sent to your analytics tools. This is a lifesaver for preventing serious privacy violations.
- Campaign Tagging Errors: Notifications for broken or non-compliant UTM parameters that corrupt your marketing attribution before the data even lands.
These aren't just entries in a log file. When you route these alerts directly into tools like Slack or Microsoft Teams, you embed data quality right into your team's existing workflow. An engineer gets a ping with the exact event, the specific error, and the context needed to fix it.
This approach transforms the fix time from weeks of digging to minutes of work. If you want to learn more about surfacing these problems, you have to detect silent tracking errors before they snowball. This is how you stop chasing data fires and start building a culture of data reliability.
Creating Your Analytics Incident Response Plan
Even with the best prevention strategies in place, data incidents aren't a matter of if, but when. A tiny coding error or a misconfigured third-party tag can always slip through the cracks. How you respond in those first few hours is what separates a minor hiccup from a full-blown crisis of confidence in your data.
A well-documented analytics incident response plan is your playbook for these moments. It’s designed to cut through the panic and guesswork, replacing it with clear, decisive action.
Without one, teams scramble, stakeholders are left in the dark, and the business impact of data loss snowballs with every passing minute. This isn't about finger-pointing; it's about having a rock-solid process that protects your data integrity and the critical business decisions that depend on it.
Defining Clear Roles and Responsibilities
When an alert goes off, the first question is always, "Who's on this?" Your response plan needs to answer that question instantly. Any ambiguity leads to chaos, with critical tasks falling through the cracks while everyone assumes someone else is handling it.
Start by assigning specific roles. You need a designated Incident Commander—this is usually a lead analyst or a data product manager who owns the incident from detection all the way to resolution. This person doesn't necessarily have to be the one fixing the code, but they are absolutely the one coordinating the entire response.
Next, get your key responders identified:
- Technical Lead: The developer or engineer who will dig into the root cause and push the fix.
- Communications Lead: The point person for keeping stakeholders (like marketing or product teams) updated on the status and business impact.
- Data Analyst: The expert responsible for figuring out the scope of the data loss and validating everything once a fix is live.
With these roles clearly defined, everyone knows their part. The moment an incident is declared, the Incident Commander can pull the right people into a dedicated Slack channel or call, kicking off a coordinated and efficient response.
Establishing Your Triage and Recovery Process
Not all data incidents are created equal. A missing UTM parameter on a deep-cut blog post isn't nearly as urgent as the purchase event failing for all your iOS users. This is exactly why you need a triage process to quickly size up the business impact.
When an incident gets flagged, your team should immediately run through a few key questions:
- What user actions or business metrics are affected? (e.g., revenue tracking, new user sign-ups)
- What percentage of users or traffic is impacted? (e.g., only one browser, all mobile users)
- Are there any compliance or PII risks involved?
Based on the answers, you can classify the incident (think: Critical, High, Medium, Low) and trigger the right protocol. For recovery, make sure you're properly annotating reports in tools like Google Analytics. This creates a transparent record, letting stakeholders know which time periods were affected by bad data so they don't make decisions based on flawed numbers. In the worst-case scenario of a major breach, your plan should also cover strategies for how to regain trust after a data breach.
The goal of triage isn't just about prioritization; it's about communicating business impact. Telling a stakeholder 'the purchase event is broken' is one thing. Telling them 'we cannot accurately report on 30% of our daily revenue until this is fixed' creates the urgency needed to get it solved—fast.
Conducting a Blameless Post-Mortem
Once the dust has settled and clean data is flowing again, the most critical step is the post-mortem. The whole point of this meeting is not to point fingers but to understand exactly what happened, why it happened, and how you're going to stop it from happening again.
The Incident Commander should lead this session, walking through the timeline of events, the root cause, the business impact, and how effective the response was. The outcome must be a list of concrete action items. Maybe you need a new automated alert, an update to your deployment checklist, or better documentation for a specific tracking event.
This continuous learning loop is what truly strengthens your prevention strategy over time. Each incident, when handled correctly, is a valuable lesson that fortifies your entire analytics ecosystem against future failures.
Frequently Asked Questions About Data Loss
When you're in the trenches trying to prevent data loss, a lot of specific questions pop up. Getting clear, straightforward answers is the key to building a strategy that actually works. This section cuts through the noise and tackles some of the most common questions we hear from marketing, analytics, and engineering teams.
We're here to give you practical takeaways that reinforce the core principles of a strong data loss prevention framework.
What Is the Most Frequent Cause of Marketing Analytics Data Loss?
It’s almost never a dramatic server crash or some sophisticated attack. The real culprit is much quieter: small, seemingly harmless errors that sneak in during routine development cycles. A buggy code release is the number one cause, hands down.
A developer might unknowingly change a CSS class, alter a dataLayer structure, or even just introduce a typo in an event name. These tiny changes can silently break tracking for critical user actions, like purchases or sign-ups. Because the website or app still looks and feels perfectly fine to the user, these issues often go unnoticed for weeks, slowly poisoning your analytics and attribution models.
How Do I Justify Investing In a Data Observability Tool?
The key is to stop talking about it as a "cost" and start framing it as a "cost-saver." You have to quantify the real business impact of bad data. Without an observability tool, you're essentially flying blind, and the hidden costs are piling up.
When you build the business case, focus on these three points:
- Wasted Ad Spend: Show how a single broken pixel could make a successful $50,000 campaign look like a total failure, causing teams to pull the plug on a profitable channel.
- Saved Engineering Hours: Do a back-of-the-napkin calculation of the time your developers and analysts spend manually digging through code to find data discrepancies. Automated tools can slash this diagnostic time from weeks down to minutes.
- Increased Decision Confidence: This one is huge. Reliable data leads to smarter, faster business decisions. The investment is really about protecting the integrity of the very insights that are supposed to drive growth.
Think of it this way: an observability tool isn't just an insurance policy. It’s a direct investment in the accuracy of your revenue-generating decisions. It easily pays for itself by preventing just one major misstep based on flawed data.
Does Data Loss Prevention Differ Between Web and Mobile Apps?
Absolutely. The core principles—like monitoring and validation—are the same, but the specific weak points are totally different.
On the web, you’re often battling a chaotic environment full of external factors. Things like ad-blockers, ever-changing browser privacy settings (like ITP), and poorly configured consent management platforms can all block your tracking scripts from ever firing.
For mobile apps, the challenges are more self-contained within the app's ecosystem. Here, data loss is frequently caused by buggy app updates, problems with third-party SDK integrations, and inconsistent offline tracking. If a user loses their internet connection mid-session, for instance, events can be dropped forever if the app doesn't handle that scenario correctly. Your prevention strategy has to account for these platform-specific failure points.
Is It Possible to Recover Data That Was Never Collected?
Unfortunately, no. This is the hard truth of analytics. If your tracking was broken and an event was never sent to your servers, that data is gone for good. You can't retroactively invent information that was never captured in the first place.
This is exactly why prevention is everything. The goal isn't recovery; it's ensuring the data is collected correctly the first time, every time. The best you can do after a data loss incident is fix the tracking, add an annotation to your reports to mark the "bad data" period, and maybe use some statistical modeling to estimate the gap. But let's be honest—that's always a messy, less-than-ideal workaround.
Stop flying blind and start trusting your data. Trackingplan gives you complete visibility into your analytics and marketing data, automatically detecting errors before they cost you money. See how our automated observability platform can help you prevent data loss and make decisions with confidence. Learn more at Trackingplan.


.avif)