

Unlock the true power of analytics in advertising. This guide demystifies KPIs, attribution, and data quality to help you drive real campaign growth and ROI.
Trying to run an advertising campaign without analytics is like sailing across the ocean without a compass. You're spending money and you feel like you're moving, but you have no real direction or proof that you're actually heading toward your destination.
Put simply, analytics in advertising is the process of using data to turn guesswork into strategy, making sure every dollar you spend is pulling its weight.
Why Analytics Is Your Campaign Compass

At its core, advertising analytics isn't some complex, technical chore—it's the essential navigation system for every modern marketer. It’s the practice of collecting, measuring, and analyzing advertising data to really understand campaign performance and make the next one even better. This goes far beyond just counting clicks; it's about seeing the entire customer journey.
Think of it this way: without analytics, your ad budget is basically a bet. You launch a campaign hoping it connects with people, but you have no concrete way of knowing what’s working, what isn’t, and—most importantly—why. That approach isn't just inefficient; it's incredibly expensive.
Turning Numbers into Actionable Insights
Effective analytics in advertising cuts through the noise and gives you the clarity to make smart decisions. It helps you answer the big business questions that directly impact your bottom line.
By putting a solid analytics framework in place, your team can:
- Understand Customer Behavior: Discover which ad creatives, messages, and channels truly resonate with your target audience.
- Measure True Performance: Go beyond vanity metrics to see which campaigns are actually driving conversions and revenue.
- Justify Ad Spend: Provide clear, data-backed evidence to stakeholders showing the return on investment (ROI) for your advertising efforts.
- Prevent Costly Mistakes: Spot underperforming campaigns early and shift your budget to strategies that are proven to deliver results.
Analytics transforms marketing from an art based on intuition to a science grounded in evidence. It allows you to systematically test, learn, and improve, ensuring that each campaign is more successful than the last.
The Growing Need for Data Integrity
The market trends tell the same story. The global digital advertising market was valued at USD 569.3 million in 2024 and is projected to skyrocket to USD 3,341.1 million by 2035, an explosion fueled by analytics-driven personalization.
But this growth brings a critical challenge: data quality. Without robust QA, up to 30-40% of tracking pixels can fail because of implementation errors or consent issues. That leads to massive data loss and campaigns guided by bad information. You can explore more about these market projections and see why data accuracy is more critical than ever.
Ultimately, embracing analytics means you're no longer just spending money on ads. You're making strategic investments, guided by a reliable compass that points directly toward growth and profitability. This foundation is crucial before we dive into the specific metrics and models that bring this strategy to life.
Separating Actionable KPIs from Vanity Metrics
Diving into analytics in advertising can feel like trying to drink from a firehose. You’re hit with a flood of data, and it’s way too easy to get lost in a sea of numbers, charts, and acronyms. The real challenge isn’t just grabbing all that data; it’s figuring out which numbers actually matter for the business versus which ones just look good on a slide.
This brings us to the critical difference between vanity metrics and actionable KPIs. Vanity metrics, like impressions or social media likes, are surface-level numbers that look impressive but don't really connect to revenue or your actual goals. They tell you people saw your ad, but not if they cared enough to take the next step.
Moving Beyond Surface-Level Data
Actionable KPIs, on the other hand, are the metrics that tell a story. They connect the dots between your advertising activity and real business outcomes, showing you the true impact of your campaigns. These are the numbers that deserve a front-row seat on your main performance dashboard.
The most useful actionable KPIs usually fall into three buckets:
- Acquisition Metrics: These show you how well you’re pulling in new customers. Think Cost Per Acquisition (CPA) or Customer Acquisition Cost (CAC)—they tell you exactly how much you’re spending to bring a single paying customer through the door.
- Engagement Metrics: These tell you what people do after that first click. Numbers like Time on Page, Bounce Rate, or Event Completions (like a newsletter signup) reveal whether your ads are attracting a genuinely interested audience.
- Revenue Metrics: This is where the rubber meets the road. Return on Ad Spend (ROAS) and Customer Lifetime Value (LTV) are the ultimate proof of profitability, showing whether your ad budget is actually making you money over the long haul.
To really get a handle on your campaign’s effectiveness and stop chasing shiny objects, it’s vital to learn How to Measure Marketing Performance and Prove Its Value. This helps you draw a straight line from clicks to actual business growth.
It's easy to get distracted by metrics that feel good to report but don't actually move the needle. The key is focusing on numbers that provide a clear path to action and demonstrate real business impact.
Focusing on the right-hand column is what separates reporting on activity from driving strategic growth. Actionable metrics give you the levers you need to pull to improve performance.
The Problem with Chasing Vanity Metrics
Going all-in on vanity metrics isn't just a distraction; it can be dangerously misleading. A campaign might rack up a million impressions, but if it doesn’t produce a single qualified lead or sale, it's just an expensive ego boost. Similarly, chasing high click-through rates (CTR) without looking at the quality of that traffic is a great way to burn through your budget with nothing to show for it.
A dashboard filled with vanity metrics is like a car’s speedometer that only shows how fast the wheels are spinning, not how far you’ve actually traveled. Actionable KPIs are the odometer and the fuel gauge—they tell you the real story of your journey and how much further you can go.
For example, studies show that retargeting ads are 76% more likely to get clicks than standard display ads. That sounds fantastic on its own. But their real power is in converting users who are already familiar with your brand. That effectiveness gets completely torpedoed when broken pixels or tagging errors—which plague 20-30% of implementations—feed bad data into your analytics tools.
As the U.S. digital ad market barrels toward USD 220 billion by 2030, the cost of making decisions based on flawed, superficial data becomes astronomical. Find out more about the digital advertising market in the United States.
Building a Dashboard That Reflects Business Impact
A truly effective advertising analytics dashboard should tell a clear story, connecting every stage of the customer journey. It needs to show how your ad spend is influencing user behavior and, most importantly, driving revenue.
Start by defining your primary business goal. Is it generating leads? Driving e-commerce sales? Increasing app installs? Once that's crystal clear, you can build a hierarchy of metrics that ladder up to it. Your dashboard should visualize the flow from acquisition (CPC, CTR) to engagement (conversion rate) and all the way to revenue (ROAS, CPA).
This approach shifts your team's focus from just reporting on campaign activity to analyzing genuine business impact. It gives them the confidence to make smarter decisions, optimize campaigns for profit, and prove the undeniable value of their advertising efforts to the entire company.
Demystifying Ad Attribution Models
Imagine giving all the credit for a sale to the very last ad a customer clicked. That’s like handing the championship trophy only to the player who scored the final point, completely ignoring the assists, passes, and defensive plays that set up the win. In the world of analytics in advertising, we solve this problem of assigning credit with something called attribution modeling.
An attribution model is really just a set of rules that decides how credit for sales and conversions gets divvied up among the different touchpoints in a customer's journey. Getting this right is a huge deal—it directly shapes how you value your channels and, ultimately, where you put your money.
The Basic Single-Touch Models
The simplest way to approach this is with single-touch models. These give 100% of the credit to a single interaction. They’re super easy to set up, but they often paint a skewed picture of what’s actually happening.
There are two main flavors:
- First-Touch Attribution: This model gives all the glory to the very first ad or channel that introduced a customer to your brand. It’s great for figuring out which campaigns are best at sparking that initial awareness.
- Last-Touch Attribution: On the flip side, this model assigns all the credit to the final touchpoint right before a conversion. It tells you which channels are closers, but it ignores everything that warmed the customer up.
While these models are straightforward, they just don't capture the messy, complex reality of modern customer journeys, where people bounce between multiple ads and platforms before deciding to buy.
Exploring Multi-Touch Attribution Models
This is where multi-touch models come in. They offer a more balanced perspective by spreading the credit across several touchpoints, acknowledging that it often takes a team effort to land a conversion.
Here are the most common multi-touch models you’ll run into:
- Linear Attribution: The most democratic of the bunch, this model splits credit equally among every single touchpoint. If a customer saw a social ad, clicked a search ad, and then opened an email before buying, each one gets 33.3% of the credit.
- Time-Decay Attribution: This model is all about timing. It gives more credit to touchpoints that happened closer to the conversion. That first ad a customer saw weeks ago gets a little nod, but the retargeting ad they clicked yesterday gets the lion’s share.
- Position-Based (U-Shaped) Attribution: Think of this as the "opener and closer" model. It gives 40% of the credit to the first touchpoint, 40% to the last, and sprinkles the remaining 20% across all the interactions in between. It values both the initial discovery and the final push.
A huge part of understanding campaign performance is figuring out which touchpoints actually deserve credit. Exploring What Is Attribution Modeling helps clarify how these different frameworks provide unique lenses for viewing your data. For a deeper look at how these models work in a tool you're probably already using, check out our complete guide to channel attribution in GA4.
Choosing an attribution model isn't just a technical task; it's a strategic one. A B2B company with a long, considered sales cycle might lean towards a Time-Decay model. In contrast, a startup focused on rapid growth might stick with a First-Touch model to reward their top-of-funnel channels.
The decision tree below can help you think through whether a metric—which is heavily influenced by your chosen model—is actually driving decisions or is just a vanity number.
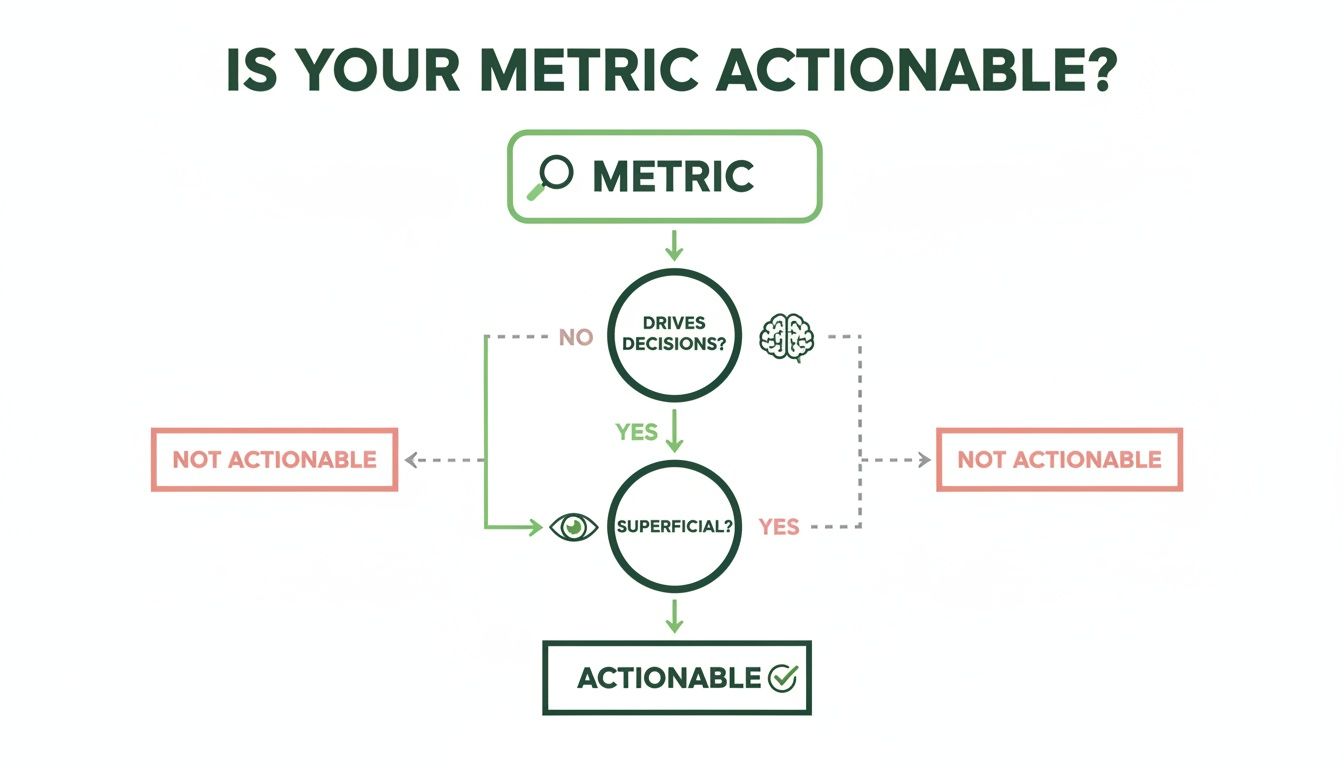
This really brings it home: the point of any measurement, attribution included, is to find insights that lead to smarter actions and better strategies.
The Rise of Data-Driven Attribution
The most sophisticated approach today is data-driven attribution. It uses machine learning to sift through all your converting and non-converting paths, creating a custom model based on your actual data. It assigns credit by calculating how much each touchpoint really contributed to the conversion, making it the most accurate—and most complex—model out there.
And this level of precision is becoming non-negotiable. The programmatic advertising ecosystem, which is projected to surpass $150 billion in global spending by 2025, is built entirely on accurate user data for targeting and attribution. While programmatic ads can boost targeting by up to 50%, that edge vanishes if the analytics tracking is broken. A single missing event could cause a conversion to be misattributed or lost entirely, throwing your whole strategy off course.
As privacy changes continue to shake things up, the demand for precise, reliable attribution is only going to intensify.
The Hidden Threats to Your Campaign Data

Here’s a hard truth: your advertising strategy is only as good as the data it’s built on. You can have the perfect attribution model and a dashboard full of beautiful, actionable KPIs, but if the underlying data is broken, your decisions are basically guesses. Unfortunately, the world of analytics in advertising is riddled with landmines that can poison your data pipeline without you ever knowing it.
These aren't just abstract technical problems; they are business crises hiding in plain sight. They lead directly to wasted ad spend, flawed strategies, and a total loss of trust in the very numbers meant to guide you. When data quality erodes, your campaign compass just spins wildly, pointing you in all the wrong directions.
The Silent Killers of Data Quality
A few common culprits are responsible for the vast majority of data integrity issues. Ignoring them is like building a skyscraper on a cracked foundation—it’s only a matter of time before everything comes crashing down.
These issues often happen behind the scenes, making them impossible to spot with the naked eye until the damage is already done and showing up in your performance reports.
Keep an eye out for these key threats:
- Broken Tracking Pixels: A marketing pixel is just a tiny snippet of code that fires when a user takes an action, like viewing a page or adding an item to their cart. If this pixel breaks after a site update or a simple human error, that event never gets recorded. The result? A massive blind spot in your customer journey data.
- Inconsistent UTM Tagging: UTM parameters are the little tags you add to URLs to track campaign sources, mediums, and names. But when your team uses inconsistent conventions—like
utm_source=Facebookon one ad andutm_source=facebookon another—your analytics platform sees them as two completely separate channels. This fractures your data, making it impossible to get a clear picture of performance. - Consent Management Errors: With privacy regulations getting stricter, consent management platforms (CMPs) are non-negotiable. A misconfiguration, however, can cause tracking scripts to be blocked even for users who did give consent, leading to huge data gaps. Understanding the relationship between cookies and marketing analytics is absolutely critical here.
How a Simple Mistake Creates a Crisis
Let’s walk through a real-world scenario of how a tiny error can snowball into chaos. Imagine your marketing team launches a major new campaign on LinkedIn. They’ve spent weeks crafting the perfect ad and are shelling out thousands of dollars a day to drive traffic to a shiny new landing page.
But in the rush to go live, they forget to add the proper UTM tags to the campaign's URL.
Every single user who clicks that ad now arrives at your site as a ghost. Your analytics platform has no idea where they came from, so it defaults to lumping them all into 'Direct' traffic.
Suddenly, your reports show a massive, unexplained spike in 'Direct' traffic and zero visitors from your expensive LinkedIn campaign. The campaign looks like a total failure, your ROAS is tanking, and you're left scratching your head. This isn't a glitch; it's a data disaster caused by one missing tag.
This is exactly where analytics monitoring tools can save the day. They can detect these kinds of traffic anomalies in real time, alerting you to the problem before it corrupts your entire dataset.
Without a system like that in place, the marketing team might prematurely kill a campaign that was actually performing brilliantly, torching both the initial ad spend and all the potential revenue.
The Domino Effect of Bad Data
That single tagging mistake triggers a disastrous domino effect across the whole organization. The marketing team loses faith in their own campaigns. The analytics team starts questioning the reliability of their tools. And pretty soon, leadership is doubting the validity of the entire advertising strategy.
This erosion of trust is often far more damaging than the wasted money. When stakeholders can no longer rely on the data, decision-making grinds to a halt and gets replaced by guesswork and internal arguments.
The bottom line is clear: maintaining high-quality data isn't a passive activity. It requires a proactive, vigilant approach to sniff out and neutralize these hidden threats before they can undermine your entire advertising operation. Without a solid foundation of trustworthy data, even the most brilliant strategies are doomed to fail.
Building a Bulletproof Analytics Foundation

After seeing how easily hidden issues can derail even the best-laid campaign plans, it’s obvious that a passive approach to data quality just doesn’t cut it anymore. Your analytics in advertising can't be an afterthought. It needs a resilient, proactive defense system built from the ground up.
The old way of doing things—running periodic, manual audits—is simply too slow for today's digital pace.
Those manual checks are like taking a single snapshot of a moving train. By the time you develop the film and analyze the picture, the train is miles down the track, and your information is already obsolete. A new website deployment, an update to a third-party tool, or a simple marketing typo can break your tracking moments after an audit is complete, leaving you completely blind until the next one rolls around.
The Shift to Proactive Monitoring
The only real solution is a fundamental mindset shift: from periodic checks to continuous, automated oversight. This modern approach is best described as analytics observability and automated QA. Think of it less like a scheduled inspection and more like a real-time immune system for your entire data pipeline.
Instead of hunting for problems long after they’ve already poisoned your reports, this system constantly monitors every single piece of data as it comes in. It scans for anomalies, validates event structures, and cross-references campaign tagging against predefined rules—all happening automatically, 24/7.
This continuous validation transforms data integrity from a reactive chore into a proactive state of confidence. It ensures the data flowing into your dashboards is clean, accurate, and trustworthy, freeing up your teams to focus on strategy instead of constant firefighting.
This level of vigilance empowers everyone. Marketers can launch campaigns knowing their data is solid. Analysts can deliver insights based on a foundation of truth. And developers can pinpoint and squash bugs before they ever have a chance to impact critical business decisions.
How Automated QA Works
Picture an automated QA platform as a security guard who never sleeps, specifically trained to watch over your analytics implementation. It first learns what your tracking is supposed to look like—your "tracking plan"—and then validates every single event against that blueprint in real time.
This automated process provides several layers of protection:
- Real-Time Anomaly Detection: It instantly flags unusual spikes or drops in traffic and event volume, which are often the first signs of broken tracking or implementation errors.
- Schema Validation: It ensures every event and its properties (like
product_priceoruser_id) match the expected format. No more corrupted data from schema mismatches. - Campaign Tagging Enforcement: It automatically checks all incoming UTM parameters against your established conventions, instantly catching inconsistent or missing tags that would otherwise throw off your attribution.
- Pixel & Tag Monitoring: The system continuously verifies that all essential marketing and analytics pixels are present and firing correctly across your entire website and all your apps.
This automated safety net catches problems the second they happen and sends instant alerts to the right teams. For example, if a developer accidentally removes a critical add_to_cart event during a site update, the system flags it immediately. The issue can be resolved in minutes, not weeks, preventing the loss of crucial conversion data.
Building a system like this requires a disciplined approach. You can get a head start by exploring the essential data quality best practices that form the bedrock of any reliable analytics setup.
The Business Impact of Trusted Data
Adopting an analytics observability and automated QA strategy does more than just clean up your data; it builds a foundation of trust that ripples across the entire organization. When teams can actually rely on the numbers in their dashboards, they make better, faster, and more profitable decisions.
Marketers can optimize ad spend with confidence. Analysts can stop wasting countless hours on manual data validation. And developers get clear, actionable bug reports that slash their resolution time.
Ultimately, this bulletproof foundation ensures your advertising engine is always running on the high-octane fuel of accurate, reliable data, powering sustainable growth and maximizing your return on investment.
A Unified Playbook for Marketers, Analysts, and Developers
Getting trustworthy data isn't one person's job—it’s a team sport. To get analytics in advertising right, you need a coordinated effort where marketers, analysts, and developers are all reading from the same script. When these teams work in silos, you get friction, finger-pointing, and bad data that tanks your entire strategy.
A unified playbook gets everyone aligned on a single source of truth by setting clear responsibilities and workflows. This collaborative approach stops data management from being a chaotic free-for-all and turns it into a well-oiled machine. The goal isn’t just to create a set of rules but to build a culture of data quality where every decision is based on solid information.
The Marketer’s Role: Create Ironclad UTM Conventions
For marketers, the front line of data quality is campaign tagging. Let's be honest, inconsistent or missing UTM parameters are one of the biggest culprits behind attribution chaos. They’re the reason valuable paid traffic often gets dumped into the 'Direct' bucket, making your campaigns look far less effective than they actually are.
Fixing this starts with establishing strict UTM conventions. This isn't negotiable.
A solid UTM strategy hinges on a shared, easy-to-access document that spells out the exact structure for every parameter (source, medium, campaign, you name it). This single move eliminates guesswork and enforces consistency, no matter who on the team is launching a campaign.
- Create a Naming Convention Document: This becomes the go-to guide for anyone launching a campaign. No more making things up on the fly.
- Use a URL Builder: A standardized spreadsheet or tool for generating tagged links is a lifesaver. It dramatically cuts down on human error.
- Regularly Audit Your Tags: Every so often, take a look at your incoming campaign data. Spot and fix any tags that don't follow the rules before they pollute your reports for good.
The Analyst’s Role: Maintain the Central Tracking Plan
Analysts are the architects of your data structure. Their main job is to create and maintain a central tracking plan, which is the blueprint defining every single event, property, and user trait you need to collect. Think of this document as the ultimate guide to what data matters and how it should be structured.
A tracking plan is basically a contract between your teams. It tells developers exactly what to implement and shows marketers exactly what data is available for analysis. Everyone is working from the same script.
This can't be a "set it and forget it" document. It needs to be a living plan, updated whenever new features, campaigns, or business goals pop up. By owning this central repository, analysts make sure the data being collected actually answers the strategic questions the business is asking. This stops data bloat and keeps everyone focused on what truly matters.
The Developer’s Role: Ensure Seamless Implementation
Developers are the builders who bring that tracking plan to life. Their precision is absolutely critical—one tiny coding error can completely break tracking for a crucial user action. Their playbook is all about accurate implementation and constant, clear communication with the analytics team.
Here’s what best practices look like for developers:
- Stick to the Plan: Implement events and properties exactly as they’re laid out in the tracking plan. This prevents the schema mismatches that cause so many headaches down the line.
- Communicate Proactively: If you hit a technical limitation or see a change that might affect data collection, tell the analysts before you deploy. No surprises.
- Use Observability Tools: This is a game-changer. Automated QA platforms like Trackingplan can validate your implementation in a staging environment and monitor for errors after launch. It’s about catching issues before they ever touch your business data.
Common Questions About Analytics in Advertising
Even with a solid strategy, a few practical questions always pop up when you're in the trenches with analytics in advertising. Getting these sorted out helps everyone move forward with confidence and sidestep the simple mistakes that can quietly sabotage your hard work.
Let's clear up a few of the most common ones.
What Is the Difference Between Marketing Analytics and Advertising Analytics
It’s easy to use these terms interchangeably, but there's a crucial difference in scope. Think of marketing analytics as the 30,000-foot view of your entire relationship with your audience. It’s the whole picture—SEO, email nurturing, social media, content marketing, you name it.
Advertising analytics, on the other hand, is a specialized subset. It zooms in with a magnifying glass on one specific area: your paid campaigns. Its world revolves around metrics directly tied to ad spend, like ROAS, CPC, and the conversion rates generated by your ads. It's all about measuring the direct return on your advertising dollars.
How Often Should I Check My Advertising Analytics
The honest answer? It depends entirely on the campaign's intensity and budget.
For a high-stakes, fast-paced push—like a Black Friday sale or a major product launch—you'll want to be checking daily, if not multiple times a day. You need to be ready to pivot on a dime to fix issues or double down on what's working.
But for a slow-and-steady brand awareness campaign, a weekly check-in is probably plenty to keep an eye on the bigger trends without getting lost in daily noise.
The smartest approach is to let an automated monitoring tool do the heavy lifting. It acts as an always-on watchdog, flagging significant dips or spikes in real-time. This way, you can react when it actually matters, instead of wasting time manually refreshing dashboards just in case.
How Can We Fix Inconsistent Campaign Tagging
Inconsistent UTM tagging is a notorious data-killer, but it’s a problem you can solve for good. The fix requires a two-part strategy: one part process, one part technology.
First, you need a single source of truth. Create a clear, standardized UTM naming convention document that everyone on the team is required to follow. No exceptions. This eliminates the guesswork and creative interpretations that lead to messy data.
Second, back that process up with technology. An analytics QA tool can automatically scan every campaign link and validate its parameters against your established rules. The system flags any error the moment it’s made, so you can fix it before it pollutes your reports and throws off your performance analysis.
A proactive approach to data quality is the surest way to maximize your return on ad spend. Trackingplan provides the automated observability you need to trust your data, detect errors in real-time, and ensure your decisions are always based on a solid foundation. Learn how Trackingplan can protect your analytics.