The Top 12 Chrome Extensions for Adobe Analytics in 2026
Discover the 12 best Chrome extensions for Adobe Analytics. A curated list with key features, pros, cons, and use cases to enhance your analytics workflow.
David Pombar
Swiss army knife at Trackingplan
February 12, 2026
TL;DR
Adobe Analytics is a cornerstone for data-driven decision-making, but its immense power is only realized when the data it collects is accurate, complete, and reliable. Verifying and debugging analytics implementations directly in the browser is a critical, non-negotiable step in maintaining data integrity. This is precisely where specialized chrome extensions for adobe analytics become indispensable, serving as the analyst's and developer's first line of defense against faulty tracking.
This guide provides a comprehensive, curated list of the top 12 extensions designed to streamline your Adobe Analytics workflows. We will explore each tool in detail, covering everything from real-time beacon inspection and tag management to data layer validation. For each extension, you'll find direct installation links, key feature breakdowns, and practical use case scenarios to help you immediately apply them to your work.
While these manual tools are excellent for spot-checking and in-the-moment debugging, a truly robust data governance strategy requires a more holistic approach. We'll also touch on how integrating these browser-based tools with an automated observability platform like Trackingplan can create a complete end-to-end quality assurance system. This combination allows you to catch implementation errors during development and monitor your data in production, preventing issues before they corrupt your business intelligence.
1. Adobe Experience Platform Debugger
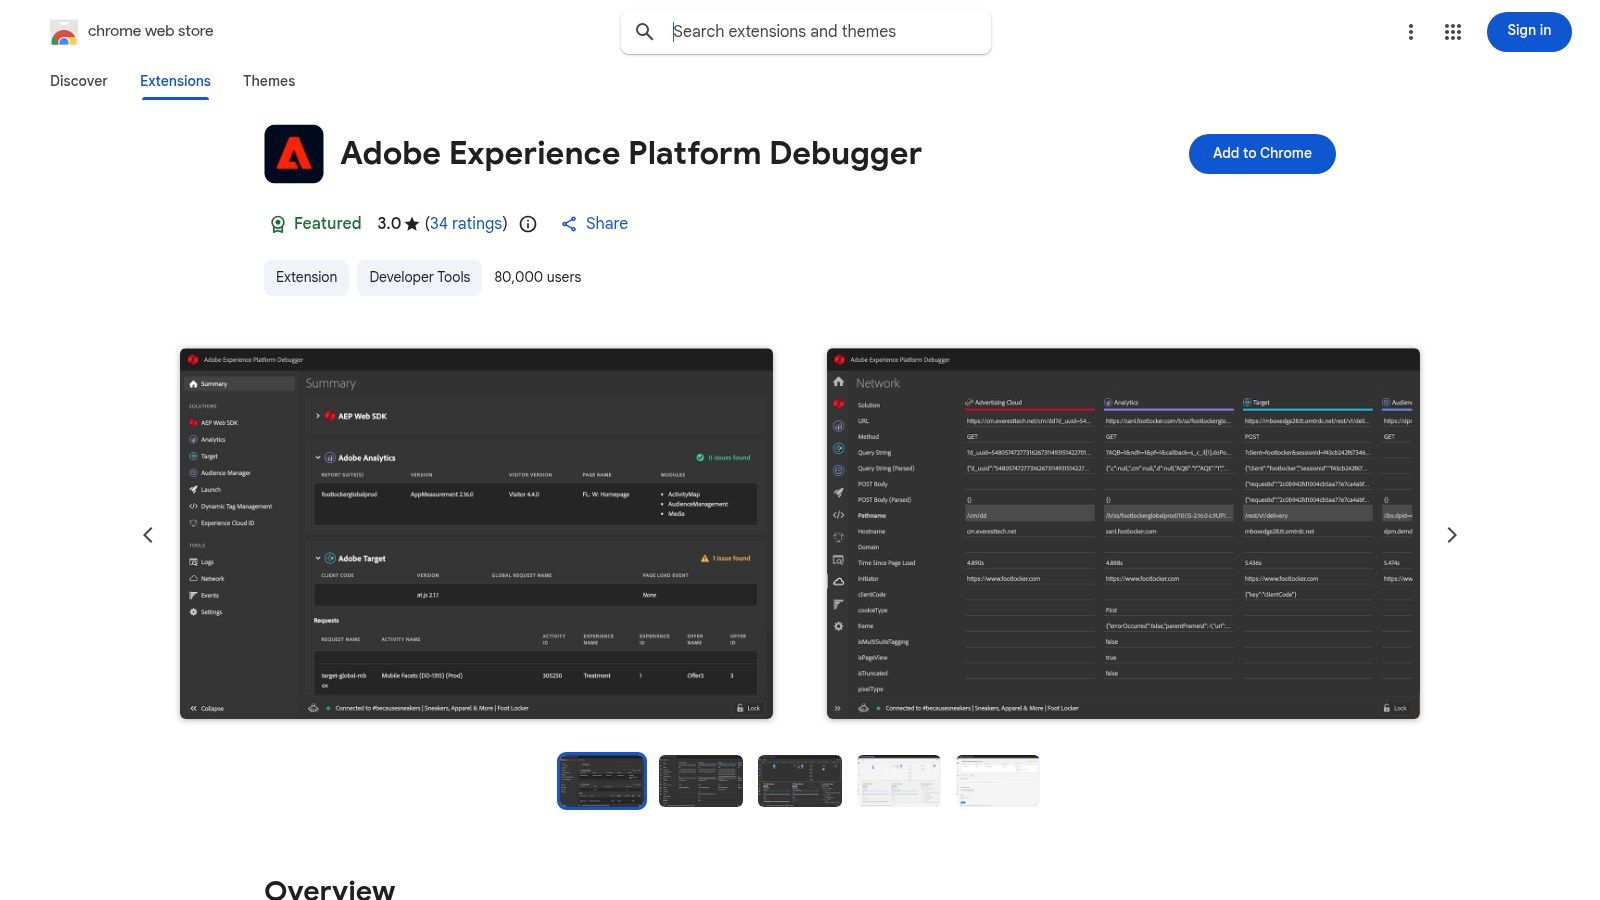
As Adobe’s official tool, the Experience Platform Debugger is the quintessential starting point for anyone working with Adobe Analytics. This extension provides unparalleled, direct insight into your Adobe implementation, covering everything from legacy AppMeasurement to the modern AEP Web SDK. It's the most authoritative resource for debugging your tracking setup directly within your browser.
Its primary strength lies in its ability to parse and present network requests in a clean, readable format. Instead of deciphering long query strings, you get a clear view of all eVars, props, and events. This makes it invaluable for verifying that your tagging aligns with your solution design reference (SDR) documentation. For developers, the ability to swap Launch library versions or inject custom code is a game-changer for staging and QA.
Core Features & Use Cases
Feature
Best Use Case
Network Call Parsing
Verifying that the correct variables (eVars, props, events) are firing on specific user interactions like button clicks or page loads.
Launch/Tags Environment Switching
Testing changes in a development or staging environment on the live production site without a code release.
AEP Web SDK Debugging
Inspecting XDM payloads to ensure data is structured correctly before being sent to the Adobe Experience Platform.
In-page Log and Console Messages
Gaining a real-time view of data layer pushes and rule triggers as you navigate and interact with the site.
Maintained by Adobe; always up-to-date with new features.
The interface can be complex for beginners.
Deep integration with Launch for environment switching.
Requires an active login to your Adobe Experience Cloud account.
Excellent support for the AEP Web SDK and XDM schemas.
Performance can occasionally be slow on data-heavy pages.
2. Adobe Experience League - Install Experience Platform Debugger
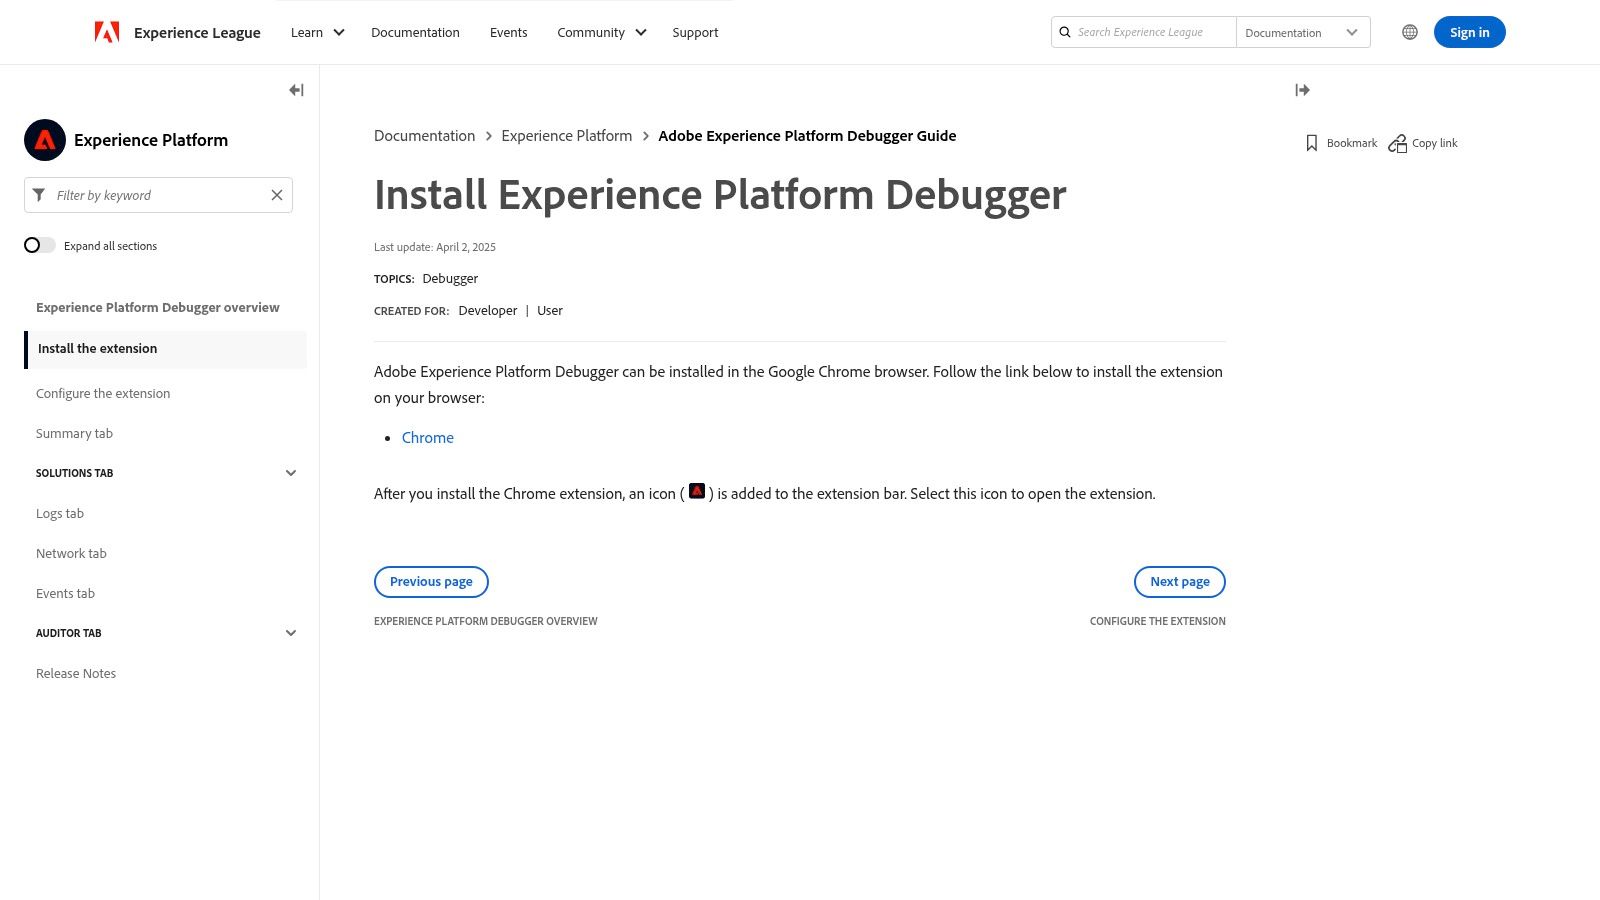
While not an extension itself, the official documentation on Adobe Experience League is a critical resource for any team using the Debugger. It serves as the canonical source of truth for installation, prerequisites, and version history. For large enterprises or agencies, this page is essential for establishing standardized operating procedures and ensuring every analyst and developer is using the correct, officially supported tool. It’s the foundational step before any debugging can begin.
This resource's value lies in its role in governance and training. When onboarding new team members, directing them to this official guide ensures they follow best practices from the start. It eliminates the risks associated with downloading outdated or unofficial versions from third-party sites. For any organization serious about data quality and process control, making this page part of the internal toolkit is a non-negotiable step. It ensures consistency across all chrome extensions for adobe analytics used by the team.
Core Features & Use Cases
Feature
Best Use Case
Official Installation Instructions
Onboarding new analysts or developers and ensuring they install the correct, sanctioned version of the Debugger.
Prerequisites & System Requirements
Verifying compatibility and troubleshooting installation issues before they escalate to IT support tickets.
Version & Update Information
Maintaining change control logs and understanding when new features or fixes have been released by Adobe.
Direct Chrome Web Store Link
Providing a secure, single-source link for company-wide deployment or internal documentation.
Ensures teams follow supported installation steps.
Lacks extensive screenshots or interactive examples.
Essential for enterprise governance and change control.
Information can be dry compared to community tutorials.
3. Activity Map v3 (Adobe Analytics)
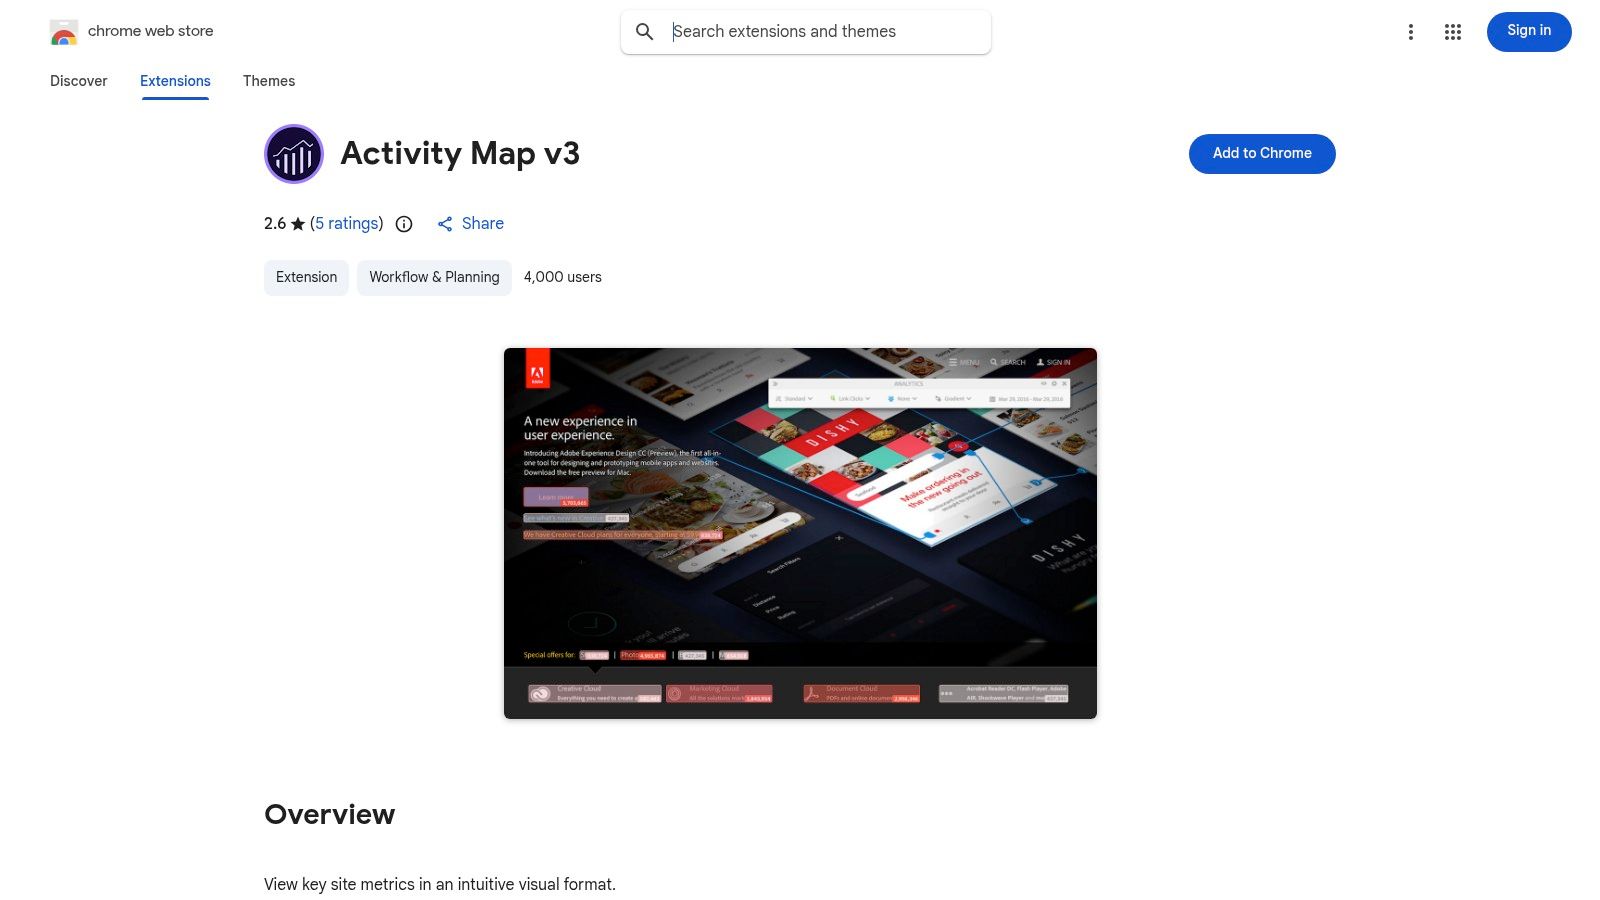
For content managers and UX analysts, Adobe’s Activity Map v3 provides an immediate visual layer of data directly onto your website. This official extension moves analytics out of the reporting interface and into the context of the user experience. It overlays click data on top of your pages, revealing which links and calls-to-action are performing best without ever needing to open an Analysis Workspace project.
Its primary advantage is providing page-level insights in real-time to non-technical users. A marketer can instantly see which of the three "Learn More" buttons on a page receives the most engagement, empowering quick, data-driven decisions on content placement and UI design. The ability to apply existing Adobe Analytics segments allows for powerful, targeted analysis, such as viewing click behavior for only "First Time Visitors" or "Mobile Users."
Core Features & Use Cases
Feature
Best Use Case
In-Page Click Overlays
Visually identifying the most and least popular links on a webpage to inform content strategy and A/B testing hypotheses.
Segment Filtering
Applying pre-built Adobe Analytics segments to understand how different user groups interact with page elements.
Minute-Level Granularity
Analyzing user click behavior in near real-time immediately after a new campaign launch or content update.
Link & Region Tracking
Evaluating the performance of specific UI components, like navigation bars or footers, across the entire site.
Empowers non-analysts to make data-informed UX decisions.
Relies on a correct and complete Activity Map setup in Adobe Analytics.
Delivers fast, contextual insights without leaving the website.
Chrome-only; requires an active Adobe Analytics login to function.
Powerful segmentation using your existing Adobe Analytics setup.
Can be misleading if links have dynamic IDs or are not tagged properly.
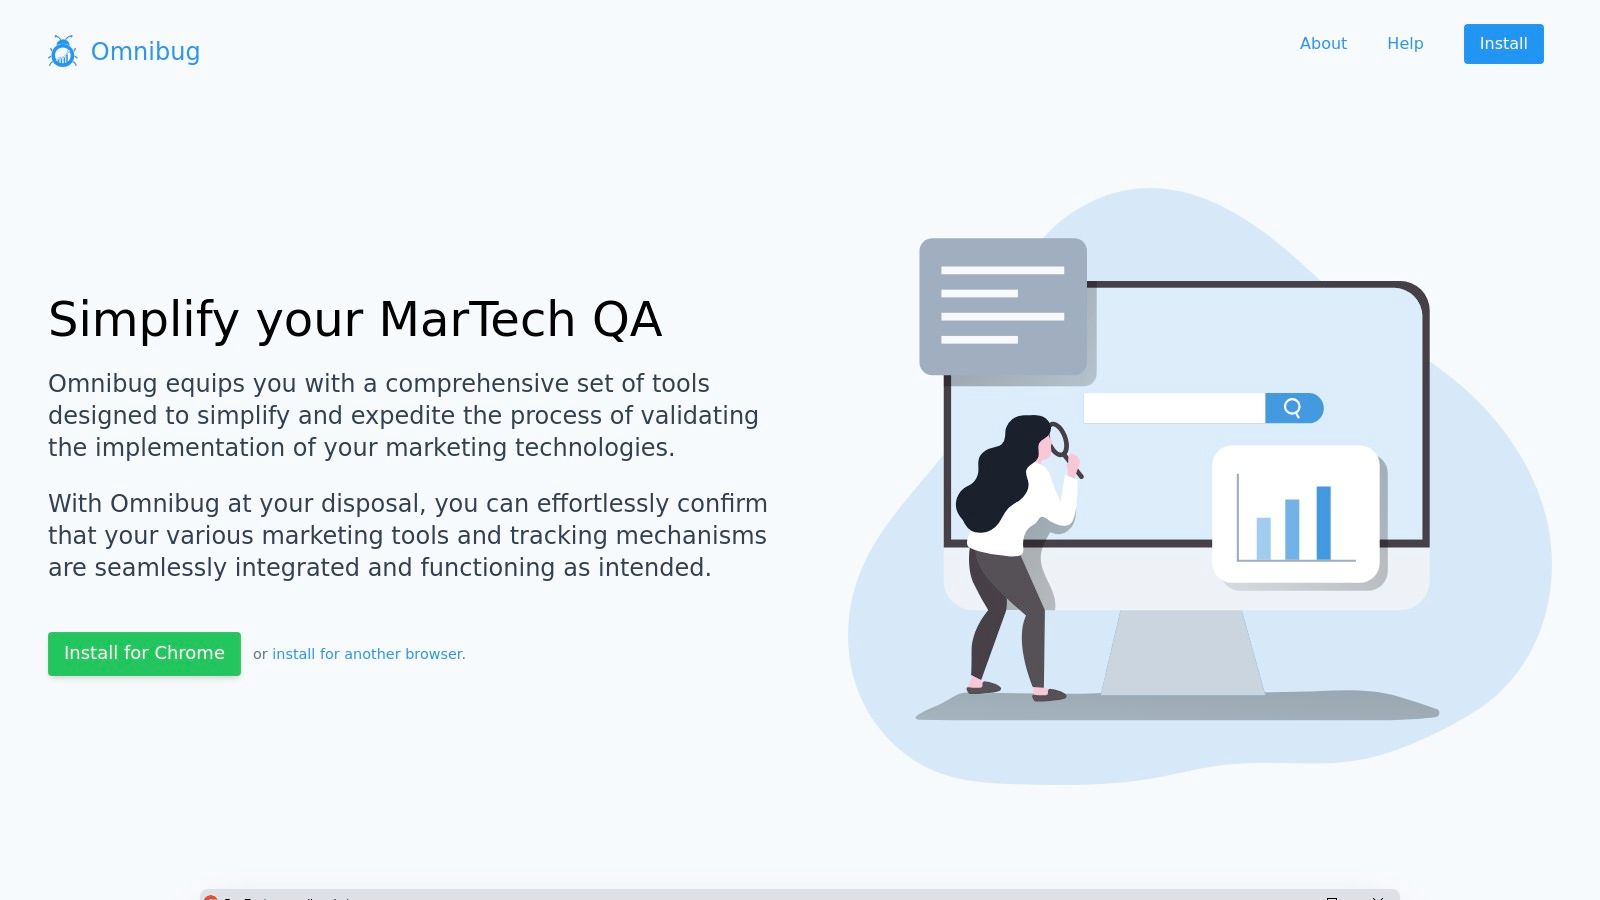
4. Omnibug (Chrome Web Store)
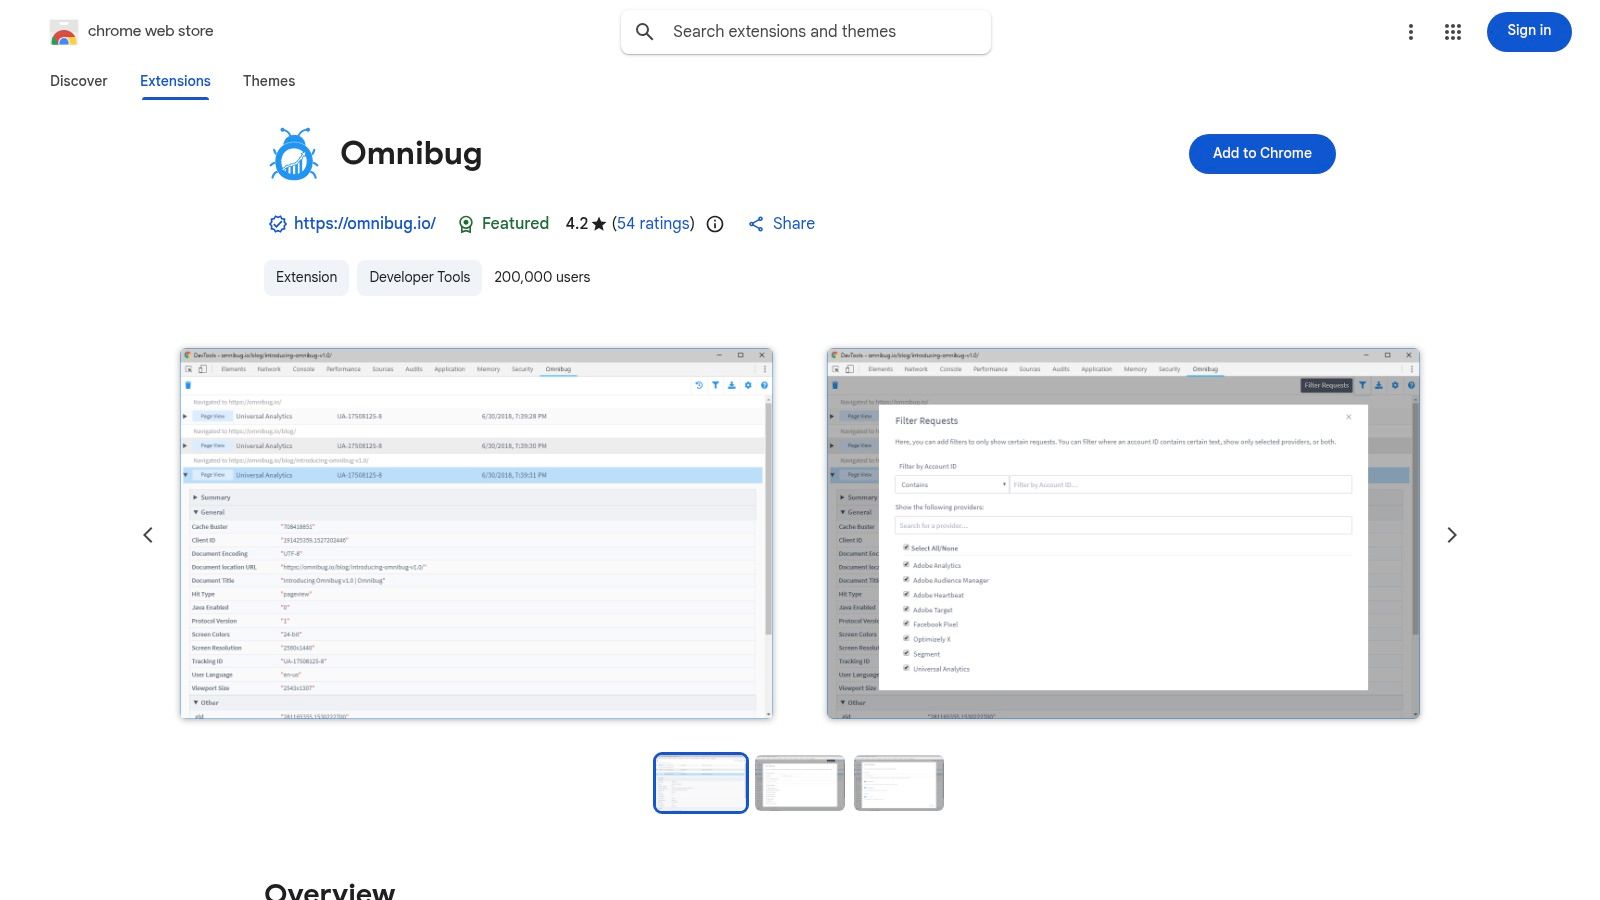
Omnibug is a widely respected, open-source debugger that acts as a universal translator for marketing technology tags. While Adobe's debugger is specialized, Omnibug’s strength lies in its broad support for a vast ecosystem of tools, including Adobe Analytics, Google Analytics, Tealium, and many more. It decodes outgoing marketing and analytics beacons, translating them from cryptic URLs into a clear, human-readable format right within your browser's DevTools panel.
This makes it an indispensable tool for analysts and developers working in complex, multi-vendor environments. If your site uses Adobe Analytics alongside other marketing pixels, Omnibug provides a single, consolidated view of all tracking requests. Its powerful filtering and export capabilities are excellent for isolating specific beacons and sharing debugging logs with team members, making it one of the most versatile chrome extensions for adobe analytics and beyond.
Core Features & Use Cases
Feature
Best Use Case
Multi-Provider Decoding
Debugging user journeys across a mixed marketing stack, seeing how Adobe Analytics, a Facebook pixel, and Google Ads tags fire together.
DevTools Panel Integration
Analyzing network requests in real-time alongside other developer activities without needing a separate pop-up window.
Filtering & Exporting
Isolating specific Adobe Analytics server calls on a busy page and exporting the payload as a CSV or JSON for further analysis.
Human-Readable Parameters
Quickly identifying the value of eVar15 or prop2 without having to manually scan a long, complex URL query string.
Supports a huge range of MarTech vendors beyond Adobe.
UI within DevTools can be dense for beginners.
Lightweight and fast performance.
Lacks Adobe-specific features like Launch environment switching.
Strong community reputation and open-source transparency.
May require the official Adobe debugger for very advanced use cases.
5. Omnibug (Official site)
While not an extension itself, the official Omnibug website is an indispensable resource for mastering the Omnibug extension. It serves as the central hub for documentation, release notes, and a comprehensive matrix of supported vendors. For teams standardizing on Omnibug for analytics debugging, this site is the go-to place for training materials and understanding the full scope of its capabilities beyond just Adobe Analytics.
Its primary value lies in providing clear, accessible information that empowers users to get the most out of the tool. Instead of relying on trial and error, analysts and developers can consult the official documentation to understand how different marketing and analytics tags are decoded. The detailed changelog is also crucial for staying informed about new features, bug fixes, and added vendor support, ensuring your debugging practices remain current.
Core Features & Use Cases
Feature
Best Use Case
Supported Vendor Matrix
Verifying if a specific marketing, advertising, or analytics tag outside the Adobe ecosystem is supported and how it will be decoded.
Official Documentation
Onboarding new team members or learning advanced features, such as custom provider configurations or GTM debugging.
Changelog & Release Notes
Staying up-to-date with the latest enhancements and bug fixes to ensure you are using the most stable and feature-rich version.
Direct Installation Links
Providing a trusted, central source for links to the Chrome, Firefox, and Edge web stores to download the extension.
Access & Installation
Pricing: Free
Availability: The website is publicly accessible at Omnibug.io.
Pros & Cons
Pros
Cons
Clear, centralized learning resource for the extension.
It's a documentation site, not the live extension itself.
Official source for updates and supported technologies.
Installation still happens via the Chrome Web Store.
Vendor-agnostic information is useful for multi-tool environments.
Content is focused solely on the Omnibug tool.
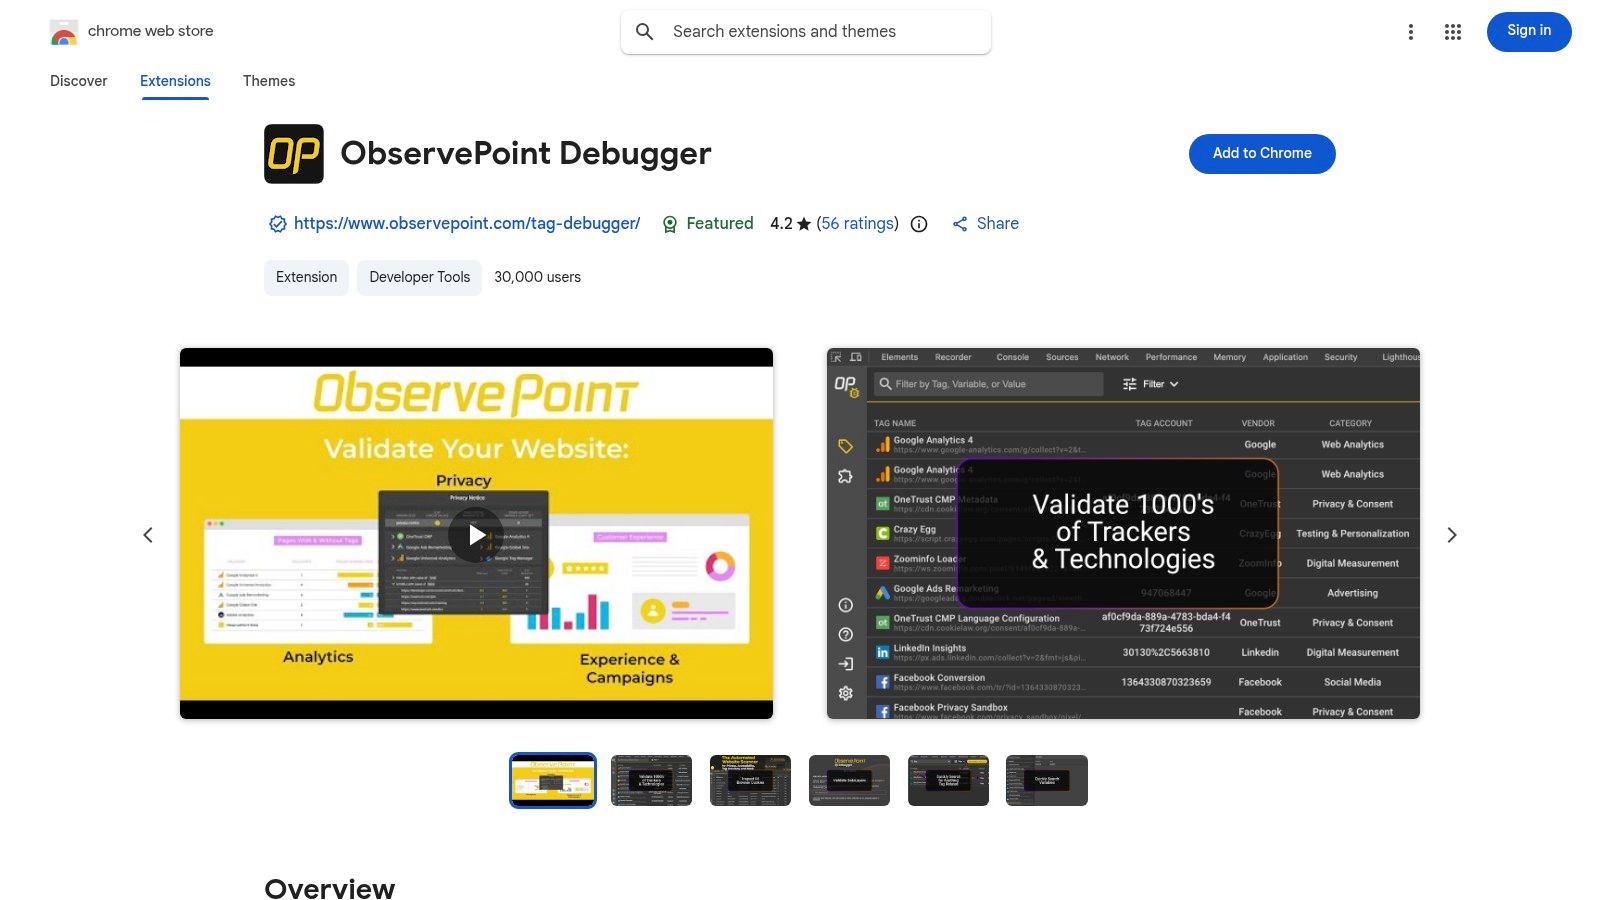
6. ObservePoint Debugger
The ObservePoint Debugger is another powerful tool that integrates directly into Chrome’s DevTools, making it a favorite among QA teams and technical marketers. It automatically detects and deciphers a wide range of marketing and analytics tags, including Adobe Analytics (both GET and POST requests) and the AEP Web SDK. It provides a clean, tag-centric view of all network requests fired on a page.
Its standout features are its user-friendly interface and its ability to export session data to Excel, which is invaluable for documenting QA processes and sharing findings with stakeholders. Beyond just tag validation, the extension includes a dedicated cookie inspection tab, making it a strong choice for teams focused on compliance and privacy verification alongside standard analytics debugging. This makes it one of the more versatile chrome extensions for adobe analytics available.
Core Features & Use Cases
Feature
Best Use Case
Tag & Variable Parsing
Validating Adobe Analytics server calls and AEP payloads within the familiar DevTools panel during QA cycles.
Cookie Inspection Tab
Auditing first-party and third-party cookies set by Adobe and other martech tools to ensure compliance with privacy policies.
Session Export to Excel
Creating detailed reports of a user journey's tagging data for offline analysis, documentation, or sharing with non-technical team members.
Request Filtering
Isolating specific Adobe Analytics beacons on busy pages with numerous marketing tags to focus debugging efforts.
Pros & Cons
Pros
Cons
User-friendly for marketers and QA teams, not just developers.
Deeper automated scanning requires the paid ObservePoint platform.
Useful for cookie/compliance checks alongside tag debugging.
Some advanced features are reserved for the paid product.
Integrates smoothly into the native Chrome DevTools workflow.
The interface is clean but less detailed than the official Adobe Debugger.
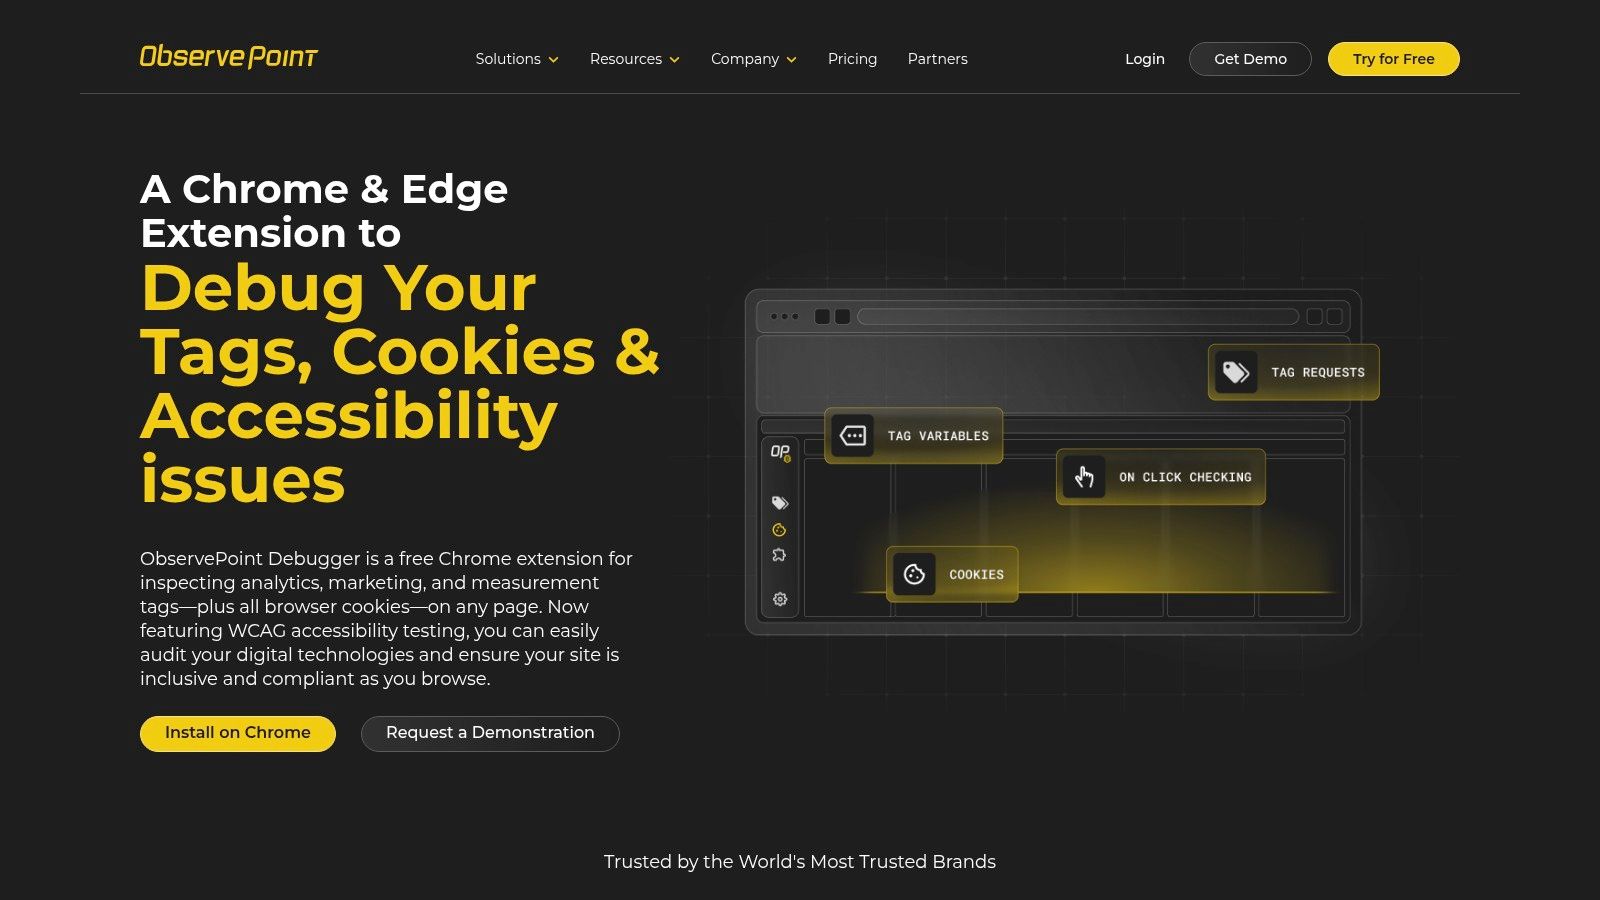
7. ObservePoint - Debugger landing / help
While the ObservePoint Tag Debugger is a powerful extension, its website serves as a crucial educational resource for teams looking to formalize their data governance. This platform provides not just a download link but a comprehensive hub explaining how manual debugging with the extension fits into a broader, automated quality assurance strategy. It’s an excellent starting point for understanding how to scale analytics validation from a single page to an entire enterprise.
The site’s strength lies in its clear documentation, step-by-step guides, and FAQs that help users master the debugger. It explains how to interpret Adobe Analytics variables, audit other marketing tags, and even perform basic accessibility checks. For managers and team leads, it clearly articulates the value proposition of connecting the free browser tool to ObservePoint's paid platform for automated site-wide scans and compliance monitoring, making it a valuable resource for building a business case for better governance.
Core Features & Use Cases
Feature
Best Use Case
Step-by-Step Installation Guides
Onboarding new team members or analysts who need to learn how to use the debugger extension effectively.
Adobe Compatibility Explanation
Understanding exactly which Adobe Analytics variables the extension can parse and how it presents them for analysis.
Integration with Paid Platform
Evaluating how the free tool's manual checks can be complemented by ObservePoint's full suite of automated auditing tools.
Accessibility Test Information
Learning how to use the extension's built-in WCAG tests to identify and fix basic accessibility issues on a page.
Pros & Cons
Pros
Cons
Excellent educational material for formalizing QA processes.
Content is marketing-oriented to upsell the full platform.
Clarifies how the free tool integrates with a larger governance suite.
Some advanced capabilities require a paid ObservePoint license.
Provides clear, practical use cases for the debugger.
The deepest technical information is within the extension itself.
8. dataslayer (Chrome Web Store)
For analysts and developers who live in the intersection between a tag management system (TMS) and the resulting analytics beacon, dataslayer is an indispensable tool. It excels at providing a clear, real-time view of the data layer and the Adobe Launch rules firing on a page. This focus makes it one of the best chrome extensions for adobe analytics when your primary goal is to validate the connection between user actions, data layer events, and the resulting TMS logic.
Its core strength is its simplicity and focus. While other tools offer a comprehensive suite of features, dataslayer hones in on presenting data layer pushes and triggered rules in a clean, chronological format within the DevTools panel. This makes it incredibly efficient for debugging sequencing issues or confirming that a specific data element is populated correctly before an analytics tag is fired. For a deeper dive into this workflow, you can learn how to see the dataLayer in Chrome with tools like this.
Core Features & Use Cases
Feature
Best Use Case
Data Layer Monitoring
Watching data layer pushes in real-time to ensure objects are correctly formatted and populated upon user interaction.
Launch/DTM Rule Tracking
Verifying that the correct Adobe Launch rules and data elements are triggered by specific events or page loads.
Adobe Analytics Hit Parsing
Quickly decoding the Adobe Analytics beacon to confirm that data layer values are correctly mapped to eVars and props.
Multi-TMS Support
Debugging complex implementations that may involve multiple tag managers or iframes on a single page.
Interface focuses on data layer workflows, not deep AA coaching.
Lightweight and fast for daily QA tasks.
Less rich AA-specific guidance compared to Adobe's official tools.
Supports multiple data layers and TMS platforms simultaneously.
UI is functional but less polished than some modern alternatives.
9. dataslayer (Official site)
While the dataslayer extension is the primary tool, its official website serves as an essential companion resource for documentation and understanding its full capabilities. It provides a comprehensive matrix of supported tags, making it clear exactly which Adobe Analytics variables, eVars, props, and events the extension can decode. This is crucial for analysts and developers who need to confirm that their specific implementation details are covered.
The site's main value lies in its transparency and educational content. It breaks down how the extension surfaces information from tag management systems like Adobe Launch/DTM, providing a clear reference for onboarding new team members. By detailing what the tool does behind the scenes, it helps build confidence and proficiency in manual debugging workflows, which is a vital part of any robust QA process.
Core Features & Use Cases
Feature
Best Use Case
Supported Tags Matrix
Confirming that dataslayer can parse your specific Adobe Analytics implementation and other marketing tags before standardizing its use.
Documentation
Training new QA testers or developers on how to use the extension to validate Adobe Launch rules and data layer pushes.
Download Links
A central, trusted source for accessing the official Chrome Web Store link for installation, avoiding unofficial versions.
Feature Explanations
Understanding advanced features like session import/export to share debugging findings with other team members.
Access & Installation
Pricing: Free to access.
Availability: The documentation site is publicly available at dataslayer.org. The extension itself is installed via the Chrome Web Store.
Pros & Cons
Pros
Cons
Transparent reference for what variables the tool decodes.
It's a documentation site; the tool itself must be installed separately.
Excellent for onboarding QA and dev teams to a TMS workflow.
The content supplements the extension rather than replacing it.
Centralized source for official information and downloads.
The UI is simple and focused purely on information delivery.
10. Launch and DTM Switch
The Launch and DTM Switch is a classic, specialized utility that solves a very common problem: testing tag management changes on a live site. Before Adobe’s official debugger matured, this was the go-to tool for developers and analysts needing to swap out a production Adobe Launch or DTM library with a development or staging version. It allows you to simulate changes locally in your browser without any code deployments.
Its core function is to intercept the script tag for Launch/DTM and replace it with a URL you provide, making it an essential part of the QA workflow. This enables rapid validation of new rules, data elements, and extensions in a live environment, which is invaluable for catching issues before they impact production data. While simpler than modern tools, its focused purpose makes it a reliable and fast option for environment testing.
Core Features & Use Cases
Feature
Best Use Case
Library Overriding
Safely testing a staging Launch library on the production website to validate changes with live user journeys.
Debug Mode Toggling
Quickly enabling or disabling the _satellite.setDebug(true) command to see console logs without manually editing code.
Environment Recording
Saving multiple staging or dev library URLs within the extension to easily switch between different testing environments.
Simple UI
Making quick, on-the-fly swaps between different tag management libraries without a complex configuration process.
Speeds up environment testing without code deployments.
Last updated in January 2023, may lag newer patterns.
Simple, focused interface that is easy to learn and use.
May not cover the latest AEP/Web SDK workflows.
A long-standing, familiar tool for many Adobe Analytics veterans.
Functionality is largely replicated in the official AEP Debugger.
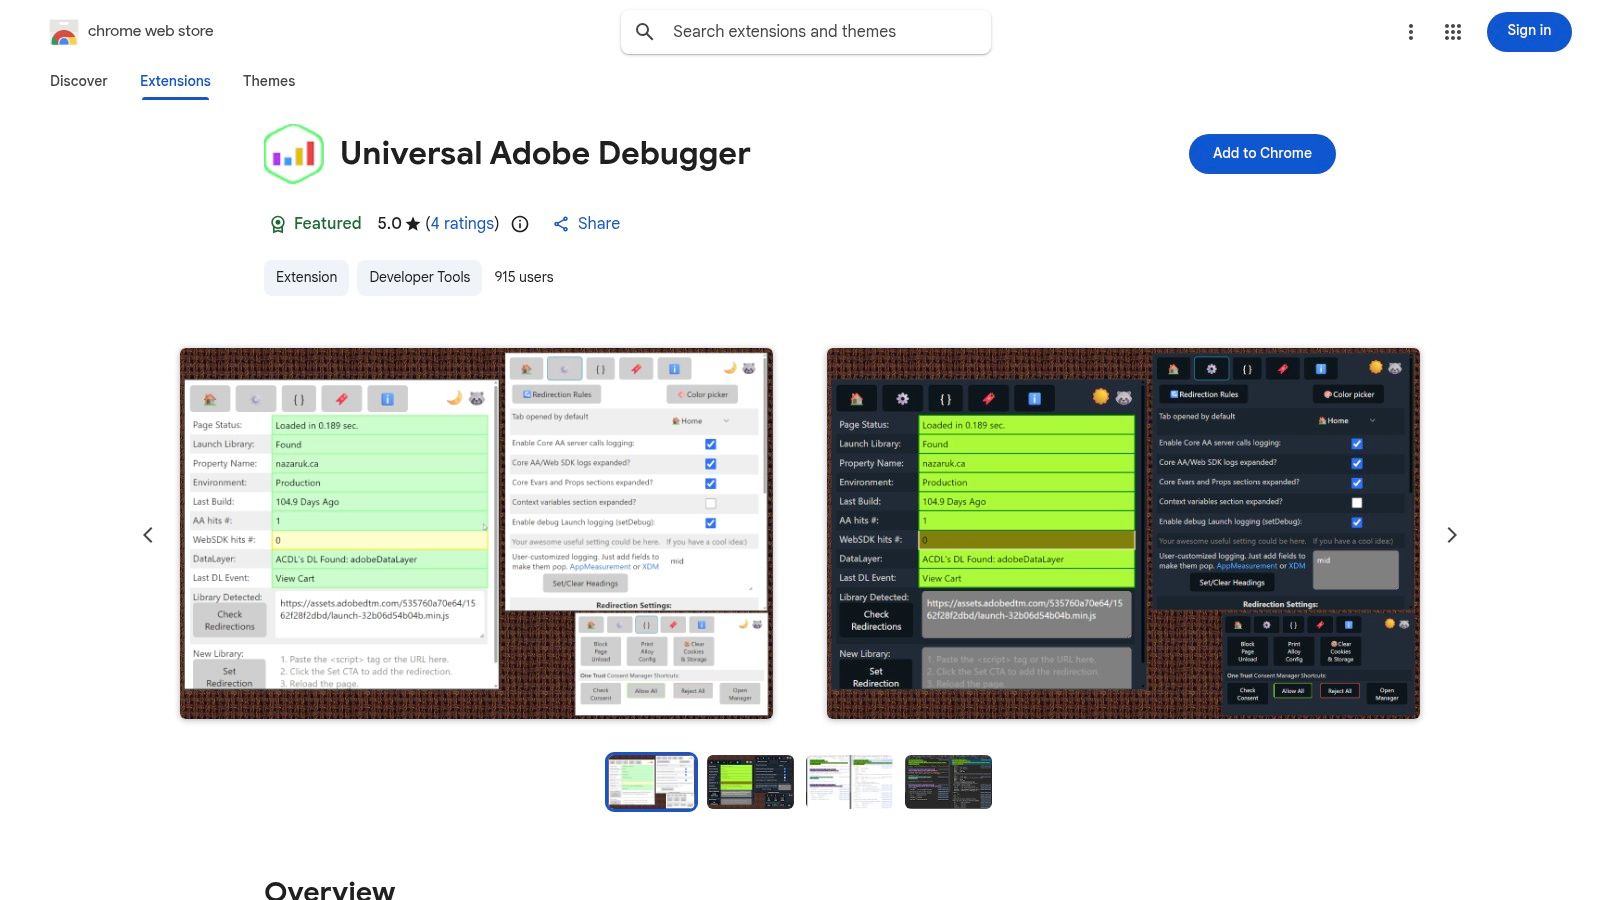
11. Universal Adobe Debugger
For analysts and developers who live inside the DevTools console, the Universal Adobe Debugger offers a streamlined, lightweight alternative to more UI-heavy extensions. This community-built tool focuses on logging all Adobe Analytics and AEP Web SDK network calls directly to your browser's console, providing a quick, script-focused workflow for debugging your implementation. It strips away the graphical interface in favor of raw, immediate output where you do most of your technical work.
Its core advantage is efficiency. By displaying beacon data directly in the console, it integrates smoothly into existing development and QA processes. The extension also includes handy features like Launch library replacement and useful troubleshooting snippets for common analytics and consent tasks. This makes it one of the most practical chrome extensions for adobe analytics for power users who prefer a console-first approach to validation and testing.
Core Features & Use Cases
Feature
Best Use Case
Console-Based Logging
Quickly verifying Adobe Analytics or AEP Web SDK calls in the DevTools console without leaving your existing workflow.
Launch Library Replacement
Swapping the live Launch library with a staging version to test changes directly on the production environment.
Troubleshooting Snippets
Running pre-built code snippets to quickly diagnose common issues related to consent management or data layer state.
Customizable Themes
Adjusting the console output appearance (e.g., dark/light mode) to improve readability during long debugging sessions.
Lightweight and efficient for power users accustomed to DevTools.
The console-first workflow is less visual and intuitive for beginners.
Integrates debugging seamlessly into the developer console workflow.
As a community tool, it may lack the polish of vendor-backed extensions.
Frequent quality-of-life tweaks and updates from the community.
Support is community-driven rather than from an official Adobe channel.
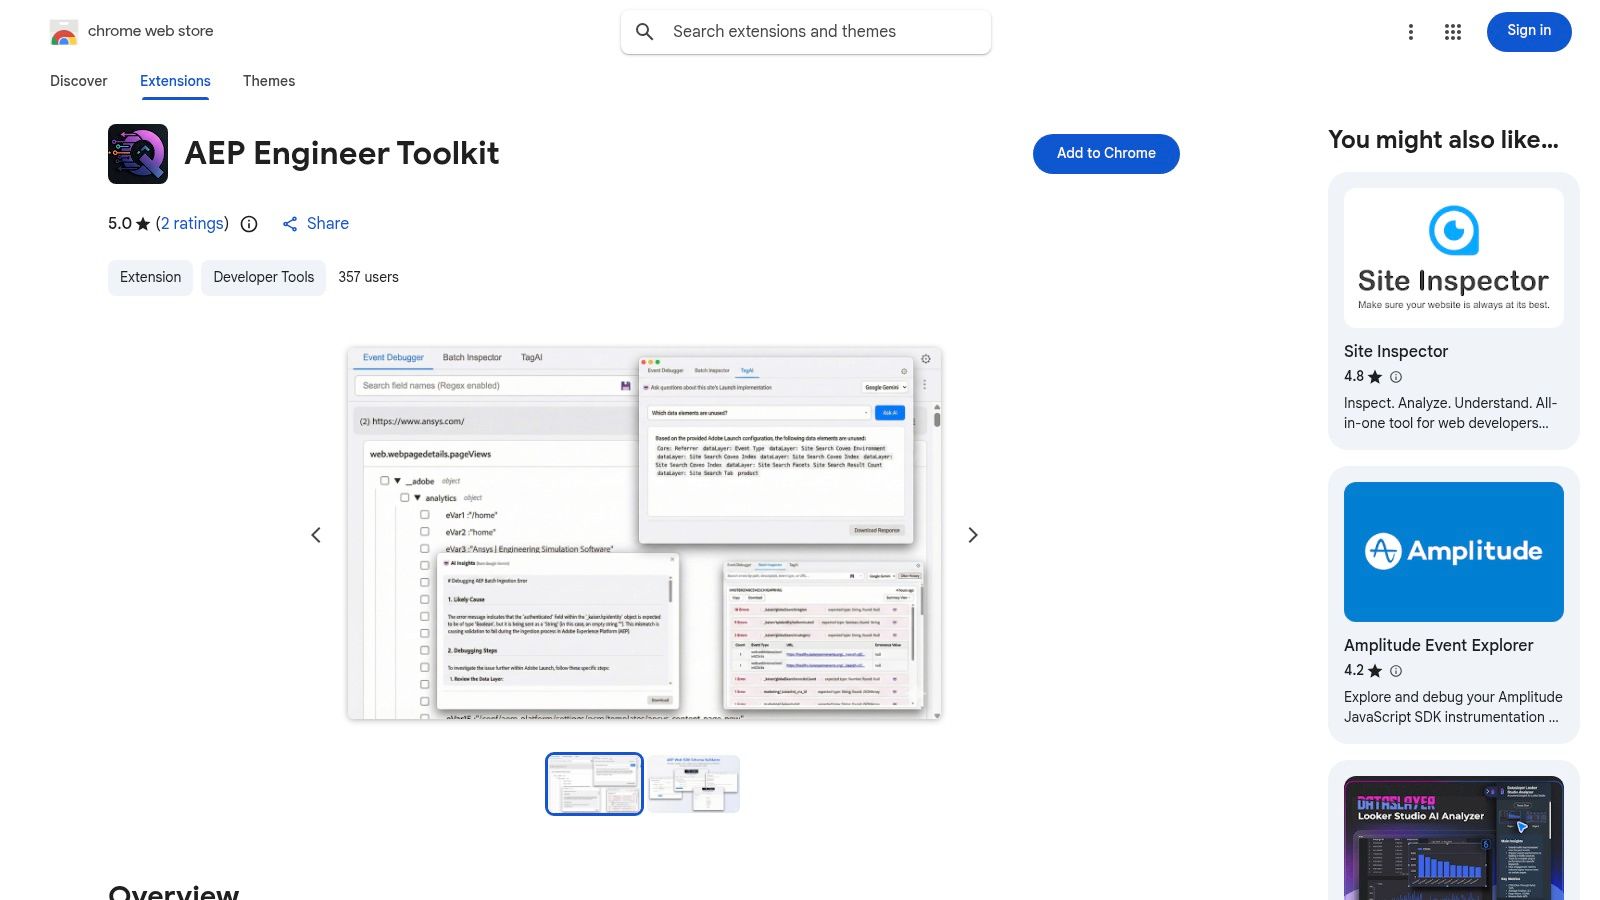
12. AEP Web SDK Engineer Toolkit (QorLytics)
For teams all-in on the Adobe Experience Platform, the AEP Web SDK Engineer Toolkit by QorLytics is a specialized, powerful ally. While the official Adobe Debugger is a great generalist tool, this extension is purpose-built for the intricacies of the AEP Web SDK. Its core function is to streamline the validation of XDM payloads against your defined schemas, a critical task for maintaining data quality and preventing schema drift.
The free version provides a real-time event debugger that captures and displays /interact and /collect calls, which is already a significant step up for AEP-focused debugging. However, its true value is unlocked with premium features that allow you to upload your company’s XDM schemas. The extension then automatically validates outgoing data against them, immediately flagging any discrepancies. This proactive approach helps catch implementation errors long before they corrupt your AEP datasets.
Core Features & Use Cases
Feature
Best Use Case
Real-time Event Capture
Monitoring the flow of /interact and /collect events from the AEP Web SDK as you navigate a site.
XDM Schema Validation
(Premium) Ensuring that data sent to AEP perfectly matches its intended schema structure, preventing data ingestion errors.
Batch Inspector
(Premium) Using Adobe I/O credentials to inspect and debug failed data batches directly within the browser interface.
AI-assisted Analysis
(Optional) Leveraging AI (with your own API key) to get plain-language insights and suggestions for fixing data quality issues.
Access & Installation
Pricing: Freemium (core debugger is free; advanced validation and inspection features require a paid subscription).
Built for AEP schema validation; AI-assisted analysis (premium)
Freemium; advanced features require subscription & setup
From Manual Debugging to Automated Observability: Building a Complete QA Strategy
Navigating the complexities of Adobe Analytics requires a robust toolkit, and as we've explored, the right set of Chrome extensions for Adobe Analytics is indispensable for real-time debugging. Tools like the Adobe Experience Platform Debugger, Omnibug, and dataslayer provide an essential, in-the-moment window into your data layer. They empower you to validate tag triggers, inspect network requests, and troubleshoot implementation issues directly within your browser as you actively develop or QA a new feature. This hands-on, manual inspection is a critical first line of defense, helping you catch obvious errors before they ever reach production.
However, relying solely on this manual, reactive approach creates significant gaps in your data governance. Manual debugging is inherently limited. It's time-consuming, doesn't scale across thousands of user journeys or device types, and can't possibly monitor your implementation 24/7. What happens when an issue is intermittent, specific to a certain browser version, or introduced by a server-side change after deployment? These are the silent data killers that manual spot-checks almost always miss, leading to corrupted reports and eroded trust in your analytics.
Bridging the Gap: From Manual Checks to Continuous Monitoring
This is where the paradigm shifts from tactical debugging to strategic, automated observability. To build a truly resilient analytics practice, you need to complement your manual toolset with an automated QA layer. Think of it this way: the extensions are your microscope for examining a specific problem up close, while an automated platform is your wide-angle, always-on satellite that monitors the entire landscape for anomalies. The distinction is crucial when developing a comprehensive quality assurance framework; understanding the difference between a high-level approach and a detailed, execution-focused plan is key, much like the difference explored in articles on test plan vs test strategy in software testing.
This is precisely the role Trackingplan fills. It moves your QA process from a reactive, manual effort to a proactive, automated one. While your extensions help you fix what you can see during development, Trackingplan works tirelessly in the background, monitoring 100% of your live user traffic. It automatically detects issues that are impossible to find manually, such as:
Schema Deviations: Alerts when new, unexpected properties appear or when existing ones are sent with the wrong data type.
Missing Events: Identifies when critical events fail to fire on specific user journeys or across certain segments.
Widespread Implementation Errors: Catches silent, systemic issues introduced by a code release that a manual check on a single page would miss.
Ultimately, the most effective QA strategy isn't about choosing one method over the other. It’s about creating a powerful, two-part system. Use the powerful Chrome extensions for Adobe Analytics discussed in this article for active development, debugging, and initial validation. Then, layer in Trackingplan for continuous, automated observability and governance. This dual approach ensures both granular control during implementation and high-level assurance after deployment, safeguarding your data integrity and empowering your team to make decisions with complete confidence.
Ready to elevate your analytics QA from manual spot-checks to full-scale automated observability? See how Trackingplan can provide 24/7 monitoring for your Adobe Analytics implementation, catching the critical errors your extensions miss. Visit Trackingplan to discover how you can ensure complete data trust and integrity across all your digital properties.
David Pombar
Read more from David, a Senior Product Strategist with 18+ years in digital product development and an atypical error detection knack.
By clicking “Accept All Cookies”, you agree to the storing of cookies on your device to enhance site navigation, analyze site usage, and assist in our marketing efforts. View our Privacy Policy for more information.