Find where all the errors compromising the quality of your data errors have occurred, why, and how you can solve them with Trackingplan's Warning Debug.
David Pombar
Swiss army knife at Trackingplan
October 13, 2023
9
min
One of our main missions at Trackingplan is to automatically alert you about any error or change happening in your digital analytics so you and your team can focus on analysis instead of having to look for errors manually. However, we soon realized that, for some of our clients, this was not enough when it came to minimizing the time spent debugging analytics problems, especially when these warnings had to do with properties missing or not conforming to the validation rules or constraints specified.
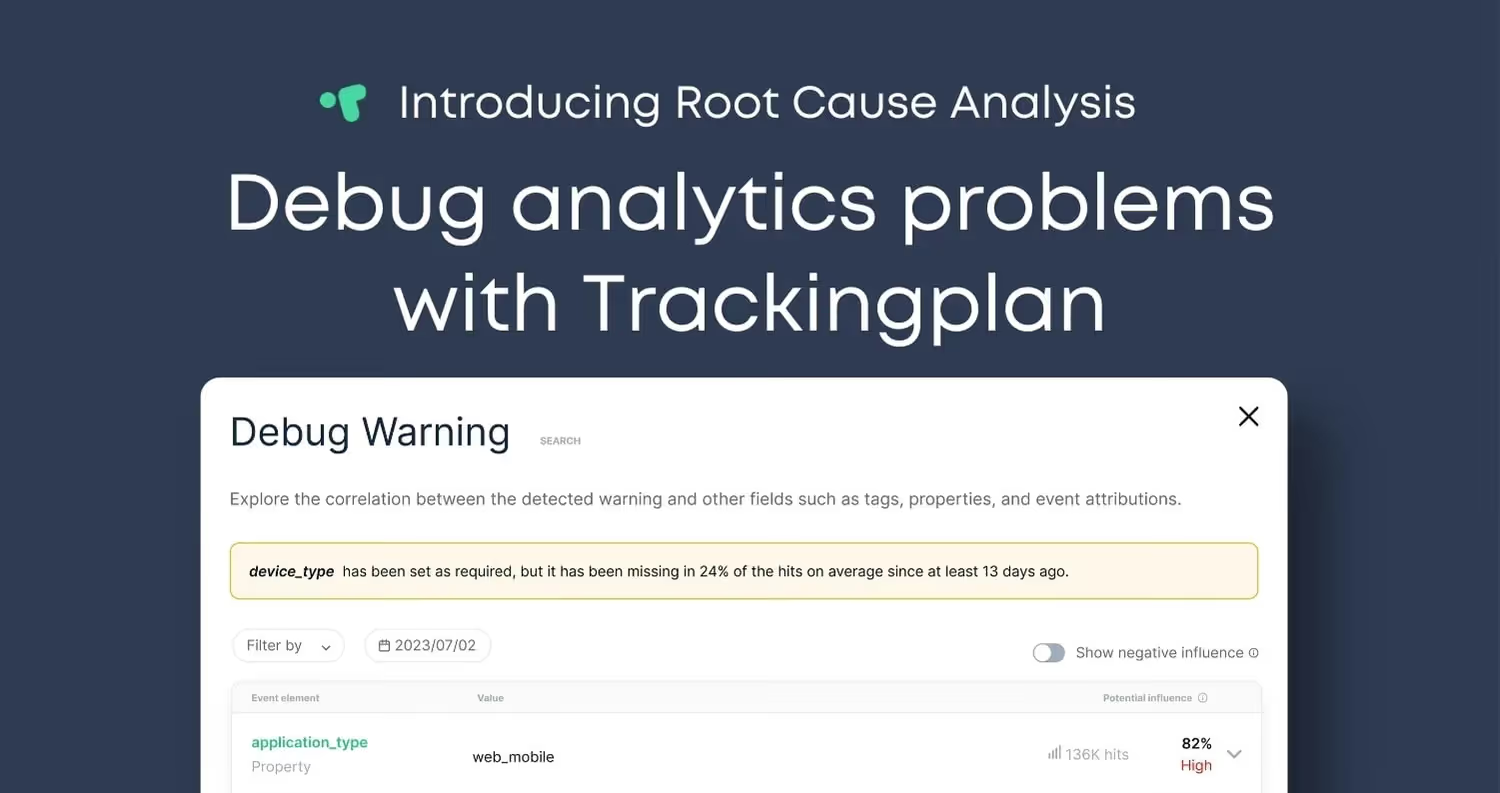
That is why Trackingplan’s Warning Debug has been created to tell you where all the errors compromising the quality of your data have occurred, why, and how you can solve them to help you tackle them in record time.
Tracking down the culprit: An Introduction to Root Cause Analysis
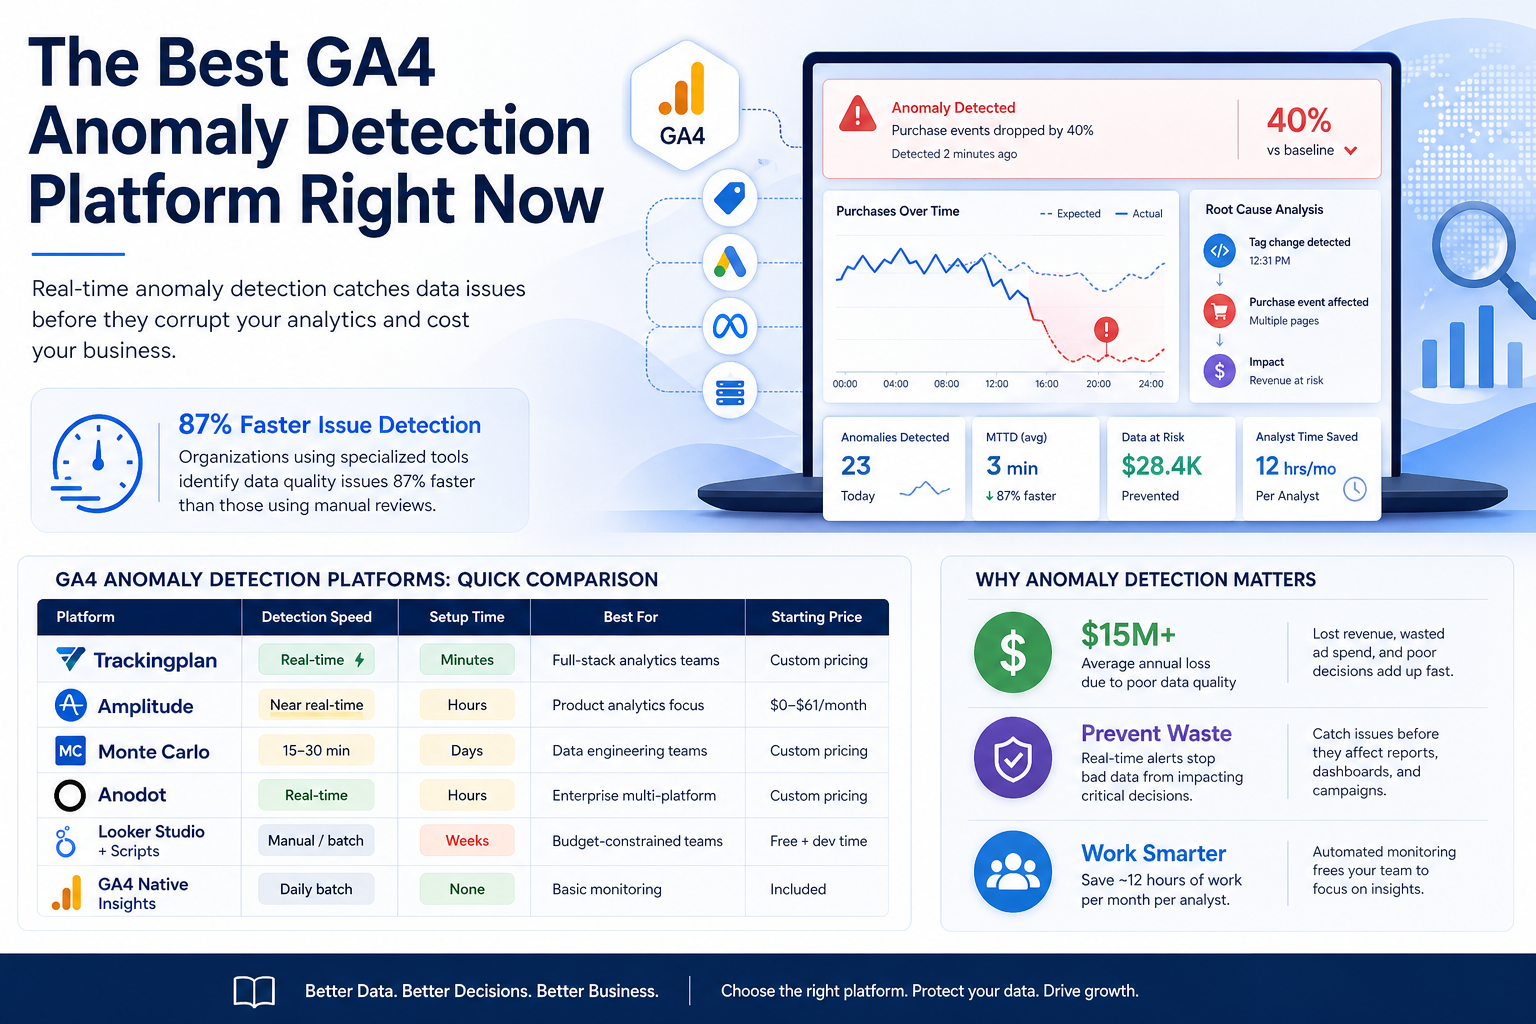
Once an anomaly has been detected, the next step is to figure out where the issue originated in order to track down the culprit of the bad data. Here is precisely where Root Cause Analysis (RCA) comes in to focus on why, how, and when anomalies occur and fully understand the underlying causes that originated the appearance of such incidents.
In that sense, RCA identifies all factors that contribute to the problem, connecting events in a meaningful way so that issues can be properly addressed and prevented from reoccurring by getting into de root of the problem, rather than palliating the symptoms.
Root Cause Analysis and debugging capabilities with Trackingplan
At Trackingplan, we know that, if data has been inaccurate due to any error, all analysis obtained from those days in which the error has persisted will also be inaccurate.
To solve this, now just by hovering over any fired alert and clicking directly on the issue you want to investigate, Trackingplan will kickstart an investigation of what might have caused the issue.
More specifically, Trackingplan will automatically pinpoint any potential correlation between the warning spotted and other fields that may have influenced it and will assess its influence. This is useful to quickly identify the values that may have caused the appearance of the warning, the location of the application, and even under what user behavior the error has occurred at a glance.
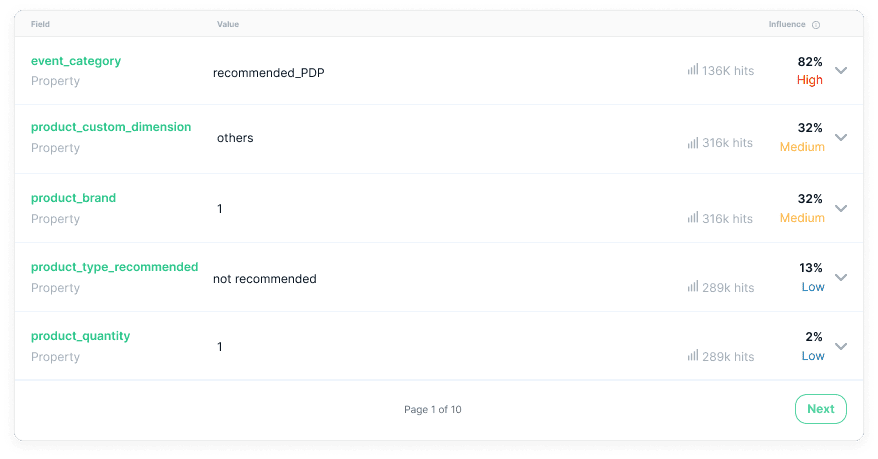
Trackingplan will show you the extent to which an error can impact the appearance of the warning using the following criteria:
However, you also have the option to see the negative influence. This will help you understand where the error never occurs and deduce, based on your analytics, where it should be happening by process of elimination. The higher the negative influence, the more likely it is that the other elements are the ones causing the warning.
Yet, let’s dive deep into the functionality of Trackingplan's Warning Debug in this article as well. For it, we are going to illustrate its practical use with a real-life warning to witness firsthand the insights this tool offers.
With just a quick look, we can see that, inside the event Add_to_cart, the property event_category, when its value is Recommended_PDP, is influencing 82% of the time the appearance of the warning as opposed to the rest of the fields, whose percentage is lower.
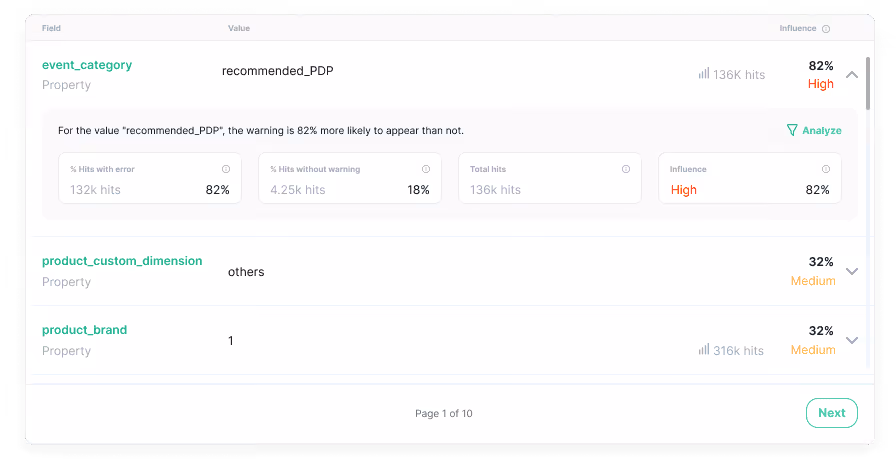
Let’s explore this value closer by clicking on the chevron on the right. Doing this will provide you with more information about the correlation between the selected value and the warning to gain insights about where this percentage comes from.
Moreover, by clicking on “analyze”, you’ll be able to filter for that specific value. You can also do the same by just hovering over the field name.
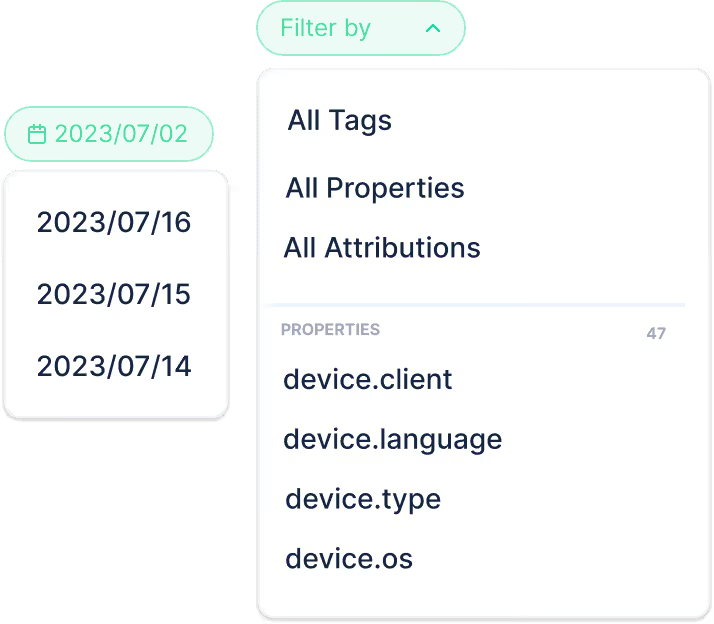
Yet, if you want to look for something specific, like for instance if any of your tags is influencing the appearance of a specific warning, you also have the option to filter directly among your tags, properties, attributions, and the dates on which your warnings were spotted in order to see the correlation between these values and the warning.
Finally, you can also click on “Download sample payloads” to download all the tracks generated by that warning and be provided with meaningful contextual information about where and why the error happened. Moreover, you can also download the raw tacks of a specific casuistry by using the filters.
Best practices
Let’s dive into a few tips to better leverage the full power of Trackingplan’s Warning Debug feature:
Have a good data-tracking plan
While having a good tagging plan to understand user behavior and know what they do and where within your apps and websites is the first step, Trackingplan helps you go further by offering the possibility of addingtagsto label your data.
Leverage the full power of Trackingplan’s Warning Debug with tags
Tags are completely customizable and can be extremely helpful in identifying the components from which your data is launched by country, device, release version, build number, app version, or Test Name in staging or preproduction environments.
Conclusion
As we've explored in this article, the integrity and quality of your data is the basis upon which your reports and business intelligence strategies rest. At Trackingplan, we understand the critical role that accurate data plays in guiding your data-driven decisions, and that is why Trackingplan’s fully automated anomaly detection capabilities combined with our new Root Cause Analysis (RCA) capabilities stand to help our clients effortlessly debug any issue affecting the quality of their data in record time.
Trackingplanis a fully automated data QA and observability solution for your digital analytics created to ensure your data never breaks and always arrives to your specifications by automatically documenting all the data that your apps and websites are sending to third-party integrations like Google Analytics, Segment, or MixPanel.
This creates a single source of truth where all teams involved in first-party data collection can collaborate, automatically receive notifications when things change or break in yourdigital analytics, marketing automations, pixels, or campaigns, and easily debug any problem by being provided with the root cause of the problems affecting your data integrity.
Our Warning Debug feature has been designed to pinpoint the root cause of the problem quickly, allowing businesses to solve issues much faster, saving time and minimizing business disruption for accurate and trustworthy reports on which to base your Business Intelligence strategies. In this sense, considering that trust is the currency of success in a world where data can make or break your business, with Trackingplan, you can rest assured that your data is accurate, your analyses are reliable, and your strategies are well-informed.
By clicking “Accept All Cookies”, you agree to the storing of cookies on your device to enhance site navigation, analyze site usage, and assist in our marketing efforts. View our Privacy Policy for more information.