

Unlock the power of GA4 anomaly detection. Learn how it works, how to customize alerts, and diagnose issues before they impact your business.
Think of GA4's anomaly detection as a smart, built-in alarm system for your website's data. It works around the clock, using machine learning to automatically flag any unusual spikes or dips in your most important metrics, like traffic and conversions. This feature single-handedly transforms your analytics from a simple reporting tool into a proactive watchdog for your business.
Unpacking GA4 Anomaly Detection

Let's be real: trying to manually monitor every single metric on your site, 24/7, is a recipe for disaster. It’s just not possible. By the time you’d notice a significant drop in revenue or a broken checkout page, the damage is already done. This is precisely the headache GA4 anomaly detection was built to solve, shifting your team from a reactive, "fire-fighting" mode to a proactive one.
Instead of just spitting out raw numbers, this feature first learns what “normal” looks like for your site. It gets a feel for your unique business rhythms—like higher traffic on weekends, midday lulls, or predictable sales spikes during the holidays. After establishing that baseline, it keeps a constant eye out for anything that deviates from the expected pattern.
GA4 anomaly detection turns your analytics from a historical record into a forward-looking alert system. It's the difference between reading an old incident report and having a fire alarm go off the second it detects smoke.
The Core Value for Your Business
The main benefit here is simple but incredibly powerful: catching critical issues early. Of course, none of this works without a proper GA4 integration to ensure the data it's watching is accurate in the first place. Once you're set up, the system can flag problems that might otherwise fly under the radar for days or even weeks.
This kind of proactive monitoring is a direct line to protecting your bottom line and maintaining trustworthy data. A single, timely alert can easily be the difference between a quick five-minute fix and a major financial headache.
- Protect Revenue: Instantly spot and fix issues like a broken "add to cart" button or a failing payment processor before they tank your sales.
- Optimize Marketing Spend: Get an alert if a new campaign is causing an unexpected drop in conversion rates, letting you pause or tweak it on the fly.
- Save Time and Resources: Stop wasting hours on manual data checks. This frees up your analysts to focus on actual strategy and optimization, not just putting out fires.
- Maintain Data Integrity: Catch tracking bugs or configuration mistakes that could pollute your data and lead to flawed, costly business decisions down the road.
How It Changes Your Workflow
Ultimately, GA4 anomaly detection fundamentally changes how you interact with your analytics. Your dashboard is no longer just a place to pull reports—it becomes an active partner in protecting your digital performance. When an alert fires, it gives your team an immediate, specific starting point for an investigation, pointing you right to where the problem is so you can diagnose and resolve the root cause. This automated vigilance provides some much-needed peace of mind, ensuring that even when you’re not looking, your data is being watched.
How Google's Machine Learning Finds Data Anomalies
To really trust the alerts GA4 sends your way, it helps to peek behind the curtain. Google's approach to GA4 anomaly detection isn't some rigid "if-then" system. Instead, it's driven by smart machine learning that actually gets to know the unique personality of your business data, turning a one-size-fits-all platform into a monitor that's tuned just for you.
It all starts with a critical training period. This can take weeks or even months, but during this time, GA4's algorithms are like a dedicated student, poring over your historical data to learn what "normal" actually looks like. It isn't just calculating simple averages; it's spotting complex patterns and cycles.
Think of it like an experienced store manager who instinctively knows that foot traffic is crazy on Saturday afternoons but dead on Tuesday mornings. GA4 learns these same rhythms for your digital storefront. It figures out your usual weekend sales spikes, the traffic dip after a big holiday, or the daily ebb and flow of user sign-ups. This deep historical context is what keeps the system from crying wolf over routine ups and downs.
Building a Statistical Fingerprint
Once that training period is over and GA4 understands your business's typical pulse, it uses advanced statistical models to predict what your data should look like at any given hour or day. This isn't just a simple forecast. It's a dynamic expectation built from multiple layers of your data's history.
These models create a "confidence band"—basically an expected range for each of your key metrics. As long as your actual data stays within this band, everything is business as usual. An anomaly is only flagged when a metric, like revenue or user sign-ups, suddenly shoots far above or plummets far below this predicted range.
At its core, GA4's machine learning is constantly asking one question: "Based on everything I know about your past performance, is this current data point statistically surprising?" An alert only goes out when the answer is a definitive "yes."
This approach is leagues better than setting static thresholds, which can become useless overnight or completely miss the mark during seasonal shifts or periods of growth. The machine learning model adapts, continuously refining its picture of your normal operations.
Pinpointing the Problem with Segmentation
An alert like "Revenue is down 30%" is a good start, but it’s not exactly actionable. This is where GA4's ability to segment its analysis really shines. The system doesn't just look at the big picture; it runs its anomaly detection models across different dimensions to help isolate exactly where the problem is coming from.
For instance, the system might discover that the revenue drop is only happening for users on Android devices, or maybe it’s confined to a specific marketing campaign. That insight immediately narrows down your investigation, turning a vague alarm bell into a targeted clue.
- By Traffic Source: Is the issue tied to a sudden drop in organic search traffic, or did a paid ad campaign go sideways?
- By Country: Is a checkout bug only affecting customers in one specific region?
- By Device: Did a recent app update break a key feature on iOS but not on desktop?
For global businesses in markets like North America and APAC, where e-commerce is projected to hit 25% of retail by 2025, GA4 runs these analyses weekly. It normalizes metrics by user segments and uses sophisticated models like Isolation Forest and ARIMA to spot subtle time-series shifts. This layered approach is known to detect 30-40% more nuanced irregularities than simple thresholds ever could, catching things like data loss from ad-blockers. You can read more about these advanced AI techniques and their impact.
By breaking the problem down, GA4 helps you connect the dots much faster. This intelligent segmentation is what transforms a simple data alert into a powerful diagnostic tool, pointing your team in the right direction to find and fix the root cause before it does real damage.
How to Set Up and Customize Anomaly Alerts
Knowing GA4 can spot anomalies is one thing, but actually putting that feature to work is another. Luckily, setting up your own custom alerts is a straightforward process that turns the platform’s passive intelligence into an active watchdog for your business. This is where you move from theory to practice, telling GA4 exactly what to look for and when to tap you on the shoulder.
It all starts in the Insights section of your GA4 property. Think of this as the command center for both Google's automated discoveries and the custom alerts you build. Instead of waiting for a big red flag to pop up on your dashboard, you can proactively tell GA4 what keeps you up at night.
Creating Your First Custom Alert
To get started, head over to your Advertising or Reports snapshot and look for the Insights card. From there, you can create a new custom insight—that’s just GA4’s term for an alert. The setup screen gives you a few key levers to pull that will define how your alert behaves.
Here’s a look at the creation screen where you’ll lay out the rules for your alert.
This little interface is your control panel. It’s where you define what GA4 should monitor, how often it should check, and what qualifies as a problem.
The core steps are simple but powerful:
- Set Evaluation Frequency: You can tell GA4 to check your data hourly, daily, weekly, or monthly. Daily is a great starting point for most of your core metrics.
- Select a Segment: By default, it’s set to "All Users," but you can get more specific. Want to only watch mobile users or traffic from a certain country? You can do that here.
- Choose the Metric: This is the most important step. Pick the metric you care about, whether it’s ‘Conversions,’ ‘Total revenue,’ or a specific event count like ‘purchase.’
- Define the Condition: Now, tell GA4 what to look for. Common conditions include "Has anomaly," "Is less than," or "Increases by more than %."
For a deeper dive into practical setups, you can explore our guide on creating powerful GA4 alerts for real-time monitoring, which offers some extra strategies.
Fine-Tuning Alert Sensitivity
Once you set a condition like "Has anomaly," GA4 rolls out a crucial setting: sensitivity. Think of it like adjusting a smoke detector in your house. Set it too high, and it goes off every time you make toast. Set it too low, and it might not catch a real fire until it's too late.
Choosing the right sensitivity level is a balancing act between being informed and being overwhelmed. The goal is to create alerts that are meaningful signals, not just noise.
You’ll typically see three levels to choose from:
- High Sensitivity: This setting will flag smaller, more subtle deviations from the norm. It’s perfect for absolutely critical metrics like revenue or purchase completions, where even a tiny, unexpected dip is worth investigating immediately. Just be ready for more frequent alerts.
- Medium Sensitivity: This is the default and a solid choice for most of your important metrics, like user sign-ups or lead form submissions. It hits a sweet spot, flagging significant changes without crying wolf over minor fluctuations.
- Low Sensitivity: Use this for less critical or naturally volatile metrics, like total sessions or page views. It will only bother you for major, undeniable shifts in the data, saving you from a flood of notifications for normal ups and downs.
By carefully picking the right metric, condition, and sensitivity, you can build a custom GA4 anomaly detection system that proactively guards your most important business outcomes. This transforms GA4 from a simple reporting tool into a vigilant co-pilot, making sure you’re the first to know when something needs your attention.
How to Interpret GA4 Alerts and Find the Root Cause
Getting an automated alert from GA4 is just the beginning. The real work starts with what you do next—turning that vague signal of “something is wrong” into a specific, actionable insight. A good investigation bridges the gap between detection and resolution, transforming a simple data point into a clear diagnosis.
Let's say you get a daily alert: your ‘add_to_cart’ event count has tanked by 40%. It’s easy to panic, but a structured approach will get you answers much faster. Instead of jumping to conclusions, your goal is to methodically rule out possibilities using the data right there in GA4.
Think of yourself as a detective. The alert is your first clue, but you need more evidence to crack the case. The first question to always ask is, "Where is this happening?" GA4's drill-down capabilities are your best friend here.
Beginning the Investigation
Your first stop should be GA4’s Explorations report, where you can start slicing and dicing the data to dissect the anomaly. By applying different dimensions as filters, you can see if the drop is isolated to a specific segment of your audience. This is how you start to zero in on the problem.
Here’s a quick checklist of segments to investigate:
- Device Category: Is the drop only happening on mobile, or is it hitting desktop and tablet users too? A mobile-only problem could point to a recent app update or a snag in your responsive design.
- Browser: Is the issue specific to Chrome, Safari, or Firefox? Browser-specific bugs often crop up after a new code push with JavaScript incompatibilities.
- Geography: Are users in a certain country or region the only ones affected? This could signal problems with language versions, local payment gateways, or regional server issues.
- Traffic Source: Is the drop tied to a specific marketing campaign? Maybe a new ad is driving unqualified traffic, or a change to an affiliate link broke your UTM parameters.
Layering these dimensions helps you move from a broad, overwhelming problem to a much more focused one. For instance, you might find that the ‘add_to_cart’ drop is almost entirely coming from users on iOS devices who came from a specific social media campaign. Now you've got a solid lead to follow.
The following flowchart offers a simple decision tree for setting the right sensitivity for your alerts. This is a crucial step because it directly impacts the quality of the signals you'll be investigating.
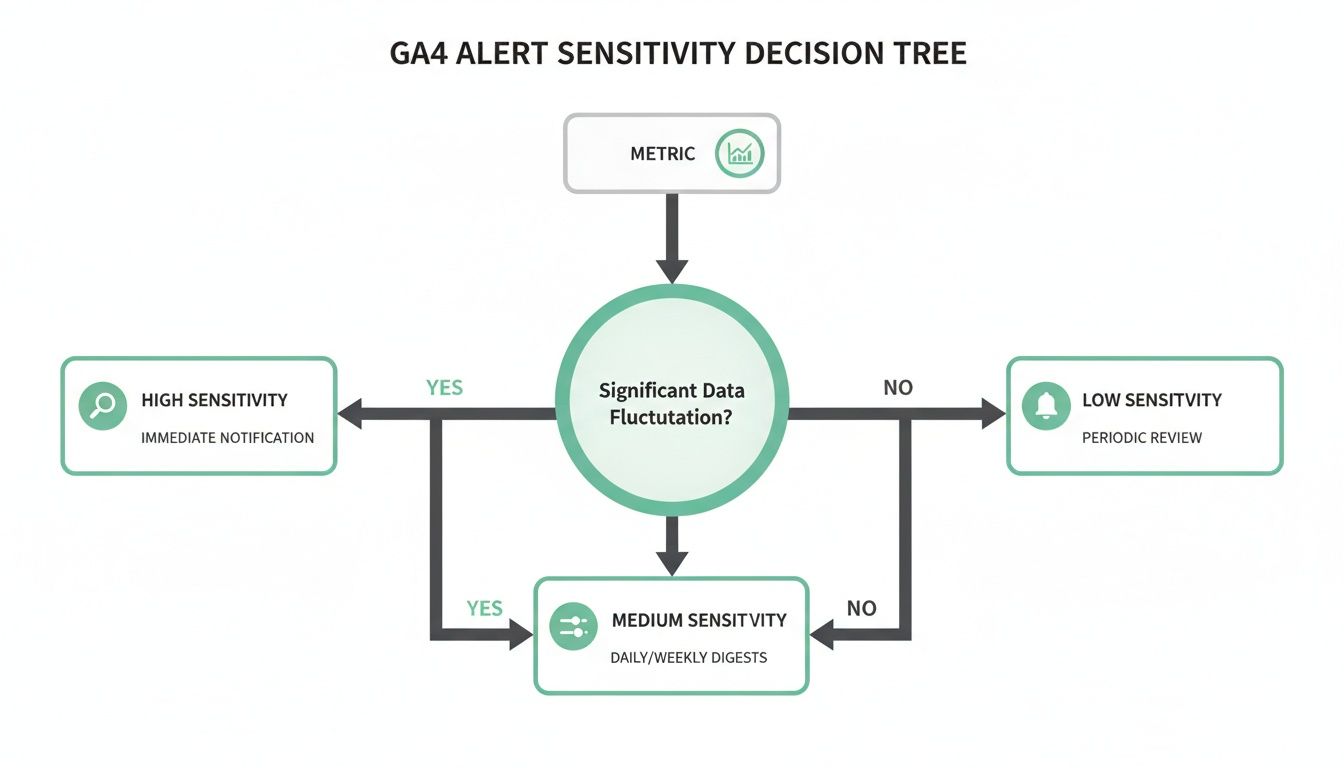
This visual guide helps you align the alert's sensitivity with how important the metric is to your business, making sure you only spend time on anomalies that truly matter.
Connecting the Dots: A Quick Reference
To speed up your troubleshooting, it helps to have a mental map of common anomalies and their likely culprits. Here’s a quick-reference table to connect the dots faster.
This table isn't exhaustive, but it provides a solid starting point for turning a GA4 alert into a focused investigation, helping you get to the "why" much quicker.
Correlating Data with Business Activities
After you’ve figured out the "where," the next step is to understand the "when" and "why." Analytics data doesn't live in a bubble; it's a direct reflection of your business activities. It's time to cross-reference the anomaly's timing with what was happening internally.
Pull up your team's calendars and logs:
- Code Deployments: Did your developers push a website or app update right before the numbers went sideways?
- Marketing Launches: Did a new ad campaign or email blast go live?
- CMS Changes: Was content on key pages, like your product detail pages, updated recently?
Let’s go back to our example. By comparing the iOS-specific drop with your deployment schedule, you see a new app version was released just hours before the anomaly kicked off. Your hypothesis is now sharp and clear: "The latest app update is likely causing checkout failures on iOS devices."
When an anomaly triggers an alert, knowing how to manage the investigation and resolution is crucial. Brushing up on incident management best practices can provide a valuable framework for your team.
This systematic approach transforms GA4 anomaly detection from a simple notification feature into a powerful diagnostic framework, helping you find and fix problems before they have a major impact.
The Limits of GA4's Native Anomaly Detection
While GA4 anomaly detection is a genuinely useful feature, it’s important to be realistic about what it can and can't do. Think of it like a security guard watching the front door of a building. They're great at telling you if fewer people are coming in than usual, but they have no idea if a window was left open on the third floor or if the plumbing is leaking in the basement.
The core limitation is simple: GA4 can only analyze the data it actually receives. It has a massive blind spot for all the data that should have been sent but never showed up.
This means GA4 is completely oblivious to the technical implementation errors that stop data from being collected in the first place. It’s brilliant at telling you what happened to your metrics but often leaves you guessing about the technical why.
What GA4's Anomaly Detection Cannot See
GA4’s machine learning is powerful, but its vision is limited to the data that successfully lands on Google's servers. It can’t warn you about the critical, underlying implementation issues that cause data to go missing before it's even processed. This is where many teams get a false sense of security.
Here are a few common blind spots:
- Broken or Missing Tracking Code: A new website release accidentally strips the GA4 tag from your checkout or confirmation pages. GA4 won't see a "drop" in data—it will see nothing. No data means no alert.
- Failed Marketing Pixels: GA4 can report on conversion events, but it has zero visibility into whether your Meta Pixel, TikTok Pixel, or other ad platform tags fired correctly alongside them. A broken ad pixel is just wasted ad spend and skewed optimization, which GA4 can't see.
- Consent Manager Issues: Your consent management platform (CMP) is misconfigured and incorrectly blocks tracking scripts for users who actually opted in. GA4 will just report lower traffic, unable to tell you the root cause is a bug in your consent logic.
These scenarios are silent data killers. An audit of over 500 websites found that 15% had revenue discrepancies of more than 10% due to these kinds of client-side tracking failures. While you can learn more about how AI is shaping GA4 analytics to address some gaps, the initial detection of these technical breakdowns often requires more than what GA4 offers on its own.
The Gap Between Metric Anomalies and Technical Root Causes
This is where you see the sharp difference between analytics monitoring and analytics observability. GA4 is excellent at monitoring—watching the final numbers. But it lacks the deep visibility needed for true observability—seeing the entire data pipeline and its implementation health.
GA4 is great at flagging a symptom, like a sudden drop in conversions. But it often leaves you to manually investigate the disease, which could be anything from a broken dataLayer variable to a failed marketing pixel.
For instance, GA4 might alert you to a steep decline in purchase events. Your first move might be to check marketing campaigns or user behavior. You could lose hours digging through GA4 reports, only to find out much later that a developer accidentally changed the price property in the dataLayer from a number to a string, causing the event to be malformed and rejected.
This is the technical context GA4 simply doesn't have. It sees the outcome (fewer purchases recorded) but is completely blind to the implementation error (a broken event schema) that caused it. This gap is what leads to those slow, frustrating, and expensive investigations we all dread.
Introducing Analytics Observability
To close this gap, teams need another layer of monitoring focused entirely on the health and integrity of the data implementation itself. This is where a dedicated analytics observability platform like Trackingplan comes in.
An observability tool works upstream from GA4. It isn't just looking at the final numbers in a dashboard; it monitors your entire tracking setup in real-time. Think of it as a QA engineer that never sleeps, constantly validating that your tracking code, events, properties, and marketing pixels are all firing exactly as designed.
When you pair GA4's metric-level alerts with an observability platform, you finally get the complete picture. GA4 tells you what metric changed, and a tool like Trackingplan instantly tells you the technical reason why—bridging that critical gap between detection and diagnosis.
Achieving Full Data Observability with Trackingplan
Pairing GA4’s metric-level alerts with a dedicated implementation monitoring tool like Trackingplan creates a truly complete data quality solution. This combination connects the what (the metric anomaly popping up in GA4) with the all-important why (the technical error that caused it). The result? Full data observability.
Let's walk through a practical scenario. Imagine GA4 sends an alert flagging a jarring 50% drop in revenue. Almost at the same time, Trackingplan pings you on Slack, pinpointing that the price property in your purchase event is suddenly returning as 'undefined' right after the latest code deployment.
Instead of a frantic, hours-long investigation pulling in multiple teams, you've nailed down the exact root cause in minutes. That’s the power of this two-layered approach.
From Reactive Problem Solving to Proactive Governance
GA4’s native anomaly detection is a fantastic first line of defense, but it's inherently reactive. It tells you a problem has already impacted your KPIs. An observability platform, on the other hand, works proactively by monitoring the health of the implementation itself to catch issues before they ever corrupt your data.
This means you get real-time alerts on the technical gremlins that GA4 can't see:
- Schema Changes: Get an alert when an event property's data type changes out of the blue (e.g., from a number to a string).
- Missing or Rogue Events: Receive notifications if a critical event like
add_to_cartsuddenly stops firing or an unexpected event appears. - Broken Marketing Pixels: Validate that your ad platform tags are firing correctly right alongside your analytics events.
This level of monitoring ensures the data flowing into GA4 is clean, accurate, and complete from the start.
By combining GA4’s metric alerts with Trackingplan’s implementation monitoring, you create a powerful feedback loop. One system spots the business impact, while the other provides the immediate technical diagnosis.
This combo transforms your team from reactive problem-solvers into proactive guardians of data integrity. By enhancing data observability with tools like Google Tag Manager, you build a robust system that catches both implementation errors and their resulting business impact. It ensures every alert is actionable, turning a potential crisis into a quick, targeted fix and protecting the reliability of your insights.
GA4 Anomaly Detection: Your Questions Answered
Jumping into any new analytics feature brings up a few questions. Let's clear the air on some of the most common ones about GA4's anomaly detection so you can get the most out of it.
How Much Data Does GA4 Need to Spot Anomalies?
Before GA4 can tell you what’s weird, it first has to learn what’s normal. This "training period" is key. While Google hasn't given an official number, you should aim for a solid 30-90 day period of consistent data.
Think of it like this: the model needs enough time to see your daily ebbs and flows, your weekly patterns, and even your monthly cycles. The more clean, historical data it has, the smarter it gets. If you've just set up a new GA4 property, give it some time to learn before you start relying on these alerts.
Can I Get Anomaly Alerts for Any Metric?
Pretty much, yes. You can set up custom alerts for most of the core metrics and dimensions you find in the 'Insights' and 'Explorations' reports. This covers the heavy hitters like users, sessions, conversions, and revenue, but you can also monitor specific event counts.
Just keep in mind that this feature works best with metrics that have a steady, predictable volume. The statistical models need a decent amount of data to work with. If you try to monitor a metric that only gets a few hits a day, you’ll likely end up with a lot of noise and not much signal.
Why Am I Getting So Many False Positive Alerts?
This is a classic issue, and it usually boils down to one of two things. First, your alert sensitivity might be cranked up too high. If it's flagging every little hiccup, try dialing the sensitivity down to 'Medium' or 'Low', especially for less critical metrics.
The other common culprit is a genuine, but sudden, change in your business. Did a marketing campaign just go viral? The model hasn't learned that this new firehose of traffic is your "new normal" yet. As this trend continues and becomes part of your data history, the system will adapt and those false positives should settle down.
Will GA4 Tell Me if My Tracking Code Breaks?
No, and this is a massive distinction to understand. GA4 anomaly detection is brilliant at analyzing the data it receives. But if your tracking code breaks, gets removed from a page, or just plain fails to fire, then no data gets sent to Google in the first place.
GA4 can't analyze data it doesn't have, so it will never trigger an alert for a complete data blackout. It can tell you if conversions dropped based on the events it did log, but it's blind to the data that went missing entirely. To actually monitor the health of your tracking implementation, you need a proper data observability tool watching over it.
Ready to bridge the gap between GA4’s metric alerts and the technical root cause? Trackingplan provides complete visibility into your analytics implementation, sending real-time alerts on broken tracking, schema errors, and pixel failures so you can fix issues before they impact your data. Ensure your analytics are always accurate by exploring what Trackingplan can do for you.


.avif)


