
Discover how to debug Adobe Analytics with expert tools and workflows. Learn to quickly identify and resolve data issues with our practical, step-by-step guide.
To debug Adobe Analytics effectively, you have to start with one simple principle: see the data in motion. This means you need to intercept and translate the tracking beacons your site sends to Adobe's servers before you can figure out what's wrong. The whole process boils down to inspecting network requests in your browser and using a debugger to make sense of the cryptic data being fired.
Your Essential Adobe Analytics Debugging Toolkit
Before you can fix broken analytics, you have to assemble your digital detective kit. Just like a mechanic needs wrenches and diagnostic scanners, an analyst needs specific tools to see what’s happening under the hood. Without them, you’re just flying blind, guessing why your reports look off.
The good news? The most critical tools are free and easy to find. Your debugging journey really begins with two things: your browser's built-in developer tools and a specialized browser extension made for the Adobe Experience Cloud. Getting comfortable with these is non-negotiable for anyone who’s serious about data quality.
Browser Developer Tools: The First Checkpoint
Every modern browser—Chrome, Firefox, Edge, Safari—comes packed with a powerful suite of "Developer Tools." For an analyst, the most valuable piece of this is the Network tab. This is where you can watch every single piece of data your website sends and receives in real-time.
To start debugging, you can filter these requests to isolate only the signals being sent to Adobe Analytics, often called "beacons" or "server calls." By digging into the details of these requests, you see the raw data payload, including all the props, eVars, and events your site is trying to track. Sure, the raw format is cryptic, but it's the ultimate source of truth. If it’s not in the network request, Adobe never received it.
The Adobe Experience Platform Debugger
While the network tab shows you the raw data, it’s not exactly user-friendly. This is where the Adobe Experience Platform Debugger browser extension becomes your best friend. This tool intercepts the same network requests but translates them into a clean, organized, and human-readable format.
Here's a glimpse of how it lays everything out, making it much easier to spot issues at a glance.
As you can see, the debugger neatly organizes information into tabs like "Solutions," "Events," and "Data," giving you a clear view of your implementation's health.
This extension instantly tells you:
- Which Adobe solutions (Analytics, Target, etc.) are active on the page.
- The specific variables and events being sent with each tracking call.
- The version of your Adobe libraries.
- Details about your Experience Cloud ID service.
It's an indispensable tool that dramatically speeds up the process of figuring out how to debug Adobe Analytics. It serves a massive community, with over 30,000 users globally. Interestingly, this powerful tool also flags that 28% of implementations are configured with improper data collection servers, which just goes to show how common simple setup errors can be. You can find more details and install the Adobe Debugger from the Chrome Web Store.
To get a clearer picture of when to use which tool, here’s a quick comparison of the essentials.
Core Adobe Analytics Debugging Tools Comparison
These manual tools form the foundation of any debugging workflow. Mastering them is the first step toward ensuring your data is clean and reliable.
Pro Tip: One of the most common frustrations is when the debugger switches from a development environment to production as you navigate between pages. You can use the "Lock" icon next to the tool version in the AEP Debugger to lock it into your development library, ensuring consistent testing across your entire user journey.
Ultimately, getting comfortable with these tools is the foundational step. For those looking to expand their toolkit even further, we've put together a guide on the top Chrome extensions for Adobe Analytics that can help. However, your debugging workflow will always start with the browser's network panel and the AEP Debugger.
Executing a Manual Debugging Workflow
Having the right tools is one thing, but knowing how to use them methodically is what separates the pros from the amateurs. A structured debugging workflow can turn a chaotic data fire drill into a clear process of elimination. It’s all about tracing the problem from a vague symptom, like "my campaign data is missing," all the way to a specific, fixable root cause.
Let's walk through a classic scenario: a new marketing campaign just went live, but you're not seeing any of the conversion events show up in your reports. The pressure is on. Instead of randomly poking around, you need a repeatable process to follow the data from the user's browser right to Adobe's collection servers.
Simulating the User Journey
First things first, you have to put yourself in the user's shoes. The goal is to replicate the exact path that should be generating the data you're missing. Don't just load the landing page and call it a day; you need to simulate the entire journey from start to finish.
- Start at the source: Grab the exact campaign URL, complete with all its UTM or CID parameters.
- Act like a real user: Click the calls-to-action, fill out the forms, and trigger the conversion events just as a customer would.
- Keep your tools open the whole time: Have the AEP Debugger and your browser's network tab running from the very beginning to capture every single interaction.
This approach creates a controlled environment where you can watch the data flow in real-time. It helps you answer the most fundamental question: is the tracking beacon even firing when the conversion happens?
Inspecting the Data Payload
Once you’ve triggered the event, it’s time to put on your detective hat. Your prime suspect is the network request—the "beacon"—sent to Adobe at the moment of conversion. The AEP Debugger is your magnifying glass here, letting you dissect the request and validate everything inside.
You’re hunting for answers to a few key questions:
- Is the Campaign ID present? Look for your
s.campaignvariable (or its corresponding eVar) and confirm it's populated with the correct tracking code. - Did the conversion event fire? Check the
eventsvariable for your designated success event, likeevent10for a form submission. - Are other variables correct? Make sure related props and eVars, such as product names or form IDs, were also captured properly.
This is where manual debugging really shines. You get to see exactly what data was sent—and more importantly, what was missed. A common find is seeing a page view beacon fire successfully, but the conversion event is completely absent from the events string. That’s a huge clue that points you directly toward your tag management setup.
The process generally flows from the browser, to the debugger, and finally to data analysis.
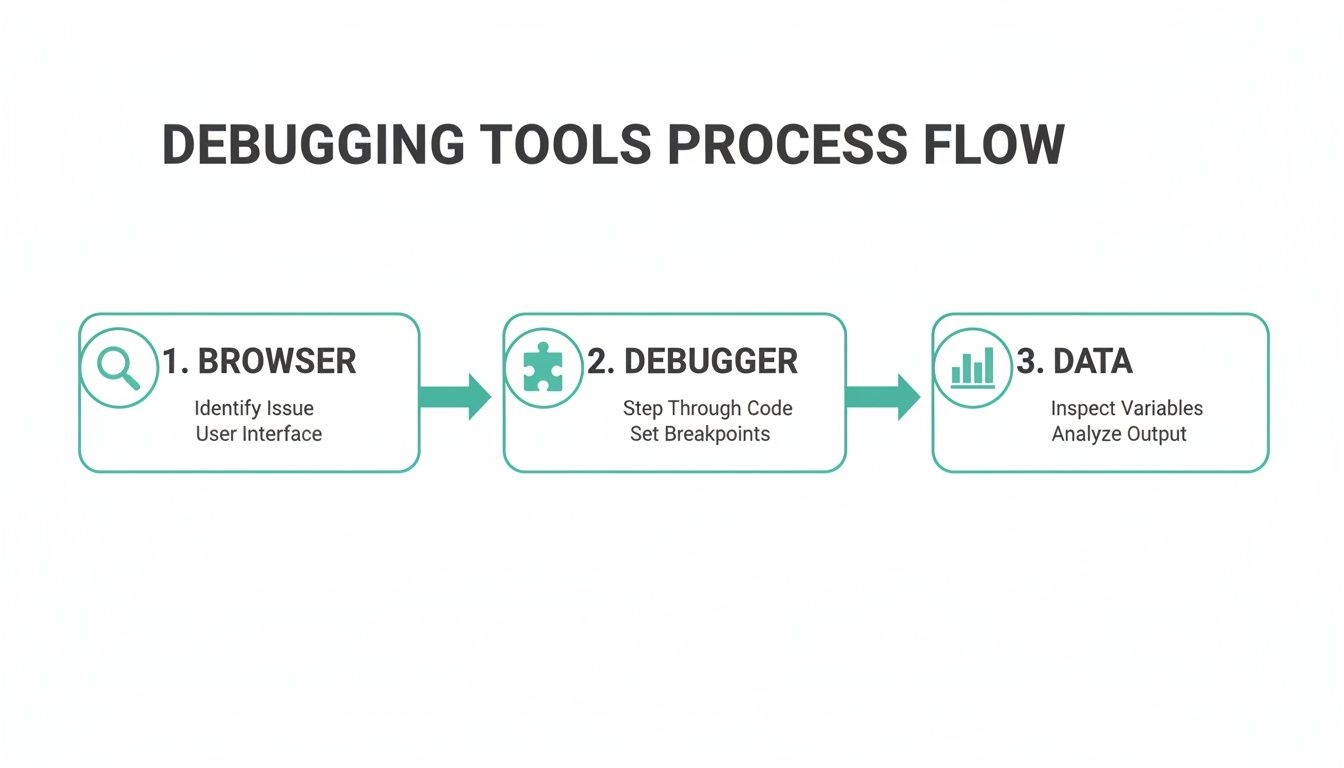
This workflow shows how each tool gives you a different layer of visibility, starting with the user's action and ending with the data payload itself.
Diving into Adobe Launch and the Data Layer
If the debugger shows that your variables are missing or just plain wrong, your investigation moves upstream to your tag management system, most likely Adobe Launch. This is where the implementation logic lives, and it’s a hotspot for issues.
Inside Launch, you need to find the specific rule that's supposed to fire on that conversion. Open your browser's developer console and start sprinkling console.log() statements within your rule's custom code blocks. This is how you "watch" the rule execute in the wild.
Expert Tip: I always start by putting
console.log('Rule Firing: Lead Gen Form');at the very beginning of a rule. Then, right before the Adobe variables are set, I’ll addconsole.log('Data Element Value:', _satellite.getVar('Campaign ID'));. This instantly tells me two things: is my rule even running, and what value does my data element hold at that exact moment?
This little trick is a lifesaver for diagnosing timing issues, which are especially common in single-page applications (SPAs). You’ll often find that a rule fires before the data layer has been updated, leading to empty variables. Console logging makes these timing conflicts immediately obvious.
In recent releases, Adobe Analytics has rolled out over 50 documented fixes for debugging challenges, like issue AN-324163 where custom events weren't firing as expected. A quick way to troubleshoot this is with the Chrome Debugger for Adobe Analytics. It prints all page load data and link events right into the JS console—just press Ctrl+Shift+J (Windows) or Cmd+Option+J (Mac). You can find more details in the official Adobe Analytics release notes.
The Rise of Automated Alternatives
While this manual workflow is an essential skill, it's also time-consuming and purely reactive. You're usually fixing problems after they've already started corrupting your data. This is exactly why many teams are now looking toward automated observability platforms.
Tools like Trackingplan offer an automated alternative by providing 24/7 monitoring of your entire analytics implementation. Instead of you having to manually run through user journeys, these platforms automatically detect when a campaign tracking code goes missing or an event fails to fire. They can send you real-time alerts that pinpoint the root cause, saving you from the manual hunt. It’s a shift from being a reactive data firefighter to a proactive guardian of data quality.
Solving Common Adobe Analytics Implementation Errors
Even the most seasoned analysts run into the same handful of frustrating implementation errors. These issues can silently corrupt your data, leading to skewed reports and poor business decisions. Knowing what to look for is half the battle; this is your field guide to identifying and fixing the most frequent culprits before they cause serious damage.
We'll move beyond just checking if a tag fires and get into the nitty-gritty problems that plague analytics setups. From inflated visitor counts to broken conversion funnels, understanding the root cause is the key to a quick resolution.
Missing or Duplicated Page View Calls
One of the most common—and impactful—errors is an incorrect page view count. This usually shows up in two ways: either page views are missing entirely, or they're firing multiple times on a single page load.
When the s.t() (page view call) is missing, especially on single-page applications (SPAs), entire user interactions become invisible. Your visit and visitor counts will plummet, and pathing analysis becomes useless. On the flip side, duplicated calls—often caused by conflicting rules in Adobe Launch—will artificially inflate your traffic metrics, making your site look way more popular than it really is.
The fix involves a careful audit of your Launch rules. Make sure your primary page view rule fires only once per logical page view. Use the right event triggers, like "Library Loaded (Page Top)" for traditional sites or custom history change events for SPAs.
Incorrect Campaign Tracking and Attribution
Another frequent headache is when campaign tracking codes fail to populate their designated variables. You might see traffic attributed to "Typed/Bookmarked" or "Referring Domains" when it should really be credited to a specific paid search or email campaign.
This usually happens for a few reasons:
- Timing Issues: The campaign tracking parameter is read from the URL before it's actually available, resulting in an empty value.
- Redirects: A redirect strips the tracking parameters from the URL before your analytics code can grab them.
- Incorrect Variable: The tracking code is being put in the wrong eVar or prop, or it's being overwritten by another rule later in the execution order.
Use the AEP Debugger to inspect the landing page and confirm that your campaign variable (e.g., s.campaign or a dedicated eVar) contains the correct tracking code on the very first beacon. If it's empty, your investigation should start with the URL and your Launch data element configuration.
Key Insight: Always check the "Original URL" in your debugger. Sometimes what you see in the browser's address bar isn't what the analytics library saw when it first loaded, especially after redirects. This discrepancy is a primary source of campaign attribution issues.
Broken Event Serialization
For tracking multi-step funnels, like a checkout process, event serialization is critical. This feature ensures that a user can only get credit for event2 if they have already completed event1. When it's broken, users might appear to enter a funnel midway through, making your conversion rate data completely unreliable.
A common mistake is failing to set the unique purchase ID or transaction ID in the purchaseID variable. Without this unique identifier for each session, Adobe Analytics can't correctly serialize the events tied to that specific transaction. Always verify that a unique ID is generated and passed into the purchaseID variable at the start of the funnel and persists through every step.
I've put together a quick-reference table to help you spot and squash these common bugs even faster. Think of it as a first-aid kit for your analytics implementation.
Troubleshooting Common Adobe Analytics Implementation Errors
This table doesn't cover every possibility, of course, but it handles a surprising number of the day-to-day issues that crop up.
Debugging on Mobile Applications
Debugging on mobile apps requires a slightly different toolkit. You can't just open a browser's developer tools. Instead, you need to enable verbose logging within the Adobe Mobile SDK for iOS or Android.
This setting prints detailed analytics information directly to the device's console log, which you can view in Xcode for iOS or Logcat for Android. It shows you every lifecycle metric, state change, and action being tracked. Recent data shows that enabling SDK debug logging can cut down the 10+ hours developers waste weekly on manual audits by as much as 50%.
In fact, research into how to debug Adobe Analytics reveals that around 68% of data quality issues come from pixel misfires or consent misconfigurations. Many of these issues can be spotted early by enabling more detailed logging. For more on recent fixes and updates that can affect debugging, you can read the latest Adobe Analytics platform release notes.
The Automation Advantage with Trackingplan
Manually checking for these common errors is a necessary but inefficient grind. It’s reactive, meaning you're often fixing problems only after they’ve already corrupted your data. This is where an automated alternative like Trackingplan gives you a massive advantage.
Instead of you having to manually simulate user journeys to find duplicated page views or missing campaign codes, Trackingplan monitors your implementation 24/7. It automatically detects when an event fails to fire or when a critical variable is empty, sending you real-time alerts that pinpoint the exact cause of the problem. This proactive approach turns debugging from a time-consuming chore into a streamlined, automated process, allowing your team to trust the data without constant manual validation.
Automating Analytics QA with Observability Platforms
Manual debugging is a core skill for any analyst. There's no substitute for being able to trace a single user journey and pick apart individual tracking beacons to see what’s going on. But let’s be honest—this approach has a huge limitation: it’s entirely reactive and just doesn’t scale. You can't possibly test every page, on every device, for every user path, all day, every day.
This is where the real headache of learning how to debug Adobe Analytics comes in. You’re almost always fixing problems after they’ve already started poisoning your data, leading to skewed reports and eroding trust from stakeholders. While you’re busy putting out one fire with a broken campaign, three other issues could be silently causing chaos somewhere else. This constant firefighting is draining and wildly inefficient.
To break out of this cycle, teams are now shifting from spot-checking to continuous, automated monitoring. This is the world of analytics observability platforms, a modern approach built for proactive, 24/7 quality assurance across your entire analytics setup.
Shifting from Reactive Fixes to Proactive Governance
An analytics observability platform is like a dedicated security guard for your data, constantly watching every single event and property being sent to Adobe Analytics. Instead of you having to hunt for errors, the platform spots them in real time and tells you about them instantly.
Here's a simple way to think about it: manual debugging is like reviewing security camera footage after a break-in to figure out what happened. Analytics observability is like having a live alarm system that notifies you the second a window is broken, telling you exactly which window and how it happened.
This proactive stance completely changes your workflow. You stop being a data janitor, cleaning up messes after the fact, and become a data guardian, preventing them from happening in the first place.
How Automated Observability Works
Platforms like Trackingplan integrate with your site or app through a simple tag or SDK. Once it’s in place, it gets to work automatically discovering and mapping out your entire analytics implementation. Every event, every variable, every marketing pixel—it all gets documented into a comprehensive and always-current tracking plan.
From that point on, the system continuously monitors the live data stream, comparing it against that validated plan. It automatically flags a wide range of critical issues that are nearly impossible to catch manually at scale:
- Missing or Rogue Events: Get alerts when a critical conversion event fails to fire or when developers push unauthorized "rogue" events that pollute your data.
- Schema Deviations: Find out immediately if an event is sent with missing properties or if a property's data type suddenly changes (e.g., a number becomes a string), which can completely break your reports and downstream tools.
- Campaign Tagging Errors: Validate that UTM and CID parameters are following your company's naming conventions, catching typos and inconsistencies before they destroy your attribution models.
- PII & Privacy Leaks: Scan data payloads for personally identifiable information (PII) like emails or phone numbers being sent to analytics tools, which would violate privacy policies like GDPR and CCPA.
A Real-World Scenario: Imagine a developer accidentally changes the data type of the
productPriceeVar from a number to a string during a routine website update. Manually, you might not catch this for weeks—not until your revenue reports look completely off. An observability platform would spot this schema mismatch on the very first user session after the deployment and send an immediate alert pinpointing the exact error.
This level of detail is a game-changer. For a deeper look at this approach, you can learn more about what an automated marketing observability guide looks like in practice.
The Power of Automated Root-Cause Analysis
The biggest time-suck in manual debugging isn't just finding an issue; it's tracing it back to the source. An error in Adobe Analytics could start in the data layer, a rule in Adobe Launch, or a server-side process. That investigation can burn hours of back-and-forth between teams while you dig through code.
Automated platforms slash this time dramatically. When an alert fires, it doesn’t just tell you what broke; it gives you the context to understand why. Alerts often come packed with:
- The exact page URL where the error happened.
- The specific event or tag that failed.
- A "diff" view showing what the data was supposed to look like versus what was actually sent.
- Traffic volume data to help you prioritize the fix based on how many users are affected.
This kind of detailed, automated root-cause analysis means you can create a ticket for the development team with all the necessary information already included. This cuts the time-to-resolution from days down to minutes. It frees up your team to trust the data and focus on finding strategic insights, not on endless manual validation.
Your Practical Troubleshooting Checklist for Reliable Data

Sure, manual debugging and automated monitoring are powerful. But a repeatable process is what truly guarantees consistent data quality over the long haul. This checklist pulls everything together into a practical workflow you can lean on for any validation, whether you're launching a small campaign or QA'ing a full site redesign.
Think of this as your pre-flight check before you bet your decisions on the data. Running through these questions helps build a habit of diligence that catches errors before they mushroom into bigger problems. This systematic approach is a massive part of learning how to debug Adobe Analytics efficiently.
Pre-Launch and Basic Setup Validation
Before you even start looking at specific user actions, you have to confirm the foundation is solid. Get these basics wrong, and every other piece of data you collect will be built on sand.
- Adobe Launch Library Check: Is the right Launch library loading? Check if it's dev, staging, or prod. You can quickly see this in the Adobe Experience Platform Debugger.
- Report Suite ID: Look at the analytics beacon. Does the report suite ID match the one you're expecting data in? This is probably the most common reason for data "going missing."
- Experience Cloud ID Service: Is the Marketing Cloud ID (MCID) service firing correctly? This is absolutely critical for stitching visitors across devices and making sure your integrations with other Adobe solutions work.
Page Load and Initial Data Layer Integrity
Once you've confirmed the core setup is good to go, it's time to inspect what happens on the initial page load. This is your very first chance to spot data discrepancies.
Key Takeaway: The state of your data layer on page load is the source of truth. If the data isn't present and correctly formatted right there and then, it has zero chance of making it into your reports accurately.
- Page Name Population: Is the
s.pageNamevariable populated with a clean, consistent value? - Data Layer Objects: Are all the data layer objects you expect (like
digitalDataorpageData) actually available in the browser's console when the page is done loading? - Props and eVars: On that very first beacon, are your initial session-level eVars and page-level props (think page type, site section, etc.) capturing the right information?
User Interaction and Event Tracking
Now for the fun part: testing the dynamic pieces of your implementation. You need to put on your user hat and simulate real journeys to make sure key actions are tracked correctly. This is where you'll find most of your conversion-related bugs.
- Click Event Validation: When a user clicks a key call-to-action, does an
s.tl()(link tracking) call fire? Keep the debugger open and watch for that specific beacon. - Conversion Events: On a form submission or a purchase confirmation, is the correct success event (e.g.,
event1,scAdd) showing up in theeventsvariable? - Variable Persistence: Are eVars set on one page sticking around correctly on the next pages in the user's journey? Click through a full funnel and check the debugger on each step.
- SPA Navigation: If you're on a single-page application, does a fresh
s.t()(page view) call fire with an updated page name for each "virtual" page view?
Making this checklist a standard part of your team's QA process will pay dividends. It’s definitely a manual effort, but it's a vital complement to automated platforms like Trackingplan, which can handle the 24/7 monitoring for you. Together, they create a seriously robust defense against bad data.
Frequently Asked Questions About Debugging
Even with the best tools and checklists, certain questions always seem to pop up when you're in the trenches debugging Adobe Analytics. Here are some quick, clear answers to the ones I hear most from analysts and developers.
What Is the Fastest Way to See If My Adobe Analytics Tags Are Firing?
The quickest method is to grab a browser extension like the Adobe Experience Platform Debugger. It's a lifesaver.
Once you have it installed, just open it on your site and click over to the "Adobe Analytics" tab under Solutions. If you see network requests popping up with a green 200 status code, you're in business—your tags are firing successfully. The extension instantly translates the raw beacon into a readable format, showing you exactly which variables and events were sent on their way.
Why Does My Data Show Up in the Debugger but Not in My Reports?
Ah, the classic mystery. This happens all the time, and it usually comes down to one of a few things.
First, check for filters in your Adobe Workspace project or look for any Virtual Report Suite settings that might be quietly excluding the data you're looking for. It's an easy thing to overlook.
Second, double-check that the report suite ID you see in the debugger exactly matches the one you're looking at in your reports. A simple typo can send data into the void.
Finally, it's time to investigate the processing rules in the Admin console. These rules can alter or even drop data before it ever makes it into your reports. And don't forget to give it a little time—there's often a 30-60 minute latency before data shows up.
How Do I Debug Adobe Analytics on a Single-Page Application?
For single-page applications (SPAs), you can't just check the initial page load and call it a day. The real work is monitoring what happens after that.
The key is to keep an eye out for subsequent s.t() (page view) and s.tl() (link click) calls as users navigate between different views in the app. Use the debugger to watch the network requests as you click around. You need to make sure your Adobe Launch rules are triggered by custom events or data layer pushes tied to each view change, not just the default "Library Loaded" event.
A common mistake in SPA debugging is assuming the data layer updates instantly. Always use your browser's console to log data element values right before your
s.t()call fires to confirm the data is available at the exact moment of tracking.
Why Use the Adobe Debugger Instead of the Browser Network Tab?
While the browser's network tab is the ultimate source of truth, it shows you a raw, unformatted request URL. It's a jumbled mess of cryptic query parameters like 'v1', 'c2', and 'e1' that's incredibly difficult and time-consuming to decipher.
The Adobe Debugger extension intercepts that exact same request but translates it into a clean, human-readable report. It clearly labels variables like eVar1, prop2, and event1, saving you a ton of time and dramatically reducing the chance of misinterpreting what's being sent. It just makes the whole process faster and less error-prone.
Manually chasing down these issues is a crucial skill, but it’s reactive and doesn't scale. Trackingplan offers a proactive, automated alternative by continuously monitoring your entire analytics implementation. It detects errors in real time, so you can fix issues before they impact your data. Learn more about how you can achieve reliable, trusted data with automated observability at https://trackingplan.com.