Learn how to improve data quality with our guide. Fix tracking errors, establish solid governance, and automate QA for analytics you can finally trust.
Improving data quality isn't just a technical exercise. It’s a full-on strategic shift that moves you from putting out data fires to building a culture where clean, reliable data is the norm. The end goal? Trustworthy analytics that lead to confident decision-making.
The True Cost of Bad Data and Why It Matters Now
Ever been in a meeting, presenting a report, only to have someone poke a hole in your numbers right there on the spot? It’s a sinking feeling, and it’s where the abstract concept of "bad data" becomes a painful reality. This isn't about messy spreadsheets; it's about the slow erosion of trust and the snowball effect of decisions made on shaky ground.

This isn’t a rare problem. In fact, it's costing businesses a fortune. Research shows that organizations are losing an average of $12.9 million every year because of poor data quality. This elevates the issue from an IT task to a critical business function with serious financial consequences.
Real-World Consequences for Analytics and Marketing
When your data is off, the fallout hits your marketing and analytics teams first and hardest. These aren't just hypotheticals—they are quiet growth killers I’ve seen happen time and time again:
- Misallocated Marketing Budgets: Broken UTM parameters or sloppy campaign naming can make your best-performing channel look like a dud. The result? You cut spending on what’s actually working.
- Skewed A/B Test Results: Rogue events or inconsistent tracking fire across test variations and completely invalidate your findings. You could end up rolling out a "losing" feature because the data lied.
- Loss of Confidence in Dashboards: When leaders keep finding gaps between your analytics reports and the actual financial statements, they stop believing any of it. Suddenly, everyone's back to making decisions on gut feelings.
Poor data quality isn't just an inconvenience; it's a silent tax on every decision your organization makes. It creates inefficiency, wastes resources, and undermines the very purpose of collecting data in the first place.
Shifting from a Chore to a Business Imperative
To get a real handle on data quality, you have to stop seeing it as a chore and start treating it like a strategic advantage. Clean data is the foundation for every successful marketing campaign, product launch, and business strategy.
Getting this right is how you prove ROI and drive sustainable growth.
Ultimately, high-quality data lets your organization move faster and with more certainty. Your analysts get to spend their time finding insights instead of cleaning datasets. Your marketers can optimize campaigns knowing the metrics are rock-solid. This is how your data goes from being a source of constant frustration to a reliable asset that pushes the business forward.
Establishing Your Data Quality Standards
Before you can even think about fixing broken data, you need a shared, crystal-clear definition of what "good" data actually looks like for your organization. Without it, every team—from marketing to product to development—is operating with different assumptions. This is how trust in your entire analytics setup slowly dies.
The first step is to stop being abstract. You need to create measurable standards that everyone can understand and agree on. This process isn't just a technical exercise; it's a critical business alignment that sets the foundation for everything that follows.
This challenge is becoming more urgent for businesses everywhere. A striking 64% of organizations worldwide pinpointed data quality as their number one data integrity challenge, a notable jump from 50% the previous year. This surge shows how poor data from platforms like Google Analytics and Adobe Analytics is crippling the ability to trust analytics.
The Five Core Dimensions of Data Quality
To build a robust framework, it helps to break down "data quality" into five core dimensions. Think of these as the pillars that support trustworthy analytics. Each one answers a specific question about your data's health.
For instance, you'll want to focus on:
- Accuracy: Does your data reflect reality? The ultimate test is comparing analytics data to a source of truth. If your analytics platform reports $10,000 in revenue, but your payment processor shows $9,500, you have an accuracy problem.
- Completeness: Is any critical information missing? For a key event like
user_signup, you might requireuser_id,email, andplan_typeevery single time. Ifplan_typeis missing from 30% of those events, your data is incomplete. - Consistency: Does your data mean the same thing everywhere? If the marketing team uses
utm_campaign=summer-saleand the product team usescampaign_name=SummerSale2024for the same initiative, your data is inconsistent, making cross-channel analysis impossible. - Timeliness: Is your data available when you need it? If your marketing team needs daily performance data to optimize ad spend, but the data pipeline only updates weekly, its value diminishes significantly.
- Validity: Does the data conform to the rules you’ve set? This means ensuring a
priceproperty is always a number, not a string, or that acountry_codefollows the two-letter ISO format.
To make this more concrete, here's a quick reference table breaking down these dimensions with practical checks you can run.
Your Tracking Plan as the Single Source of Truth
The most effective way to codify these standards is by creating and maintaining a tracking plan. This document is your constitution for data, defining every event and property you track. It specifies what each element means, its required format (e.g., string, integer), and where it should appear.
A tracking plan is more than just documentation; it's an active governance tool. It prevents "schema drift," the silent killer where new, undocumented events and properties slowly pollute your data and erode trust between teams.
A well-defined tracking plan acts as the single source of truth that developers can build against and analysts can reference. It turns vague requirements into concrete specifications, ensuring that the data you collect is clean and standardized from the very beginning. By establishing these rules upfront, you create a system that is far easier to manage and scale.
Check out our guide on essential data quality best practices for more actionable tips on building a solid foundation.
Finding the Root Cause of Your Data Issues
We’ve all been there. A key metric suddenly nose-dives, or a dashboard starts spitting out nonsense. The gut reaction is usually a mild panic, followed by a scramble to fix the immediate symptom.
But the real challenge isn't just patching the problem—it’s playing detective to figure out why it broke in the first place. You have to shift from reacting to symptoms ("our traffic dropped!") to diagnosing root causes ("the GTM container failed on iOS after the last app update"). This is how you stop playing whack-a-mole with data fires and start building a resilient analytics setup.
This investigative work is critical because data quality issues rarely happen in a vacuum. In fact, some research shows that a staggering 47% of newly created data records have at least one critical error. If you don't catch those mistakes at the source, they'll cascade through your systems and poison everything downstream.
Uncovering the Usual Suspects
Most data discrepancies can be traced back to a handful of common culprits. Before you start diving deep into technical debugging, your investigation should always start here. More often than not, the problem lies in one of these areas, and checking them first can save you hours of work.
Your initial sweep should include:
- Manual Implementation Errors: This is the classic "fat finger" problem. A developer misspells an event name in the dataLayer or uses the wrong data type for a property. These tiny typos are incredibly easy to make but can completely break your tracking for that interaction.
- Website or App Redesigns: When developers push a new page design or app version, they might change the CSS selectors or element IDs that your analytics tags depend on. This is a very common reason why
add_to_cartorform_submissionevents suddenly vanish. - Third-Party Script Conflicts: Sometimes, a new marketing pixel or a customer support widget is the culprit. These scripts can interfere with your existing analytics setup, loading in a way that blocks or alters how your main tracking code fires.
- Misconfigured Consent Platforms: With privacy regulations getting stricter, consent management platforms (CMPs) are a must. But if they aren't configured correctly, they can block analytics tags from firing even for users who have opted in, leading to huge gaps in your data.
A Practical Checklist for Your Investigation
Once you've ruled out the usual suspects, it’s time to get more systematic. This checklist will guide you from spotting a problem to pinpointing its exact origin. The goal is to create a repeatable process your team can fall back on every time an issue pops up.
- Validate Against Your Tracking Plan: Your first move should always be to compare what you’re receiving with your single source of truth—the tracking plan. Pop open your browser's developer tools and inspect the event payload being sent. Does the event name match what's in the plan? Are all the required properties there? Are they using the correct data types?
- Inspect Network Requests: Head over to the Network tab in your dev tools to confirm that your analytics and marketing pixels are actually firing. You can filter for requests going to platforms like Google Analytics, Adobe Analytics, or Facebook. If a pixel isn't showing up, you know the tag itself is failing to execute.
- Browser: Is it only happening on Safari?
- Device: Is the problem specific to Android users?
- Geography: Are users from a certain country affected?
- Traffic Source: Does the issue only appear for traffic from a new campaign?
- Review Recent Changes: Connect the data issue to a timeline. Cross-reference the date the problem started with your company's release logs, marketing campaign launch dates, or any recent changes in your tag management system. This context is often where you'll have that "aha!" moment.
- The Marketing Team owns the integrity of all campaign data, making sure every UTM and ad platform integration is correctly configured.
- The Product Team is on the hook for the accuracy of in-app user behavior events, like
feature_usedorsubscription_started. - The Engineering Team owns the underlying data infrastructure and the technical side of implementing the tracking plan.
- Traffic Anomalies: The system automatically flags a sudden, unexplained drop in
page_viewevents from iOS devices, pointing the team directly to a likely bug in the latest app release. - Schema Violations: An alert fires the moment a
priceproperty, which should always be a number, is suddenly sent as a string (e.g.,"99.99"). This stops data type mismatches from breaking your reports. - Broken Pixels: After a website redesign, the system identifies that the main conversion pixel isn't firing on the thank-you page, letting the marketing team fix it before wasting more ad spend.
- For Marketers: You launch a major new campaign. An automated alert instantly pings you on Slack: a huge chunk of your traffic is missing the
utm_campaigntag. Instead of finding this out a week later when your attribution report is useless, you fix it in minutes. Your campaign data is saved. - For Developers: A new app version goes live. The system automatically detects a sharp drop in
add_to_cartevents and traces it back to a specific code change in the latest deployment. You get the root cause analysis without spending hours digging through logs, allowing for a swift, precise fix. - For Analysts: You no longer have to start your day triple-checking dashboards. You can actually trust the numbers because you know a system is constantly monitoring for anomalies, schema violations, and inconsistencies. The data feeding your reports is solid.
- Traffic Anomaly Detection: Uses machine learning to spot unusual spikes or drops in event volume, immediately flagging potential implementation bugs or site outages.
- Schema and Property Validation: Continuously compares incoming data against your defined tracking plan. It alerts you to rogue (unexpected) events, missing properties, or data type mismatches (like a string where a number should be).
- Campaign Tagging Enforcement: Monitors all incoming traffic for adherence to your UTM or campaign tagging conventions, keeping your marketing attribution data clean and consistent.
- PII Leak Prevention: Scans event payloads for patterns that match personally identifiable information (like email addresses or phone numbers) in unapproved fields, helping you stay compliant with privacy regulations.
- Pixel and Tag Monitoring: Verifies that all your critical third-party marketing and analytics pixels are present and firing correctly on key pages, preventing data loss from your ad platforms.
- Wasted Ad Spend: How much of your marketing budget is being guided by broken UTMs and flawed attribution data?
- Inefficient Teams: How many hours are your analysts and data scientists burning just cleaning up messy data instead of finding actual insights? For many knowledge workers, this can eat up to 50% of their time.
- Lost Revenue: Can you trace customer churn back to bad experiences caused by incorrect data, like sending completely irrelevant offers?
- Data Producers: These are the teams creating the data. Think developers implementing tracking or marketers setting up campaigns. They're on the hook for following the standards from the get-go.
- Data Consumers: These are the folks using the data—analysts, product managers, and so on. Their job is to be the first line of defense and flag any issues they spot in the wild.
- Data Stewards: These are designated individuals who own specific data domains, like all customer data or all product data. They are the ultimate decision-makers for their area.
Building a repeatable diagnostic process empowers your team to move beyond guesswork. It turns a chaotic fire drill into a structured, efficient investigation that not only solves the current problem but also helps prevent future ones.
By methodically working through these steps, you can identify the root cause with precision. This clarity is essential for giving developers actionable feedback, ensuring the fix actually works, and, most importantly, rebuilding confidence in your data.
Laying the Groundwork with a Modern Data Governance Framework
If you’re stuck in a reactive cycle of finding and fixing data errors, it's time for a strategic shift. Instead of playing whack-a-mole with data quality issues, you need to build a system that prevents bad data from ever making it into your ecosystem in the first place. This is exactly where a modern data governance framework becomes your most valuable player.
Forget those clunky, manual audits that only happen once a quarter. A modern approach is continuous, automated, and baked right into your team's daily workflow. It’s less about policing data and more about creating a shared sense of responsibility for its integrity from the get-go.
Establishing Clear Rules of Engagement
The bedrock of any solid governance program is a set of clear, universally understood rules. Without them, every team ends up in its own silo, leading to the kind of inconsistencies that slowly kill trust in your analytics. The first step is standardizing how data is created and labeled across the entire organization.
Just think about campaign tracking. A simple lack of convention for UTM parameters can make your attribution reporting completely useless. One team might use utm_source=facebook, another might use Facebook, and a third could be using FB. A governance framework cuts through this chaos by creating a single, documented standard that everyone actually follows.
A data governance framework isn't about adding bureaucracy. It's about removing friction and ambiguity, ensuring that when two people look at the same metric, they are seeing the same reality. This clarity is what allows an organization to move faster and make decisions with confidence.
Defining Ownership and Accountability
One of the fastest ways for data quality to fall apart is a fuzzy sense of ownership. When an issue pops up, who’s actually responsible for fixing it? If the answer is "everyone," it usually means "no one."
A modern governance framework assigns crystal-clear ownership for different data streams. For instance:
This clarity doesn’t just help with fixing problems faster; it builds a culture of accountability. When teams truly own their data, they become naturally invested in keeping it clean.
Moving From Reactive Fixing to Proactive Prevention
The real magic of modern data governance is its power to shift your team from a reactive to a proactive mindset. The goal is to catch potential issues as they happen, not weeks later during a post-mortem. This means putting systems in place that act as a first line of defense for your data quality.
Imagine a developer accidentally pushes code that starts collecting personally identifiable information (PII) in a field where it doesn’t belong. A reactive approach might not spot this until a compliance audit months down the line, creating a massive risk. A proactive system, on the other hand, would flag this schema violation instantly, alerting the team before that bad data ever pollutes your analytics platforms. You can dive deeper into setting up these kinds of guardrails by exploring data governance best practices.
This kind of proactive monitoring can be a lifesaver for all sorts of potential problems:
By setting clear standards, assigning ownership, and implementing automated monitoring, you build a resilient framework. This system doesn't just help you improve data quality—it ensures your data remains a trustworthy, strategic asset for the long haul.
Putting Your Analytics QA on Autopilot
Shifting from a reactive to a proactive data governance framework is a huge step. But the real game-changer? Automating the enforcement of your quality standards. This is where modern analytics QA and observability platforms step in, completely changing how you ensure data integrity.
Think of these platforms as a smoke detector for your data pipelines. Instead of manually searching for the source of a fire after the damage is done, you get an instant, automated alert the moment something starts to smolder. This lets you catch issues in real-time, long before they can skew a report or lead to a bad business decision.
A New Reality for Every Team
The power of automated QA ripples across the entire organization. It gets rid of friction between teams and builds a shared sense of confidence in the data. The benefits are tangible and immediate for everyone involved.
Imagine these all-too-common scenarios, but with an automated safety net in place:
Automation transforms data quality from a periodic, manual chore into a continuous, effortless state of being. It frees up your team from firefighting so they can focus on what they do best: driving growth, building great products, and uncovering valuable insights.
This automated vigilance is critical, especially when you consider the financial stakes. According to Forrester, over 25% of data teams lose more than $5 million annually because of poor data quality. A staggering 7% hemorrhage $25 million or more. By implementing continuous monitoring, teams can protect their bottom line and make sure their analytics drive maximum ROI. You can find more details in the full research on the data quality tools market.
This flow chart visualizes the core pillars of an effective data governance strategy—the very same pillars that automation helps enforce.
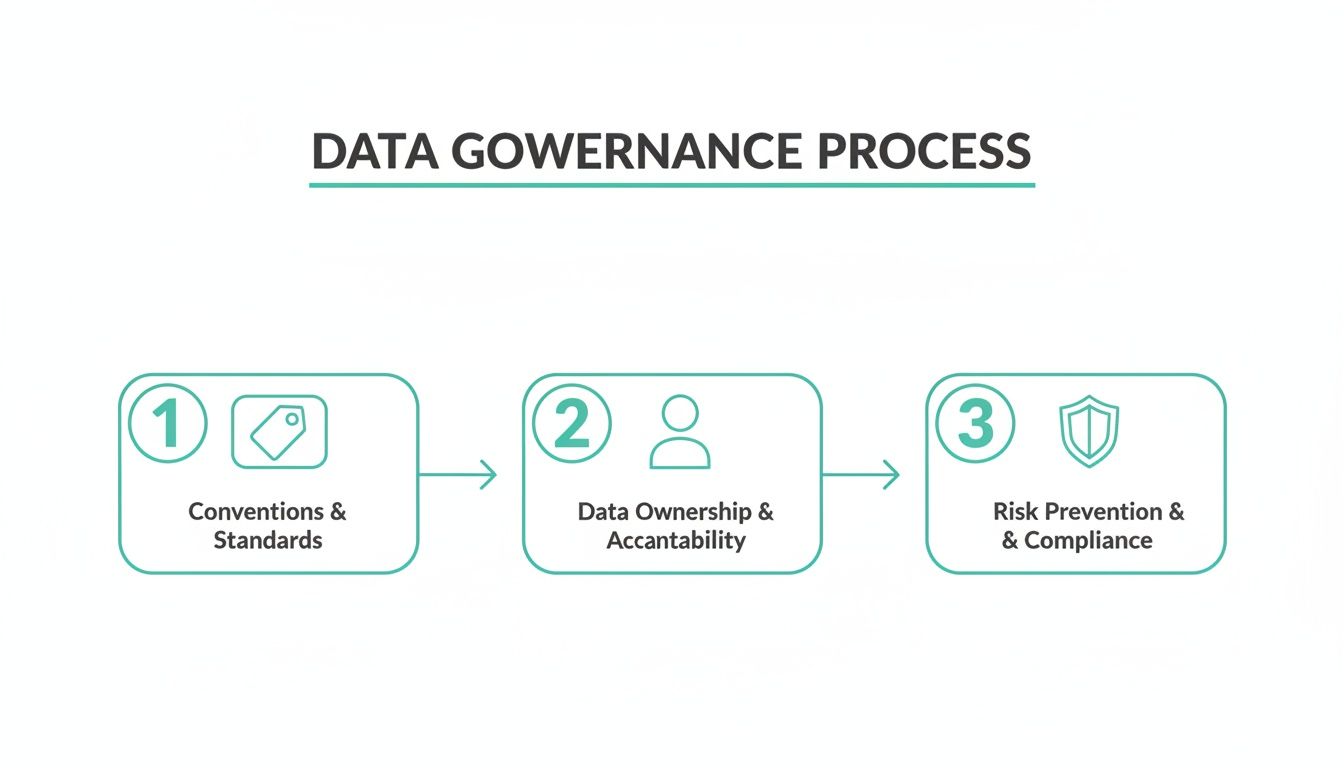
When you automate the checks for these three stages, you ensure your data governance framework is a living, breathing system—not just a static document nobody reads.
How Automated Observability Works
At its core, an analytics observability platform continuously scans the data flowing from your websites and apps to your analytics destinations. It automatically learns your tracking plan, discovering every event, property, and pixel as it's implemented.
Once it has a baseline of what "normal" looks like, it watches for any deviations. This process is far more robust than brittle, manual test suites that need constant updates and can only check for known failure scenarios.
Key Capabilities of an Automated QA Platform
An effective platform gives you a full suite of tools to safeguard your data.
Here are some of the key automated checks that make a huge difference:
By putting your analytics QA on autopilot, you're not just improving data quality; you're building a more efficient, collaborative, and data-driven organization. To learn more about this approach, you might be interested in our deep dive on the fundamentals of data quality monitoring. This shift allows your team to finally move with speed and confidence, knowing their decisions are based on data they can trust.
Got Data Quality Questions? Let's Unpack Them.
Even with the best strategy, hitting roadblocks on a data quality project is completely normal. Teams often get stuck wondering where to even start, how to justify the spend to leadership, or what "good enough" really looks like in the real world.
Let's tackle some of the most common questions that pop up when it's time to get serious about fixing your data.
"This Feels Huge. Where Should We Even Begin?"
The thought of fixing all the data is enough to cause analysis paralysis. Don't try to boil the ocean. The best way forward is to start small and target the areas that hurt the most.
Pick one critical business process where bad data is causing visible pain. Is it your marketing attribution reporting? Maybe it's the sales forecast that's always off, or the product's user onboarding flow that’s losing people.
By zeroing in on a single, high-value area, you can score a quick win. This doesn't just solve a real problem; it proves the value of data quality work to the rest of the company, which makes getting buy-in for bigger projects a whole lot easier.
"How Do We Actually Measure the ROI of This?"
To get the resources you need, you have to talk in terms of business impact. While "data quality" might sound a bit abstract to some, the return on investment (ROI) is very real. You just need to know how to frame it.
The easiest way? Calculate the cost of doing nothing.
Improving data quality isn't just a cleanup project—it's an exercise in reducing risk and boosting efficiency. When you frame the ROI in terms of costs you can avoid and productivity you can unlock, you're speaking a language that leadership understands.
"Is 100% Perfect Data a Realistic Goal?"
In short: nope. And honestly, it shouldn't be. Chasing 100% perfect data is a fantastic way to waste time and resources. The real goal isn't absolute perfection. It's about getting your data to a state where it’s fit for its purpose—a state where the business can confidently use it to make decisions.
A much smarter approach is to set acceptable quality thresholds for different kinds of data. For instance, your financial transaction data needs to be squeaky clean, no question. But the behavioral data you use for directional trend analysis? It can probably tolerate a slightly higher margin of error.
Focus on continuous improvement, not a flawless finish line. What matters is having systems in place that keep an eye on quality and shout when key metrics dip below the thresholds you’ve defined.
"So... Who's Actually Responsible for Data Quality?"
Data quality is a team sport, but when everyone is responsible, often no one is. While a central data team or a governance committee can set the standards and provide the tools, the accountability has to be spread out.
A federated model is what we see work best in practice.
This shared ownership model ensures everyone has skin in the game. It shifts data quality from being just another technical task to a shared cultural value, and that's the secret to making it stick for the long haul.
Ready to stop reacting to data fires and start preventing them? Trackingplan provides a fully automated analytics QA and observability platform that helps you build trust in your data. Get started today and see how our real-time monitoring can help you improve data quality across your entire analytics stack.