Master step by step analytics monitoring to automate pixel error detection, ensure accurate tracking data, and streamline analytics workflows with effective results.
Finding pixel tracking errors after days of missed signals can frustrate any analytics specialist. With global campaigns running across multiple platforms, manual checks rarely catch issues before data quality suffers. Setting up automated analytics monitoring creates real-time visibility and instant alerts so your QA team responds fast to anomalies. This guide highlights practical steps for digital professionals to automate troubleshooting, protect critical metrics, and reliably maintain high data quality.
Table of Contents
- Step 1: Set Up Automated Analytics Monitoring
- Step 2: Configure Real-Time Alert Systems
- Step 3: Diagnose and Fix Tracking Issues
- Step 4: Verify Data Quality and Compliance
Quick Summary
| Key Point | Explanation |
|---|---|
| 1. Set Up Automated Monitoring | Implement real-time monitoring to identify tracking issues quickly and reduce data loss through continuous analysis and alerts. |
| 2. Configure Effective Alert Systems | Develop alert systems that prioritize issues, ensuring your team responds promptly without experiencing alert fatigue. |
| 3. Diagnose and Fix Issues Rapidly | Use alerts to pinpoint issues quickly, reproduce problems, and document fixes to streamline future troubleshooting efforts. |
| 4. Ensure Data Quality and Compliance | Regularly audit data accuracy, completeness, and timeliness to maintain quality standards and enforce privacy regulations. |
| 5. Create a Quality Scorecard | Establish and share a scorecard that tracks key metrics like accuracy and compliance, promoting transparency and ongoing improvement in data quality. |
Step 1: Set Up Automated Analytics Monitoring
Setting up automated analytics monitoring gives you real-time visibility into your tracking implementation without manual checking. You’ll establish continuous data collection, automated alerts, and a feedback system that catches issues before they impact your metrics.
Start by selecting your monitoring platform. Choose a solution that integrates with your existing martech stack and supports the pixel types you track. Your platform should provide real-time data collection and automated analysis across all your properties.
Next, define your key tracking points. Identify every critical pixel, event, and conversion point in your implementation. Document where each tracker lives, what data it should capture, and what success looks like for each data point.
Then configure your automated checks and thresholds. Set up rules that flag anomalies automatically:
- Missing or broken pixels on specific pages
- Traffic spikes or unexpected drops above baseline
- Schema mismatches between implementation and specification
- Delayed data transmission to analytics platforms
- Failed event captures during critical user flows
Connect your monitoring tool to notification channels. Most modern platforms support email, Slack, or Teams integration. Route critical alerts to your QA team and analyst channels so alerts reach the right people instantly.
Automated monitoring systems catch errors within minutes instead of days—giving your team time to fix issues before they corrupt your data.
When setting up real-time data collection, establish a baseline of normal traffic and behavior patterns first. This prevents false alarms while your system learns what normal looks like across different times and days.
Create a dashboard view that shows all active monitors at a glance. Include status indicators, recent alerts, and historical trends. Your team should open this dashboard each morning to catch overnight issues quickly.
Test your entire setup with a controlled test event. Intentionally trigger a pixel failure or modify event data to confirm your alerts fire correctly and reach the right channels. This validates that your automation works when you actually need it.
Pro tip: Start with your highest-revenue conversion pixels and most critical traffic sources, then expand monitoring gradually—this prevents alert fatigue while protecting your most important data points.
Here’s a summary of key monitoring platform features and their business impact:
| Monitoring Feature | Platform Function | Business Impact |
|---|---|---|
| Real-time alerts | Instant error detection | Reduces data losses |
| Historical trends | Visualize performance | Enables trend analysis |
| Automated checks | Flag anomalies quickly | Improves data reliability |
| Dashboard views | Centralized status tracking | Supports rapid response |
Step 2: Configure Real-Time Alert Systems
Configuring real-time alert systems transforms your monitoring setup from passive observation into active defense. You’ll establish threshold rules, connect notification channels, and ensure your team responds to issues before they cascade into data corruption.
Start by mapping your alert priorities. Not every anomaly deserves the same attention level. Differentiate between critical alerts that demand immediate action and warning-level alerts that merit investigation during regular hours.
Define your threshold rules based on historical baselines and business context. Set parameters for each alert type:
- Conversion rate drops below 20 percent of daily average
- Page load time exceeds 3 seconds consistently
- Event capture failure rate surpasses 2 percent
- Pixel response time delays beyond 500 milliseconds
- Data transmission gaps lasting more than 10 minutes
Implement continuous data ingestion and event-driven processing to catch anomalies the moment they occur. This approach reduces detection time from hours to minutes, letting your QA team fix issues before they affect your analytics quality.
Smart alerting means your team only sees alerts that require action, not noise that triggers alarm fatigue.
Configure multi-channel notification routing so critical alerts reach the right person instantly. Route high-priority pixel failures to your QA lead via Slack, medium-priority schema mismatches to your analytics team via email, and low-priority warnings to your dashboard for morning review.
Set up escalation rules for alerts that persist. If a pixel stays broken for 15 minutes, notify your engineering team. If the issue continues for 30 minutes, escalate to your manager. This prevents small problems from becoming unnoticed disasters.
Test your alert system with deliberate failures. Disable a tracking pixel, change an event parameter, or modify a schema mapping. Confirm that each alert fires at the expected severity level and reaches the correct notification channel within seconds.
Create a response runbook for your top five alert types. Document exactly what your team should check and how to verify whether the issue is real or a false positive. Include direct links to relevant dashboards and documentation.
Pro tip: Use adaptive thresholds that adjust based on day of week and time of day—your conversion pixel will naturally behave differently on Friday evenings versus Tuesday mornings, so let your system learn these patterns to reduce false alerts.
Step 3: Diagnose and Fix Tracking Issues
When your alerts fire, speed matters. You’ll now systematically identify what broke, where it broke, and how to restore data accuracy. This step separates teams that recover in minutes from those that lose hours to confusion.

Start with your alert notification. Read it carefully for context clues. Does it mention a specific page, conversion type, or traffic source? These details point you toward the root cause faster than guessing.
Next, reproduce the issue yourself. Navigate to the affected page or trigger the event that’s failing. Use your browser’s developer tools to inspect network requests and confirm whether the pixel is firing. Check for JavaScript errors that might block tracking execution.
Use diagnostic tools to verify implementation accuracy across all pages. Browser extensions and tag management debuggers reveal whether your pixel is loaded, configured correctly, and sending data to the right endpoint. Look for common culprits:
- Missing tracking script tags in page source
- Conflicting JavaScript that overwrites tracking variables
- Content security policy headers blocking pixel requests
- Misconfigured event parameters or schema fields
- Delayed script loading that misses page interactions
The fastest fix starts with confirming exactly what the tracking implementation is doing right now, not what it should be doing.
Once you identify the problem, document the root cause before fixing anything. Note the specific configuration error, affected pages, and how long the issue persisted. This documentation prevents the same bug from recurring.
Apply your fix methodically. Update your tag management system, modify your pixel configuration, or correct your event schema. Test the fix in a staging environment first, triggering test events and verifying data flows correctly.
Deploy your fix to production and monitor immediately. Watch your dashboard for the next 15 minutes to confirm data collection resumed. Alert your analytics team when the issue is resolved so they know to investigate data quality during the outage window.
After resolving the issue, test related tracking points. If your conversion pixel broke, verify that your thank-you page pixel and revenue event still work. Cascading failures happen when you focus only on the alert that fired.
Pro tip: Save your debugging steps in a searchable knowledge base organized by error type—when the same pixel fails again six months later, your team finds the solution in seconds instead of spending 30 minutes on root cause analysis.
Step 4: Verify Data Quality and Compliance
Data accuracy means nothing if you cannot trust it. This step ensures your tracking data meets quality standards and complies with regulations. You’ll audit data completeness, validate event parameters, and confirm your implementation aligns with governance requirements.

Start by documenting your quality dimensions. Define what accuracy, completeness, and timeliness mean for each tracking point. For conversion pixels, accuracy means matching transaction IDs to your CRM within 99 percent. Completeness means capturing all required event properties. Timeliness means data arriving within 30 seconds.
Implement schema validation to catch malformed data before it reaches your analytics platform. Verify that event parameters match your documented specifications:
- User ID fields contain valid identifiers
- Revenue values are numeric and non-negative
- Timestamp formats align with ISO 8601 standards
- Category fields match your enumerated list
- Required fields are never null or empty
Continuous monitoring against defined quality standards ensures your data lifecycle maintains governance alignment. Benchmark your tracking quality against historical baselines to catch degradation early. If your conversion accuracy drops from 99 percent to 95 percent, investigate immediately rather than waiting for a monthly review.
Quality data requires ongoing verification, not post-campaign audits that happen too late to matter.
Conduct sample audits of your raw data weekly. Pull 100 random events from each pixel and manually verify they contain correct values. Check that a confirmed purchase event includes a transaction ID, revenue amount, and customer email address.
Verify privacy compliance by confirming that personally identifiable information flows only to authorized destinations. Audit your consent management system to ensure pixels respect user privacy choices. Document which tracking points require explicit consent and which operate under legitimate interest.
Test your data retention policies and verify they match your documented standards. Confirm that your analytics platform deletes historical data according to your retention schedule. Document how long you maintain raw event logs versus aggregated reports.
Create a quality scorecard that tracks your key metrics monthly. Include pixel uptime percentage, schema validation pass rate, data latency percentile, and compliance audit results. Share this scorecard with your stakeholders so everyone understands data quality trends.
Pro tip: Automate your quality checks by configuring your monitoring system to flag records that fail schema validation, then create a dashboard that shows which pixels generate the most invalid events—fixing the top three problem areas often improves overall data quality by 40 percent.
Compare common data quality dimensions and their verification methods:
| Quality Dimension | What It Means | How to Verify |
|---|---|---|
| Accuracy | Data matches source records | Cross-check with CRM |
| Completeness | All events are captured | Audit random samples |
| Timeliness | Data arrives promptly | Monitor latency trends |
| Compliance | Respects privacy standards | Audit destinations, consent |
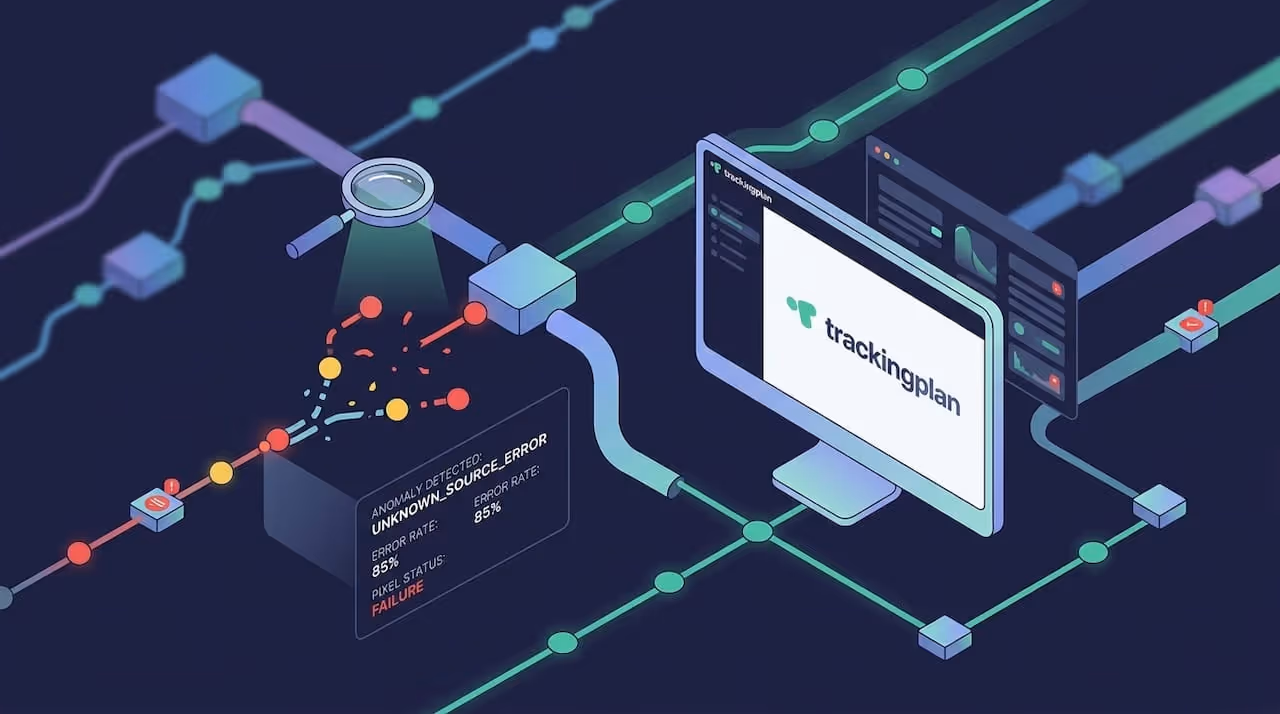
Ensure Accurate Analytics with Automated Monitoring and Real-Time Alerts
Tracking and maintaining clean, reliable data is a challenge every analytics professional and digital marketer faces. This article highlights common pain points such as missing pixels, schema mismatches, delayed event captures, and alert fatigue. Without an efficient system for continuous monitoring and rapid diagnosis, these problems can silently compromise your data accuracy and decision-making.
Trackingplan offers a powerful solution tailored to these exact challenges. Our SaaS platform automates discovery, monitoring, and auditing of all your marketing and analytics implementations across websites, apps, and server environments. Benefit from AI-driven real-time alerts via email, Slack, or Teams so you catch anomalies and errors instantly, not days later. Say goodbye to manual checks and false alerts with our adaptive threshold settings and comprehensive dashboards designed to save you time.
![]()
Ready to transform your analytics monitoring and protect your data quality today? Visit Trackingplan to explore how you can automate pixel monitoring, get instant real-time alerts, and perform root-cause analysis effortlessly. Learn more about automated audit and alert systems and how we help teams fix tracking issues fast before they impact your reporting.
Take control of your digital measurement now with Trackingplan. Your data accuracy and business insights depend on it.
Frequently Asked Questions
How do I set up automated analytics monitoring?
To set up automated analytics monitoring, start by selecting a monitoring platform that integrates with your existing tools. Then, define your key tracking points, such as conversion pixels and events, and configure automated checks to flag any anomalies.
What are effective threshold rules for my alert system?
Effective threshold rules should differentiate between critical and low-priority alerts based on historical data and business context. For example, set a rule to trigger an alert if the conversion rate drops below 20% of the daily average, ensuring you catch significant issues promptly.
How can I diagnose tracking issues quickly?
Diagnosing tracking issues quickly involves starting with your alert notification to identify the affected pages or events. Then, reproduce the error using developer tools to inspect network requests and confirm whether the pixel is firing as expected.
What steps should I take to verify data quality?
To verify data quality, document your quality dimensions and implement schema validation against your specifications. Conduct regular sample audits of your data to ensure accuracy and completeness while checking for privacy compliance in your tracking implementations.
How do I create a response runbook for alerts?
Creating a response runbook involves documenting the steps your team should follow for each alert type. For your top five alert types, include checks to verify if the issue is real or a false positive, along with direct links to relevant dashboards and troubleshooting documentation.
.avif)