Unlock the power of your data layer in Adobe Analytics. Learn how to implement, map, and QA a robust data layer for reliable and scalable insights.
Think of a data layer in Adobe Analytics as the universal translator between your website and all your analytics tools. It’s a structured JavaScript object that neatly organizes all the important user actions and page details into a single, predictable source. This simple concept is the key to preventing data chaos and making tag management a whole lot easier.
What Is a Data Layer and Why Does It Matter?

Let's try an analogy. Imagine your website is a bustling airport. Each passenger—representing a user action like a click or a purchase—needs to get to the right plane, which is a specific marketing or analytics tool.
Without a central terminal (the data layer), you’d have to build a custom, hand-coded path for every single passenger to get to their specific gate. It would be an absolute mess: inefficient, disorganized, and a nightmare to maintain.
A data layer is that central terminal. It’s a standardized JavaScript object that lives on your website, holding all the crucial information about the page, the user, and what they’re doing. Instead of scattering dozens of analytics tags across your site's code, you just send all that data to one central hub.
The Old Way: A Recipe for Disaster
Before data layers became the standard, we used to embed fragmented JavaScript snippets directly into the page code. This old method was a massive headache. In fact, studies from that era showed that up to 70-80% of analytics implementations suffered from data discrepancies caused by timing issues and vendor-specific code.
This traditional approach, often called "hardcoding," creates several huge problems:
- It’s brittle. Hardcoded tags break all the time. The moment a developer updates the website's design or changes a CSS class name, your revenue tracking could silently fail.
- It’s inconsistent. Different teams often implement tags in slightly different ways, which leads to conflicting data. Marketing might see one conversion number while the product team sees another.
- It’s slow. Loading tons of individual scripts directly on the page drags down your site's performance, hurting both the user experience and your SEO rankings.
To help visualize the difference, here’s a quick comparison of the old way versus the data layer approach.
Data Layer vs. Traditional Tagging
As you can see, the data layer isn't just a minor improvement—it’s a fundamental shift in how we manage analytics.
Establishing a Single Source of Truth
A data layer fixes all these issues by decoupling your data collection from your website’s code. Developers can focus on what they do best: pushing consistent, structured information to the data layer. Meanwhile, marketers and analysts can use a tag management system (like Adobe Experience Platform Tags) to simply read the data from that central hub. You can dig deeper into the fundamentals by exploring this explanation of what a datalayer is.
By creating this clean separation, the data layer becomes your single source of truth. It guarantees that every tool—from Adobe Analytics to your advertising platforms—gets the same accurate, reliable information.
This structure provides a rock-solid foundation for your entire digital analytics strategy. It makes your implementation more scalable, far easier to manage, and much less likely to break. Ultimately, a well-built data layer in Adobe Analytics is what transforms your data from a source of frustration into a trusted asset for driving business decisions.
Building Your Adobe-Ready Data Layer
Let's move from theory to practice. Building a data layer is a lot like drafting the blueprint for a house. Before you start putting up walls or laying pipes, you need a solid plan that maps out where everything should go. A well-designed plan is the key to ensuring your data layer in Adobe Analytics is not only robust but also dead simple for your tag management system to read.
At its heart, a data layer is just a JavaScript object. You can technically name it anything, but the industry standard—and Adobe's recommendation—is adobeDataLayer. This object becomes the central container for all the dynamic information you want to collect about user behavior and page context.
The most effective data layers aren't just one giant, messy block of data. Instead, they’re neatly organized into logical objects that group related information. This approach keeps your data layer clean, predictable, and incredibly easy to work with.
The Core Components of Your Data Layer
Think of your data layer as a digital filing cabinet. To find what you need quickly, you’d use different folders for different types of documents. The same principle applies here. We use primary objects as our "folders" to hold specific kinds of data.
Here are the three most common and essential objects you'll need:
page: This object holds all the information about the content the user is looking at right now. Think page names, categories, and other descriptive attributes of the screen or view.user: This is where you store data about the visitor. It usually includes their login status, a unique user ID, and segmentation details like customer type (e.g., 'new' or 'returning').ecommerce: Absolutely critical for any transactional site. This object stores detailed information about products viewed, items added to the cart, and final purchase details.
By organizing your data this way, you create a structure that anyone can understand. For instance, if you need to find the current page's name, you know exactly where to look: adobeDataLayer.page.pageInfo.pageName. No guesswork needed.
Capturing Interactions with an Event-Driven Model
Modern websites, especially Single Page Applications (SPAs), are incredibly dynamic. Content changes all the time without a full page reload, which means a static data layer that loads only once just won't cut it. This is where an event-driven approach becomes absolutely essential.
Instead of defining the data layer once at page load, we push events to it whenever a user does something meaningful. This is all handled with the adobeDataLayer.push() method.
An event-driven data layer is a chronological stream of user interactions. Each
pushcommand adds a new entry to this stream, capturing what the user did and the context at that exact moment. This ensures no action is missed, even on the most dynamic websites.
For example, when a user adds a product to their cart, your site's code would fire off a push command that looks something like this:
adobeDataLayer.push({
"event": "addToCart",
"ecommerce": {
"product": [{
"productInfo": {
"sku": "SKU12345",
"productName": "Running Shoes",
"price": "99.99"
},
"quantity": 1
}]
}
});
This simple command tells your analytics tools three critical things:
- What happened: The
eventname is "addToCart". - What was involved: The
ecommerceobject gives details about the specific product. - When it happened: The push occurs the instant the user clicks the button.
This method is far more reliable than trying to "scrape" data off the page after the fact. It guarantees accuracy and is the gold standard for modern analytics. To see how this works with Adobe's ecosystem, you can learn more about the Adobe Client Data Layer and its benefits. This event-driven approach gives you a clear, adaptable structure that ensures you collect the right data, right from the start.
Mapping Your Data Layer to Adobe Analytics
So, you’ve got a beautifully structured data layer. Now what? The next crucial step is actually plugging that information into Adobe Analytics. This is the mapping process—where the raw, vendor-agnostic data from your site gets translated into the specific variables and events Adobe needs to build its powerful reports.
Think of it like plumbing. Your data layer is the main water supply for your house, holding all the potential. Mapping is the act of connecting pipes from that supply to the specific faucets, showers, and appliances where you actually need the water to flow. Without this connection, your data layer is just a silent reservoir of information.
Bridging the Gap With a Tag Management System (TMS)
To make this connection happen, you'll need a tag management system (TMS). While you can use others, Adobe’s own solution, Adobe Experience Platform Tags (you might still hear people call it by its old name, Launch), is built for this exact job.
Inside the TMS, the process is pretty logical. You create what are called "Data Elements" that point to specific variables in your data layer. For instance, you could create a Data Element named "Page Name" that simply pulls its value from digitalData.page.pageInfo.pageName. Easy enough.
Then, you create rules that tell the TMS when to send this data over to Adobe Analytics. A rule might fire on every single page view, or it could be much more specific, triggered only by an event in the data layer like addToCart. This event-driven approach is key because it ensures data is captured and sent at the exact moment a user does something important.
This diagram helps visualize how the core objects in a data layer—like Page, User, and Ecommerce—become the foundational sources for your analytics mapping.
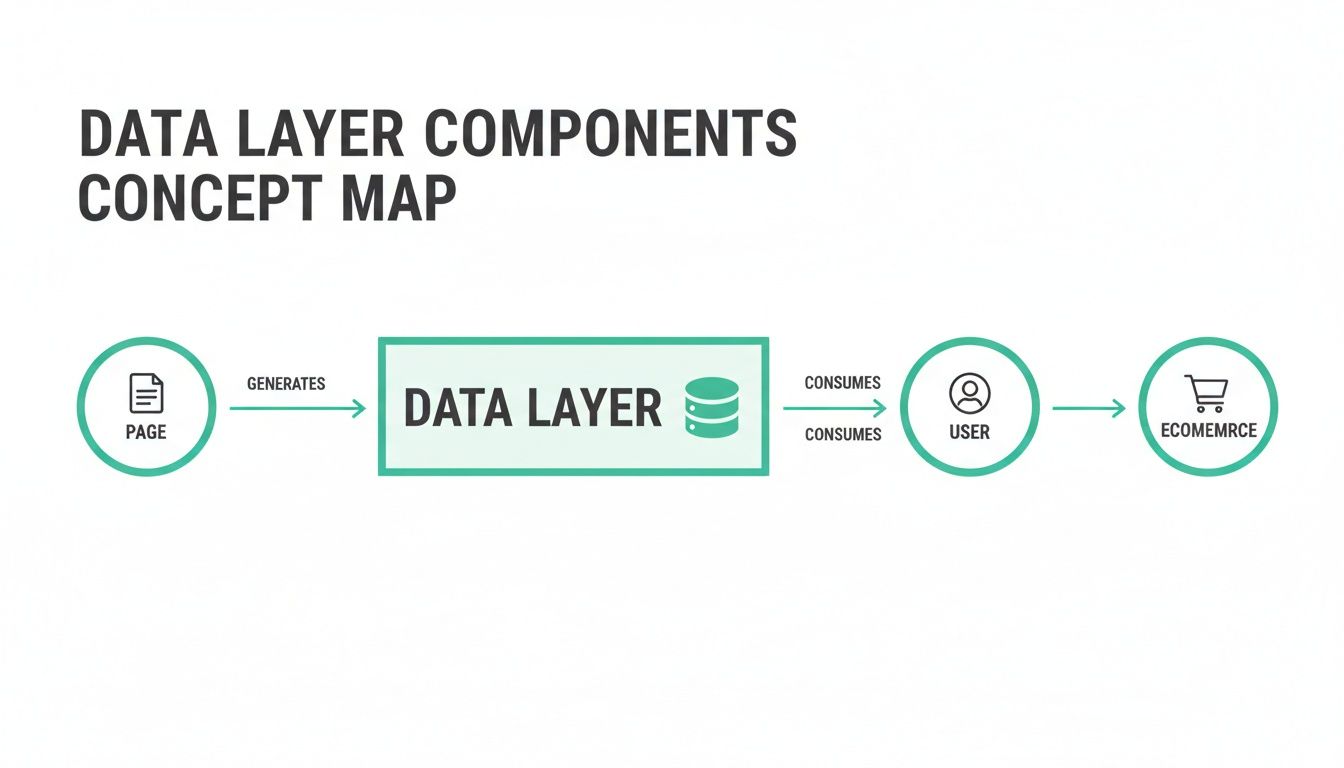
As you can see, every piece of the user interaction, whether it's related to the page they're on, their profile, or their shopping activity, flows neatly from these organized objects right into your analytics platform.
Translating Data Into Adobe's Language
At the heart of mapping is assigning your data layer variables to Adobe's specific tracking variables. It's absolutely critical to understand what each one is for, because they all have different jobs.
- Props (s.prop): These are your traffic variables. Think of them as simple counters. They're best for temporary, low-cardinality data like page names or site sections and have a very short lifespan—they basically forget their value after the page loads.
- eVars (s.eVar): These are conversion variables, and they are all about attribution. Unlike props, they persist beyond a single page view, which lets you attribute conversions (like a purchase) back to earlier actions (like clicking a marketing campaign link).
- Events (s.events): These are your success events. They count key actions. They can be simple counters (e.g.,
event1for a newsletter signup) or hold numeric/currency values (likeevent2=99.99to track revenue). - Products (s.products): This is a specially formatted string used to pass all the juicy details about a product—its category, name, quantity, and price. It’s the backbone of merchandising reports.
A smart mapping strategy is always documented in a Solution Design Reference (SDR). This document becomes the sacred blueprint for your entire implementation.
Practical Mapping Examples in Action
Let’s get concrete. Imagine a user lands on a product detail page for some running shoes. Your data layer might spit out something like this:
digitalData = {
"page": {
"pageInfo": {
"pageName": "product:running-shoes",
"siteSection": "footwear"
}
},
"user": {
"profile": {
"loginStatus": "logged-in"
}
}
}
Inside Adobe Experience Platform Tags, your mapping would look something like this:
digitalData.page.pageInfo.pageNamemaps to eVar1 (Page Name) and prop1 (Page Name).digitalData.page.pageInfo.siteSectionmaps to eVar2 (Site Section) and prop2 (Site Section).digitalData.user.profile.loginStatusmaps to eVar3 (Login Status).
Now, what about an interaction? If that user clicks "Add to Cart," your website should push a new event to the data layer:
digitalData.push({
"event": "addToCart",
"ecommerce": {
"product": [{
"productInfo": {
"sku": "SKU12345",
"productName": "Running Shoes",
"price": "99.99"
},
"quantity": 1
}]
}
})
A rule in your TMS, listening for that addToCart event, would spring into action and fire an Adobe Analytics beacon containing:
s.events = "scAdd"(the standard event for "add to cart").s.products = ";SKU12345;1;99.99"(the correctly formatted product string).
The real beauty here is the efficiency. Adobe's Experience Platform Tags, launched in 2018 and now used by over 60% of Analytics customers, makes this mapping almost effortless. What used to take hours of custom JavaScript can now be set up in under 10 minutes. You can learn more about how this approach simplifies AEM implementations from the Adobe community.
To make this even clearer, the table below shows some common data layer variables and where they typically end up in Adobe Analytics.
Data Layer to Adobe Analytics Mapping Examples
This table is a handy reference for seeing how common data layer variables are mapped to specific eVars, props, and events in a typical setup.
By getting this mapping process right, you truly unlock the power of your data, turning a well-structured data layer into the rich, actionable insights you see in your Adobe Analytics reports.
Best Practices for a Scalable Implementation
A well-mapped data layer is a great start, but it’s not enough. The real challenge is building one that stands the test of time. I’ve seen countless implementations that work perfectly on day one, only to become a tangled mess of broken rules and inconsistent data a few months later.
The difference between a fragile setup and a robust, scalable one comes down to a few core principles. Think of them as the architectural blueprints for your data infrastructure. Skipping these steps is like building a house without a foundation—it might look fine for a little while, but it’s destined to cause problems down the road.
Create Your Single Source of Truth
The single most important thing you can do is create and religiously maintain a Solution Design Reference (SDR). This document is the definitive blueprint for your entire analytics implementation. It’s where you meticulously detail every variable, event, and rule, creating the single source of truth that keeps developers, analysts, and marketers on the same page.
A solid SDR should clearly outline:
- Business Requirements: What questions are we actually trying to answer with this data?
- Data Layer Schema: A complete map of every object and property in your data layer.
- Adobe Analytics Mapping: Crystal-clear instructions on which data layer variable maps to which eVar, prop, and event.
- Implementation Details: Code snippets and trigger logic for your developers to follow.
Without an SDR, your implementation becomes tribal knowledge. As soon as a key team member leaves or changes roles, that knowledge walks out the door with them. A well-maintained SDR is your insurance policy against data chaos.
Establish a Clear Naming Convention
Consistency is everything. A haphazard naming convention is a recipe for confusion, errors, and wasted time. Before a single line of code is written, you need to establish a clear, logical, and consistent naming system for every data layer variable and event.
A good naming convention doesn't need to be complicated. Just follow a few simple rules:
- Pick a case style and stick with it. camelCase is a popular choice (e.g.,
pageName,productID). - Don't get cute with cryptic abbreviations. Use descriptive names like
internalSearchTerminstead ofiSrchTrm. - Give your event names a logical structure, like
formSubmissionSuccessorvideoPlay.
This simple discipline makes your data layer practically self-documenting. A new analyst can look at a variable like user.profile.loginStatus and immediately understand what it is without having to dig through the SDR for every little thing. It speeds up everything from implementation to troubleshooting.
Design a Vendor-Agnostic Data Layer
While this guide is all about the data layer in Adobe Analytics, it’s a huge strategic mistake to build it only for Adobe. Your data layer should be completely vendor-agnostic. That means its structure and naming conventions should be universal, not tied to the specific requirements of any single marketing or analytics platform.
This approach gives you incredible flexibility. You create a universal data structure—like ecommerce.purchase—and then let your tag management system do the work of translating it for each tool. Adobe Analytics needs the s.products string, while Google Analytics 4 needs an items array. A vendor-agnostic layer handles both from a single source of truth.
This effectively future-proofs your entire analytics setup. You can add, swap, or remove tools down the line without needing a costly and painful redevelopment of your data layer.
Implement Server-Side for Accuracy
One of the best ways to shore up your data accuracy and performance is to populate the data layer on the server-side whenever you can. When a data layer is built entirely on the client-side (in the user's browser), it's vulnerable to all sorts of issues—ad blockers, network lag, and browser-specific quirks can all cause data to go missing.
By generating the data layer on your server before the page is even sent to the browser, you ensure the data is complete and accurate from the get-go. This is absolutely critical for important transactional data, where every single conversion has to be counted. A server-side approach can all but eliminate data loss from client-side problems, leading to far more trustworthy reporting.
Automating Data Quality and Governance

A perfectly designed and mapped data layer in Adobe Analytics is a thing of beauty, but it's worth absolutely nothing if it breaks in production. The second a developer ships new code that accidentally tweaks a variable name or removes an event, your reports are toast. This is where we shift gears from implementation to the all-important practices of validation and ongoing governance.
The path to solid data quality usually starts with manual checks. This hands-on process is a core skill for any analyst and acts as your first line of defense against data disasters.
The Starting Point: Manual QA Checks
Before any new tracking goes live, manual validation is simply non-negotiable. Using your browser's developer tools, you can pop the hood and inspect the data layer object directly on any page. Is the pageName variable filling out correctly? When a user adds an item to the cart, does the ecommerce object have the right product SKUs?
Beyond just looking at the data layer, you can use browser extensions like the Adobe Experience Cloud Debugger to watch the actual analytics beacons fire off. This confirms that your tag management rules are doing their job and that eVars and events are getting the right data from the data layer.
But let's be real, manual checks have some serious limitations:
- They don’t scale: You can't possibly check every single page, user state, and interaction on a modern website. It's just not feasible.
- They're a snapshot in time: Manual QA only tells you if things are working right now. It won't catch problems introduced by the very next code release.
- They're prone to human error: It’s way too easy to miss a subtle typo in a variable or overlook a minor inconsistency.
While essential, manual QA just can't keep pace with agile development. To truly safeguard your analytics, you need a more powerful and proactive solution.
The Shift to Automated Analytics Observability
This is where the idea of automated analytics observability changes the game. Instead of just spot-checking your setup, observability platforms act like a constant safety net, monitoring your data collection 24/7 in the live environment.
Think of it this way: manual QA is like having a security guard do a walkthrough of a building every few hours. Automated observability is like having a full-blown security system with sensors on every door and window, all monitored around the clock.
Automated monitoring tools continuously validate your live data layer implementation against its intended design—your Solution Design Reference (SDR). They act as your system's immune response, instantly detecting when something deviates from the plan.
This proactive approach ensures the data flowing into Adobe Analytics is always the data you expect.
How Automated Monitoring Works
Platforms like Trackingplan are built specifically to provide this layer of governance automatically. They work by discovering your entire analytics implementation—from the data layer all the way to its destination in Adobe Analytics—and then monitoring every single event in real time.
This continuous validation catches a ton of critical issues that manual checks would almost certainly miss:
- Schema Changes: You get an alert if a developer renames
productIDtoproductId, which would silently break your product reports. - Missing or Empty Values: You're notified if an
addToCartevent fires without a product SKU, making that piece of data useless. - Rogue Events: The system can flag unexpected events that don't match your tracking plan, preventing your data from getting polluted.
- PII Leaks: It can even detect and alert you if personally identifiable information (PII) is accidentally sent to analytics platforms.
The importance of these audits is hard to overstate. In fact, an analysis of 500 enterprises in major e-commerce markets found that regular data layer audits can slash schema mismatches by a whopping 75%. This diligence also helps prevent serious issues like PII leaks, which affected 12% of non-audited setups and put companies at risk of huge GDPR fines.
By automating this process, you protect the integrity of every report and dashboard your organization depends on. This transforms data governance from a reactive, fire-fighting drill into a proactive, automated strategy that builds lasting trust in your analytics.
Frequently Asked Questions
Even with a flawless implementation plan, questions are bound to pop up when you're working with a data layer in Adobe Analytics. Let's walk through some of the most common ones to clear up any confusion and help you navigate the tricky spots.
What Is the Difference Between W3C CEDDL and Adobe's Data Layer?
The biggest difference boils down to architecture and optimization. The W3C Customer Experience Digital Data Layer (CEDDL) is a standardized, generic framework designed to work with any platform. It's a decent, vendor-agnostic foundation to build on.
Adobe’s Client Data Layer (ACDL), however, was built from the ground up to integrate perfectly with the Adobe Experience Cloud. Its event-driven design is a game-changer for avoiding the timing issues, or "race conditions," that often cause headaches in other setups. This structure plugs directly into the rules engine in Adobe Experience Platform Tags, making it a much more stable and efficient option if you're committed to the Adobe ecosystem.
Think of the W3C standard like a universal travel adapter—it’ll get the job done anywhere, but it can feel a bit clunky. The ACDL is more like Apple's MagSafe charger; it’s designed for a perfect, seamless connection with its specific system.
How Do I Manage a Data Layer in a Single Page Application?
Working with a data layer in a Single Page Application (SPA) demands a mental shift away from old-school page loads. The page never fully reloads, so you can't just set the data layer once and forget it. You have to think in terms of a continuous flow of user interactions.
The key is to go all-in on an event-driven model. Instead of relying on a static data layer, you'll need to use adobeDataLayer.push() to signal every important change in the application's state or any action the user takes.
Here’s what you absolutely need to do for a successful SPA implementation:
- Push Events for View Changes: Any time the user moves to a new "screen" or view, you have to push a dedicated event (like
pageVieworvirtualPageView) that includes the updated page context. - Capture All User Interactions: Don't forget to fire events for clicks, form submissions, video plays, or any other behavior that matters to your analysis.
- Clear Old Values: This one is critical. You must clear out or reset variable values on each new view. If you don't, data from one screen will bleed into the next, completely polluting your reports.
Following this approach ensures your tracking stays accurate and truly reflects how users move through your dynamic application.
Can I Use One Data Layer for Both Adobe and Google Analytics?
Not only can you, but you absolutely should. Building a vendor-agnostic data layer is a cornerstone of a scalable, future-proof analytics setup. The idea is to create one universal data structure that acts as the single source of truth for all your analytics and marketing tools.
The process is pretty straightforward:
- First, you design a universal schema using standard, easy-to-understand names (e.g.,
ecommerce.purchase,user.loginStatus). - Next, inside your tag management system (like Adobe Experience Platform Tags), you create separate sets of mapping rules for each tool.
- One rule will map your universal variables to Adobe’s format (
s.products, eVars, events), while another will map those same variables to Google Analytics 4's required format (like theitemsarray and event parameters).
This strategy decouples your on-site data collection from any single vendor, giving you the freedom to add, switch, or drop tools down the road without having to re-tag your entire website from scratch.
What Are the First Steps to Fixing a Broken Data Layer?
When your data layer breaks, it can feel overwhelming, but a systematic approach will get you through it. Always start with the simplest tools at your disposal before diving into more complex diagnostics.
Here's a quick workflow to pinpoint the problem:
- Check the Browser Console for Errors: The first stop is always your browser's developer tools (usually F12). Head to the Console tab and look for red flags. JavaScript errors are often the culprit, preventing your data layer script from loading or running properly.
- Inspect the Data Layer Object: While you're in the console, type the name of your data layer object (e.g.,
adobeDataLayerordigitalData) and hit Enter. This lets you see its current state in real-time. Are the properties you expect there? Are the values correct, or do you seeundefinedor empty strings? - Use a Debugger Extension: Browser extensions like the Adobe Experience Cloud Debugger are your best friend. This tool shows you exactly what data is being packed into each Adobe Analytics beacon, so you can confirm if your tags are firing and passing the right information.
- Leverage Automated Observability: To move from reactive fixes to proactive governance, an automated platform is essential. It can scan your entire site to find every spot where the implementation strays from your Solution Design Reference, catching issues before they poison your data.
A solid data layer is the bedrock of trustworthy analytics. But keeping it healthy requires constant vigilance. Trackingplan offers automated observability to continuously scan your data layer and analytics implementation, catching errors before they ever hit your reports. It’s the safety net that gives your teams the confidence to make truly data-driven decisions. See how you can stop worrying about data quality and start trusting your insights at https://trackingplan.com.