
Struggling with click rate vs click through rate? This guide breaks down the differences, calculations, and strategic uses for accurate marketing analysis.
The real difference between click rate and click-through rate boils down to one simple thing: the denominator. What are you measuring against?
Click rate (CR) looks at clicks as a percentage of all the emails you successfully delivered. In contrast, click-through rate (CTR) measures clicks against only the emails that were actually opened. Because of this, CTR will almost always be a higher number since it's working with a smaller, more engaged group of people.
Understanding the Core Difference in Click Metrics
In digital marketing, especially with email campaigns, people often throw these terms around as if they mean the same thing. They don't. They tell two completely different stories about your campaign's performance, and knowing which story you're reading is key to making smart decisions.
For data teams, this distinction is critical. Let's run a quick example. Say you send out 1,000 emails. 100 people open them, and 10 people click a link.
Your Click Rate is 1% (10 clicks ÷ 1,000 delivered emails).
Your Click-Through Rate is 10% (10 clicks ÷ 100 opened emails).
See the difference? Choosing which metric to focus on depends entirely on the question you’re trying to answer. Are you trying to gauge the big-picture effectiveness of the entire campaign from send to click? Or are you trying to figure out how compelling your email's content was to the people who actually saw it?
A Tale of Two Denominators
The heart of the "click rate vs click through rate" debate is all about that denominator in the formula. Here's a simple way to think about it:
Click Rate (CR): This metric is about the entire audience you reached. It answers the question, "Of everyone who got our email in their inbox, what percentage clicked something?" This makes it a solid measure of your campaign's overall punch, from deliverability to subject line appeal.
Click-Through Rate (CTR): This one zooms in on the engaged slice of your audience. It asks, "Of the people who cared enough to open our email, how many found the content convincing enough to click?" This makes CTR the go-to metric for judging the quality of your copy, design, and calls to action.
Before you go any further, it's worth taking a moment to fully understand What Is Click Through Rate and Why It Matters, since it's such a foundational metric in the marketing world. Getting this right depends on accurate tracking, which is often handled by a series of web tags that fire behind the scenes to collect all this data.
Quick Comparison: Click Rate vs CTR
To make it even clearer, here's a quick side-by-side look at the two metrics.
This table sums it up nicely. Use CR to get a bird's-eye view of your campaign's overall health and CTR to diagnose how well your actual email content is performing with an engaged audience.
How to Calculate and Interpret Each Metric
Knowing the difference between click rate and click-through rate is one thing, but calculating and applying them correctly is where the real data-driven insights begin. The formulas are simple enough, but the story each one tells about your campaign's success couldn't be more different.
At their core, both metrics track how well your content prompts a click. The critical difference is their starting point—one looks at the entire potential audience you reached, while the other zooms in on only those who showed initial interest by opening the email. This distinction changes everything.
The Formulas Unpacked
Let's break down the math. The key is the denominator—the number you're dividing by. This single element shapes the entire context of your analysis.
Here’s a side-by-side comparison:
Click Rate (CR) Formula:
(Total Clicks / Number of Delivered Emails) * 100
This gives you the percentage of recipients who clicked a link out of everyone who actually got the email in their inbox.Click-Through Rate (CTR) Formula:
(Total Clicks / Number of Opened Emails) * 100
This tells you the percentage of recipients who clicked a link, but only out of the group that opened the email.
See the split? CR measures against the entire delivered audience, while CTR isolates the engaged audience. This is the heart of the click rate vs click through rate debate.
Key Takeaway: Click Rate shows you the performance of the entire email campaign, from delivery all the way to the click. Click-Through Rate zeroes in on the performance of the email’s content and CTAs, but only for the audience that actually saw it.
A Practical Scenario Putting It All Together
Formulas are fine, but a real-world example makes the distinction impossible to miss. How marketing teams and data analysts read these numbers directly impacts where they focus their efforts.
Let's say Dan's Gidget Shop sent a newsletter to 857 subscribers. Of those, 15 emails bounced. In total, 87 people clicked on a link. The Click Rate would be 87 ÷ (857 - 15) = 10.3%.
But what if only 200 recipients actually opened that email? Suddenly, the Click-Through Rate is 87 ÷ 200 = 43.5%. That paints a dramatically different picture of the content's performance. You can find more examples of this crucial distinction over at Klipfolio.
This is where the analysis forks. A 10.3% CR tells you that about one in ten people from your reachable audience took action. That number might feel a bit low and could trigger a review of your subject lines or send times to get more people to engage in the first place.
On the other hand, a 43.5% CTR is a powerful signal. It tells you that for the people who did open the email, the content was incredibly compelling. Nearly half were motivated enough to click. This suggests your email body, offers, and calls-to-action were right on the money.
Interpreting the Discrepancy
When you see a low CR next to a high CTR, don't see it as a contradiction—see it as a diagnostic tool. This pattern points directly to an "open" problem, not a "content" problem. Your email isn't failing to convert; it's failing to get seen. This insight helps you focus your optimization efforts exactly where they'll make a difference: on subject lines, preview text, and sender reputation.
Of course, this all hinges on accurate data. If your analytics tracking is off—say, your open-tracking pixels don't fire or click events are misconfigured—both calculations become useless. Without reliable data, you can't trust either metric, and your team is left making decisions in the dark. A deep dive into your marketing data analysis practices is non-negotiable for ensuring these foundational metrics are solid.
When to Use Click Rate vs. CTR in Your Analysis
Knowing the formulas is just the first step. The real skill is matching the right metric to the right business question. The click rate vs. click-through rate debate isn't about which one is "best"—it's about picking the right tool for the job. Each one shines a light on a different part of your campaign's performance and your customer's journey.
Picking the wrong metric can send your team down a rabbit hole of flawed analysis. For example, if you try to measure content quality with Click Rate, you're likely to miss the real story your data is trying to tell you.
This simple decision tree can help you make a quick choice based on what you're trying to analyze.
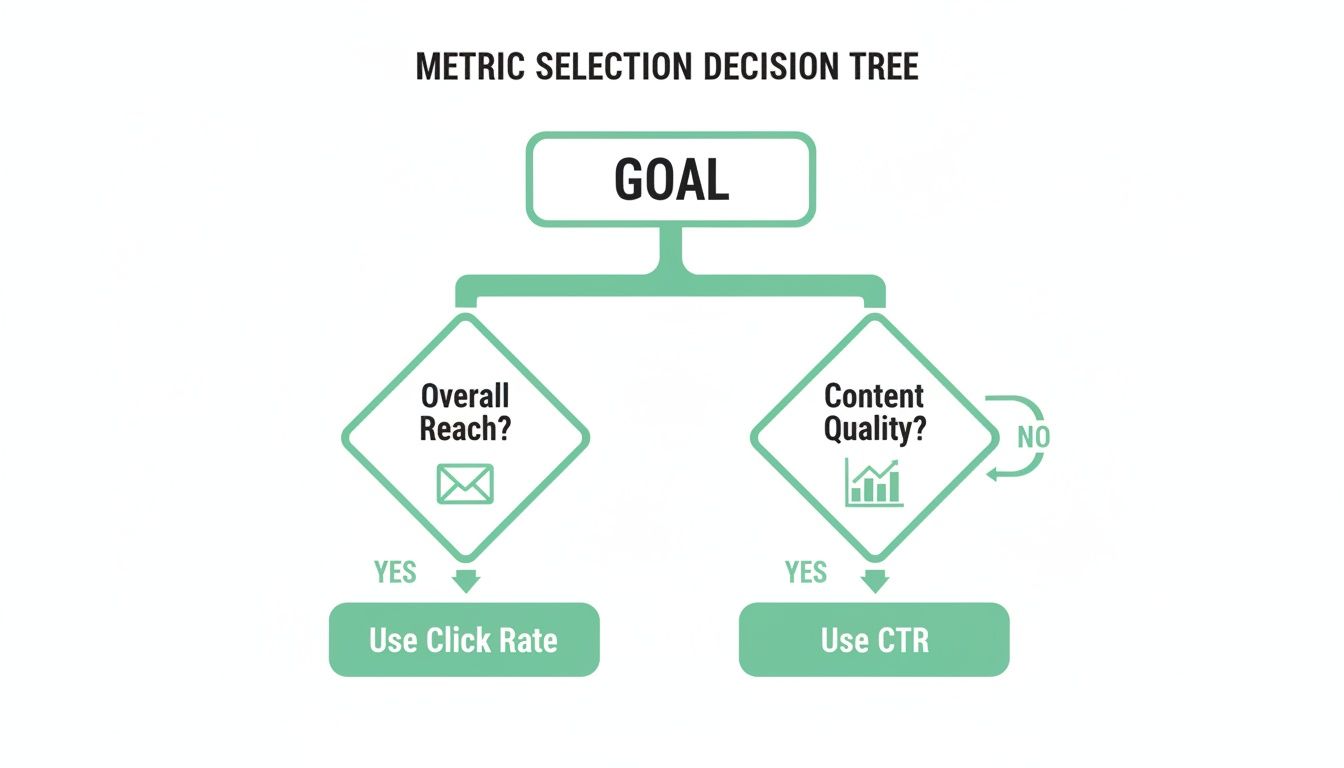
As the diagram shows, your goal dictates your metric. If you're looking at overall campaign reach and deliverability, Click Rate is your guide. But when you need to know how your content performed, CTR is the way to go.
To make this even clearer, let's map these metrics to common business goals. The right choice depends entirely on the question you're asking.
Choosing The Right Metric For Your Goal
Ultimately, these metrics are designed to answer different questions. Let’s dive a bit deeper into the specific scenarios for each.
When to Prioritize Click Rate (CR)
Click Rate gives you a holistic, big-picture view. It tells you how well your campaign drove action from everyone it reached, making it the perfect metric for diagnosing the earliest stages of engagement.
Here are a few specific times when Click Rate should be your go-to indicator:
- Evaluating Overall Campaign Reach: CR is a comprehensive number that rolls up deliverability, sender reputation, subject line appeal, and initial content preview into one metric. A healthy, rising CR is a sign of broad campaign health.
- Assessing Inbox Placement and Deliverability: If you see a consistently low CR across several campaigns, it might be a red flag that your emails aren't landing in the primary inbox. It's an early warning system for deliverability issues that kill engagement before your content even gets a chance.
- Testing Subject Lines and Sender Names: Because CR is calculated from all delivered emails, it’s a pure measure of how well your "envelope"—the subject line and sender name—convinced people to act. It answers the question, "Did this initial presentation motivate a click?" without being muddied by open rates.
In short, Click Rate is your best friend for top-of-the-funnel email diagnostics. It helps you figure out if you're even getting your foot in the door.
When to Prioritize Click-Through Rate (CTR)
Click-Through Rate, on the other hand, zooms in on the people who have already walked through that door by opening your email. This makes it the definitive metric for measuring the quality and persuasiveness of your actual email content.
Focus on CTR in these situations:
- Measuring Content Quality and Engagement: This is CTR's bread and butter. A high CTR is a direct signal that your copy, images, offers, and calls-to-action resonated with the audience who saw them. It answers the question, "Was our message compelling enough to act on?"
- A/B Testing Creative Elements: When you're testing different CTAs, button colors, headlines, or body copy, CTR is the most precise metric you can use. It isolates the impact of these in-email elements by only considering the behavior of people who actually viewed them.
- Understanding Audience Resonance: If you launch a new message or product, a strong CTR from your engaged subscribers validates that the content strategy is hitting the mark. It confirms you're aligned with what your most active audience wants.
Crucial Insight: CTR cleanly separates the performance of your creative content from the performance of your subject line and deliverability. This distinction is vital for accurate testing, preventing you from trashing good content because of a bad subject line.
The choice between click rate vs. click-through rate comes down to the question you're asking. Are you trying to figure out why people aren't engaging at all? Or are you trying to improve the experience for those who already are? Your answer will point you to the right metric every single time.
Why CTR Is the Standard for Content Performance
While Click Rate gives you a useful, high-level snapshot of a campaign's total reach, Click-Through Rate (CTR) is the metric most pros rely on to judge content performance. The reason is both statistical and strategic: CTR delivers a much cleaner, more precise measure of engagement by focusing only on the audience that actually saw your content.
This metric cuts through the "noise" of unengaged subscribers who never even opened the email. By measuring clicks against opens, CTR tells you how compelling your message, design, and call-to-action were to an already interested audience. It answers the one question that really matters: "Did our content motivate the people who saw it?"
Isolating Content Effectiveness from Delivery
The real power of CTR is its ability to separate content quality from things like email deliverability or subject line effectiveness. A low Click Rate might be due to a poor subject line that nobody clicked, even if the content inside was brilliant. CTR sidesteps those initial hurdles.
If your campaign has a low CR but a high CTR, that's a crystal-clear diagnostic signal. The problem isn't your offer or your copy; it's that not enough people are opening the email in the first place. This allows your team to focus its energy on improving subject lines and preview text instead of mistakenly overhauling content that's already working well.
By measuring clicks against opens, CTR provides an apples-to-apples comparison for content. It ensures you're judging the quality of your message based on the people who actually read it, leading to smarter A/B tests and more reliable insights.
This focused approach is absolutely essential for making steady improvements. For example, a huge driver of high CTR is strong visual presentation. Following YouTube thumbnail best practices is critical for video content, and that same principle of visual appeal applies directly to email design.
The Statistical Case for CTR
Industry benchmarks consistently show why CTR is the superior performance indicator. The numbers don't lie: Click-Through Rate is a far better predictor of campaign success and is widely seen as the primary measure of email marketing performance. Research shows that a typical CTR ranges from 10% to 20% across industries, whereas Click Rate usually hovers between just 2% to 5%. You can dig deeper into these differences in this Klaviyo performance guide.
This 2-4x difference exists because CTR isolates the engaged recipients—the ones who already showed interest by opening the email. Click Rate, on the other hand, dilutes the performance data across your entire list, including all the people who never even saw the message. That statistical clarity makes CTR a much more sensitive and actionable metric for marketers and content creators.
Ultimately, the choice in the click rate vs click through rate debate comes down to what you're trying to measure. But for evaluating content, CTR is the undisputed standard. Its precision leads to more accurate A/B testing, clearer insights into what resonates with your audience, and a direct measure of your creative's persuasive power. Just remember, its reliability depends entirely on the quality of your data. Without accurate 'open' and 'click' events, the foundation of this powerful metric crumbles, making any analysis shaky at best.
Avoiding Common Pitfalls in Click Tracking

Knowing the difference between click rate and click-through rate is one thing, but both metrics are completely useless if the underlying data is garbage. For analysts, developers, and QA teams, keeping click tracking clean is a constant battle against a flood of technical glitches that can corrupt data and lead to some seriously bad business decisions.
Even a tiny tracking mistake can wreck your CR and CTR calculations. When these foundational metrics are unreliable, the whole analytics framework starts to fall apart. Good luck trying to prove campaign performance or justify your marketing spend then.
Misconfigured UTMs and Campaign Tagging Errors
One of the most common ways data gets corrupted is through sloppy campaign tagging. Urchin Tracking Module (UTM) parameters are the backbone of attribution, telling your analytics platform exactly where a click came from. Mess them up, and the entire data trail goes cold.
You see it all the time: simple typos, inconsistent naming ("email" in one campaign, "Email" in another), or just forgetting parameters entirely. These mistakes get clicks misattributed to "direct" or "referral" traffic, effectively wiping them from your campaign reports. This directly tanks both your Click Rate and CTR, making a winning campaign look like a total dud.
The Problem of Broken Tracking Pixels
Tracking pixels are tiny, often invisible, images embedded in emails or on web pages. Their whole job is to fire off data to an analytics server when a user does something, like open an email. The problem is, these pixels are notoriously fragile.
A pixel can break for a bunch of reasons:
- Incorrect Implementation: A snippet of code gets copied wrong or stuck in the wrong place in the HTML.
- Third-Party Blockers: Ad blockers and privacy extensions are great for users but can stop pixels from ever loading.
- Email Client Stripping: Some email clients will just strip out tracking code for privacy or security reasons.
When an open-tracking pixel fails, your open count is artificially low. This has a disastrous effect on CTR because the denominator in the (Clicks / Opens) formula is way smaller than it should be, giving you a wildly inflated and misleading number. On the flip side, if a click-tracking pixel on the destination page breaks, your click count drops, deflating both CR and CTR.
A broken pixel doesn't just create missing data—it actively creates false data. An inflated CTR from a failed open pixel might convince a team to pour more resources into content that isn't actually performing, wasting time and money.
DataLayer Mismatches and Rogue Events
In more advanced tracking setups, the dataLayer is the critical go-between for your website and analytics tools. It’s a structured object holding all the data you want to track. The trouble starts when the dataLayer’s structure, or schema, doesn't match what your analytics platform is expecting.
For example, a developer might push an update that changes an event name from email_click to link_click without telling the analytics team. The click still happens, but the analytics tool no longer recognizes it. Your click count plummets to zero overnight.
Even worse are rogue events—unexpected or duplicate events firing because of coding errors or tag manager issues. A badly configured trigger might record a single user click two or three times. This inflates your click count, which in turn pumps up both your CR and CTR, creating a completely false sense of success.
The Solution: Proactive and Automated Analytics QA
Trying to manually check for these problems across every single campaign and platform is a fool's errand. The only way to scale this is to implement an automated analytics quality assurance (QA) process. Modern observability platforms can act as a safety net, constantly monitoring your entire tracking setup from end to end.
This proactive approach means you need to:
- Establish a Single Source of Truth: Create a clear tracking plan that documents every event, property, and schema. No more guesswork.
- Continuous Monitoring: Automatically scan for any deviations from your plan, like missing properties, schema mismatches, or those rogue events.
- Real-Time Alerting: Get instant notifications in Slack or email the moment an issue like a broken pixel or UTM error pops up.
By catching these problems right when they happen, teams can fix them before they poison the data. This ensures that when you compare click rate vs click through rate, you’re working with numbers you can actually trust. That’s how you make genuinely data-driven decisions.
Building a QA Framework for Reliable Click Metrics
Bad data doesn’t just mess up your reports; it leads to bad business decisions. If you want to trust the insights you’re pulling from your click rate vs. click-through rate analysis, your analytics and data teams need a solid quality assurance (QA) framework. Think of it as your first line of defense, catching errors before they have a chance to poison your data.
Putting a system like this in place shifts your team from being reactive to proactive. Instead of finding a massive discrepancy weeks after the fact, you'll spot and fix issues almost as they happen. The goal is a reliable, automated process that ensures your click metrics are always on the money.
Auditing Your Existing Tracking Setup
First things first: you need to do a thorough audit of what you already have. This means mapping out every single touchpoint where click and open data gets generated and collected. This initial deep dive will almost certainly uncover legacy issues or weird inconsistencies that have been silently skewing your numbers for months.
Your audit should cover:
- Validating dataLayer Pushes: Get your hands dirty. Manually trigger key actions on your site and pop open the developer tools to inspect the dataLayer. Make sure click events fire when they’re supposed to and that they contain all the necessary properties, like campaign IDs and link URLs.
- Checking Pixel Implementations: Dig into your email templates to confirm that tracking pixels are placed correctly and loading properly. It's crucial to test emails across different clients—think Gmail, Outlook, and Apple Mail—to see if they handle your tracking code differently.
- Defining Custom Validation Rules: Set clear, non-negotiable rules for what makes an event valid. For example, a
product_clickevent must always come with aproduct_idand aprice. Any event that doesn’t meet this standard should be flagged immediately.
Automating for a Single Source of Truth
Manual audits are a great place to start, but they don't scale. A modern QA framework is built on automation. By using an observability platform, you can codify your tracking plan and create a "single source of truth" that all new tracking has to follow. This plan becomes the blueprint, and all incoming data is automatically checked against it.
Automation works around the clock, watching for any deviation from that blueprint. If a developer accidentally changes an event name or a marketing tool pushes out links with busted tags, the system will catch the mismatch instantly. This takes human error out of the equation and enforces consistent data governance across every team and platform. For more on this, our guide on website quality assurance testing offers a much deeper look into building these processes.
A single source of truth isn't just a document; it's an active, automated validation layer. It transforms your tracking plan from a static guide into a dynamic enforcement mechanism that maintains data integrity 24/7.
Setting Up Proactive Monitoring and Alerts
The final piece of your framework is a smart alerting system. Continuous monitoring is useless if the right people aren't notified the second something breaks. You need to set up automated alerts for critical issues that could wreck your click metrics.
Configure alerts for these common failure points:
- Sudden Metric Drops: If tracked clicks for a campaign suddenly nosedive, it’s often a sign of a broken link or a misconfigured UTM parameter.
- Schema Mismatches: When an event shows up with missing or incorrectly formatted properties, an alert should go straight to the development team with all the details of the non-compliant data.
- Rogue Event Spikes: A sudden flood of events could signal a bug causing duplicate tracking, which would artificially inflate both your CR and CTR.
By integrating these alerts with tools your team already uses, like Slack or Microsoft Teams, you empower them to fix problems fast. This proactive approach ensures that when you're analyzing the difference between click rate vs click-through rate, you're working with data that is complete, accurate, and trustworthy.
Frequently Asked Questions
When you get down to the practical differences between click rate and click-through rate, a few common questions always pop up, especially when real-world data starts throwing curveballs. Here are some quick, clear answers to the queries we see most often from analytics and marketing teams.
Can My Click Rate Be Higher Than My Click-Through Rate?
No, that’s mathematically impossible if your metrics are set up correctly. Think about it: the total number of emails delivered will always be greater than or equal to the number of emails opened. Since CTR’s denominator (opens) is just a subset of CR’s denominator (delivered), your CTR percentage will almost always be higher.
If your analytics ever show a CR higher than your CTR, treat it as a major red flag. This points to a serious tracking error, like a broken open-tracking pixel, or a fundamental flaw in how your metrics are defined in your reporting tools.
How Does Apple's Mail Privacy Protection Affect These Metrics?
Apple's Mail Privacy Protection (MPP) has a huge impact here, mainly because it pre-loads email content, which artificially inflates open rates. Since CTR is calculated using opens (Clicks ÷ Opens), a bloated denominator is going to artificially deflate your actual CTR, making the metric far less reliable.
This is why Click Rate (Clicks ÷ Delivered) has become a much more stable and trustworthy metric for comparing campaign performance over time. It’s especially true if a large chunk of your audience uses Apple Mail.
What Are Good Benchmarks For Click Rate and CTR?
This is the million-dollar question, but the truth is, a universal "good" number doesn't really exist. Benchmarks vary wildly depending on your industry, audience, and the type of content you're sending. Still, some general guidelines can give you a starting point for the click rate vs click through rate conversation.
- Average Click Rates typically land somewhere between 2-5%.
- Average Click-Through Rates are much higher, often ranging from 10-20%.
Honestly, the most effective approach is to benchmark against your own historical performance. Stop chasing universal averages that might not even apply to your business and focus on achieving steady, incremental improvement instead.
Ensure every click tells the right story. Trackingplan provides automated analytics QA to validate your tracking, fix data errors in real time, and guarantee your click metrics are always accurate. Maintain data integrity with Trackingplan.