Discover how modern data quality solutions clean your analytics, automate QA, and deliver reliable insights. Stop bad data and boost your ROI.
Data quality solutions are the systems and processes you put in place to catch, monitor, and fix data errors before they poison your business intelligence. Think of them as an automated quality control layer that ensures the information flowing into your analytics and marketing tools is accurate, consistent, and actually trustworthy.
Why Your Analytics Dashboards Cannot Be Trusted

Ever launched a huge marketing campaign, only to find your analytics dashboards are telling completely different stories? This isn't just a hypothetical nightmare—it's the daily reality for countless teams stuck battling the fallout from bad data. The trust you place in those dashboards is only as solid as the data feeding them.
What seems like a minor error can quickly snowball into a major business problem. A broken tracking pixel can silently kill your conversion data, making it impossible to tell if a campaign is a hit or a miss. Inconsistent UTM parameters can turn attribution into a guessing game, leaving you wondering which channels are actually driving results.
The Real-World Cost of Bad Data
When data quality starts to degrade, the pain is felt across the entire organization. Every single decision made from flawed information is a gamble, actively undermining strategic plans and burning through valuable resources. This slow erosion of trust is exactly what proactive data quality solutions are built to prevent.
The consequences show up in a few painful ways:
- Wasted Ad Spend: Marketing teams might double down on a campaign that looks like a winner but is actually propped up by faulty data. That's real money down the drain.
- Flawed Personalization: Inaccurate user data leads to generic or just plain wrong personalization, damaging the customer experience and tanking engagement.
- Loss of Credibility: When analysts present conflicting reports, leadership starts to lose faith—not just in the data team, but in the entire analytics infrastructure.
High-quality data is the bedrock of trust in analytics. It’s what makes machine learning (ML) models perform better and what gives strategic initiatives a fighting chance. Without it, even the most sophisticated tools will churn out unreliable garbage.
If you’re constantly second-guessing your dashboards, it might be time to get some expert help. Top-tier business intelligence consulting services can be invaluable in turning raw, messy data into genuinely reliable insights.
A Cross-Functional Crisis
This isn’t just a marketing problem or an analytics problem; it’s an everyone problem. It hits anyone who relies on data to do their job.
Marketers can't figure out attribution. Analysts are constantly questioning their own reports. And developers get pulled into frustrating fire drills, spending hours hunting for the source of a data discrepancy that shouldn't have happened in the first place.
The symptoms are often subtle at first. You might notice some signs your analytics is broken when key metrics swing wildly for no reason, or when two different platforms show completely different numbers for the exact same event. These are blaring red flags signaling underlying data quality issues.
Ultimately, without a system to guarantee data integrity, your organization is flying blind. Investing in data quality is no longer an optional "nice-to-have." It's a foundational requirement for any business that wants to be truly data-driven, shifting the focus from reactive firefighting to proactive prevention.
So, what exactly are data quality solutions? Let's cut through the jargon.
Forget complex, abstract definitions. Think of a data quality solution as an automated quality control inspector for your company’s entire data pipeline. It’s like having a dedicated team that never sleeps, watching every single piece of data as it moves from your app or website to your analytics tools.
Picture a busy factory assembly line. At various points, inspectors check products to make sure they meet specific standards—no defects, correct parts, proper assembly. If a flawed product shows up, it’s flagged immediately before it ever gets boxed up and shipped to a customer.
That’s exactly what modern data quality solutions do, but for your digital information. They inspect every event and user interaction flowing from your website or app. Their job is to guarantee that only clean, accurate, and consistent data makes it to its destination, whether that’s Google Analytics, your CRM, or a marketing automation platform.
From Manual Fire Drills to Automated Prevention
Not too long ago, "data quality" was a reactive, manual nightmare. An analyst would spot a bizarre trend in a report—maybe sales drop to zero for no reason—and a frantic, time-consuming investigation would kick off. This is like finding out your products are defective only after customers start complaining. It’s too late, and the damage is done.
That old approach just doesn't scale. The sheer volume and velocity of data today make manual checks completely impossible. Data quality solutions flip the script entirely, shifting the process from reactive cleanup to proactive prevention.
They operate as a powerful, automated system built to maintain data integrity from the very beginning. Instead of waiting for problems to poison your dashboards, these platforms act as a gatekeeper, catching issues right at the source.
The Core Jobs of a Data Quality Platform
So, how does this automated inspector actually work its magic? A true data quality solution isn't just a single tool; it’s a platform with several core functions working in unison to give you complete oversight of your data's journey.
Here are the key jobs it handles:
- Automated Validation: The platform constantly checks incoming data against a set of predefined rules or an established “tracking plan.” For example, it can verify that a
product_idis always a number and not a text string, catching schema errors the moment they happen. - Real-Time Monitoring: It keeps a vigilant eye on the flow of data, looking for unexpected changes, anomalies, or sudden drops in volume. If your "add to cart" events suddenly stop firing after a new website deployment, the solution will know instantly—not a week later.
- Intelligent Alerting: When an issue is spotted, the platform doesn’t just log it and hope someone sees it. It sends an immediate, actionable alert to the right team through channels like Slack or email. This turns a potential week-long data mystery into a problem that gets fixed in minutes.
A data quality solution is fundamentally a system of prevention. Its primary goal is to stop bad data from ever polluting your analytics tools, preserving the integrity of your reports and the trust your team has in them.
By automating these crucial checks, data quality solutions let teams make decisions based on information they know they can rely on. They transform data governance from a burdensome manual chore into a seamless, automated process that protects your most valuable asset: your data.
Common Data Issues That Wreck Your Analytics
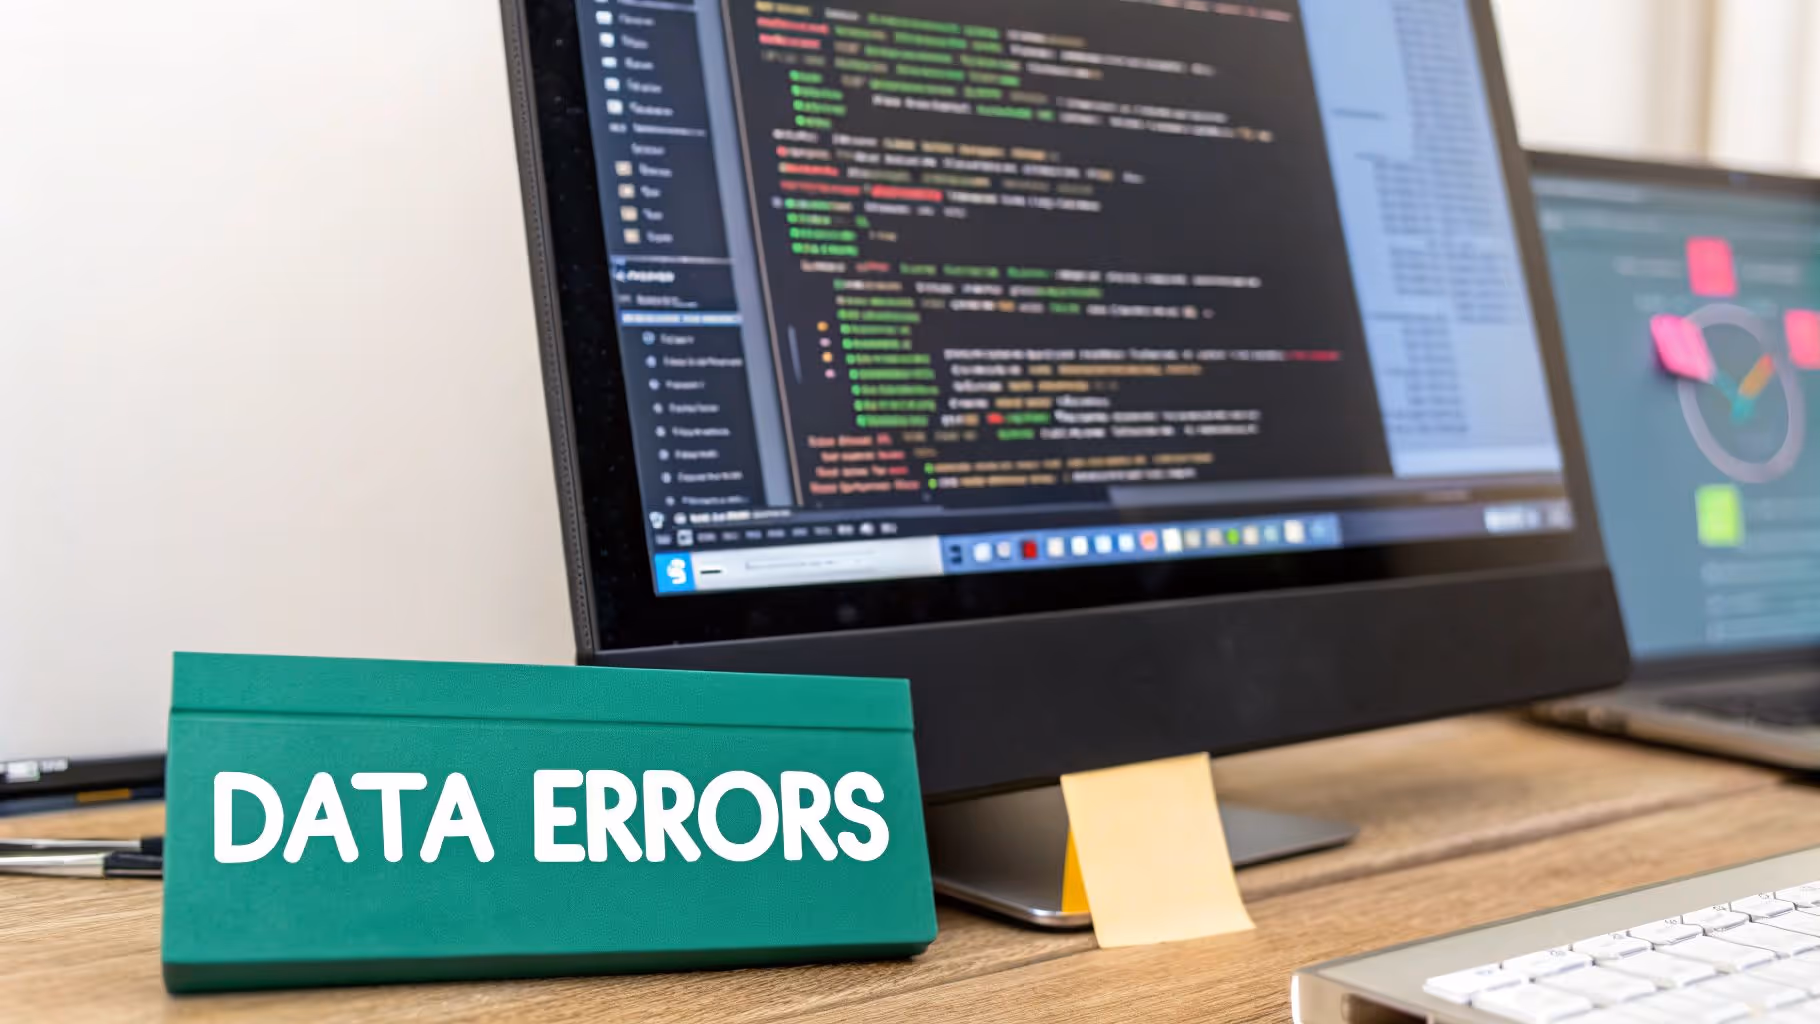
While "bad data" sounds simple enough, the reality is a minefield of specific, often hidden issues that can completely derail your analytics. These are the data gremlins that quietly corrupt your reports, break your dashboards, and make confident decision-making impossible.
Think of your data pipeline like a plumbing system. A single crack or a clogged pipe can contaminate the entire supply. In the same way, one seemingly small data error can have a cascading effect, polluting every report and analysis downstream. Understanding these common culprits is the first step toward finding effective data quality solutions.
Data quality problems aren't just technical glitches; they have real, tangible consequences for the business. From misallocated marketing budgets to flawed product strategies, the impact is felt across the organization.
Here's a quick look at some frequent issues and the trouble they cause:
Common Data Quality Issues and Their Business Impact
Data Quality IssueCommon CauseBusiness ImpactSchema DriftUnannounced changes in data structure during code deployments.Broken dashboards, inaccurate metrics, and failed data processing.Rogue EventsTest data from staging or QA environments leaks into production.Inflated revenue numbers, skewed conversion rates, and misleading performance reports.Inconsistent TaggingLack of standardized naming conventions for UTMs or events.Fragmented attribution, inability to measure campaign ROI, and wasted ad spend.Missing DataTracking code fails to fire, or essential parameters are left empty.Incomplete user journeys, lost attribution, and an inability to analyze key behaviors.Invalid FormatsA field expecting a number receives text (e.g., price sent as "$9.99").Calculation errors, corrupted reports, and segments that fail to build correctly.
These issues are more than just an annoyance for analysts. They actively undermine the trust leadership has in the data, making it impossible to rely on analytics for strategic guidance.
Schema Drift: The Silent Report Killer
One of the most frequent and frustrating issues we see is schema drift. This happens when the structure of your data changes unexpectedly. Imagine your analytics setup expects a product_id to always be a number, but a developer pushes an update that suddenly changes it to a text string (like from 12345 to "SKU-12345").
Instantly, every report that relies on that numeric ID breaks. Your sales dashboards might show zero revenue for that product, or your entire analytics tool could fail to process the event.
Schema drift often comes from rushed code deployments or a simple lack of communication between development and analytics teams. Without a monitoring system in place, these changes can go unnoticed for weeks, silently invalidating your most critical business metrics.
Rogue Events and Data Pollution
Another common problem is the infiltration of rogue events. These are events that don't belong in your production dataset, usually leaking from testing or staging environments. For instance, a QA team might be stress-testing the checkout process, creating thousands of fake "Purchase" events.
If those test events accidentally get sent to your live Google Analytics property, your revenue numbers will be massively inflated. This pollution makes it impossible to distinguish real customer behavior from artificial test data, rendering your conversion rates and ROI calculations totally meaningless.
The real danger of rogue events is that they create a false reality. You might celebrate a record-breaking sales day, only to discover later that it was driven by internal testing, completely skewing your understanding of market performance.
Inconsistent Campaign Tagging and Broken Attribution
For marketers, nothing corrupts data faster than inconsistent campaign tagging. UTM parameters (utm_source, utm_medium, etc.) are the backbone of attribution, telling you exactly where your traffic and conversions are coming from. When these tags are applied inconsistently, chaos ensues.
Consider these common tagging errors:
- Case Sensitivity: A link tagged with
utm_source=Facebookand another withutm_source=facebookwill show up as two separate sources in your reports, splitting your data. - Naming Conventions: One team might use
utm_medium=cpcwhile another usespaid-search. This fragmentation makes it impossible to get a clear, aggregated view of your paid advertising performance. - Missing Tags: A high-spend ad goes live without any UTM parameters. All the valuable traffic it generates gets dumped into the "Direct" or "(not set)" bucket, making it look like your campaign generated zero results.
When tagging is a mess, your attribution models fall apart. You can no longer tell which campaigns are driving ROI, leading directly to wasted ad spend and missed growth opportunities. These issues highlight the urgent need for automated data quality solutions that can enforce conventions and catch errors before they corrupt your entire marketing analysis.
Core Capabilities of Modern Data Quality Platforms
Once you’ve pinpointed the usual suspects that throw your analytics off track, the next step is to look at the solution. A modern data quality platform is much more than a simple error log—it's an intelligent, automated system built to proactively defend the integrity of your entire analytics stack. These platforms bring a core set of capabilities that set them miles apart from the old, manual ways of validating data.
Understanding these features is the key to picking a tool that doesn't just find problems but helps you fix them, fast. The real goal here is to move past those painful, periodic data audits and step into a new reality of continuous, automated observability. This isn't just a trend; it's a necessary response to the sheer volume of data we're all dealing with.
The market for these tools is booming for a good reason. Projections show the data quality tools market hitting USD 2.78 billion in 2025 and jumping to USD 6.34 billion by 2030. This growth is a direct reflection of the urgent need for automation as businesses try to manage the 181 zettabytes of data expected by 2025—a scale that makes manual oversight flat-out impossible.
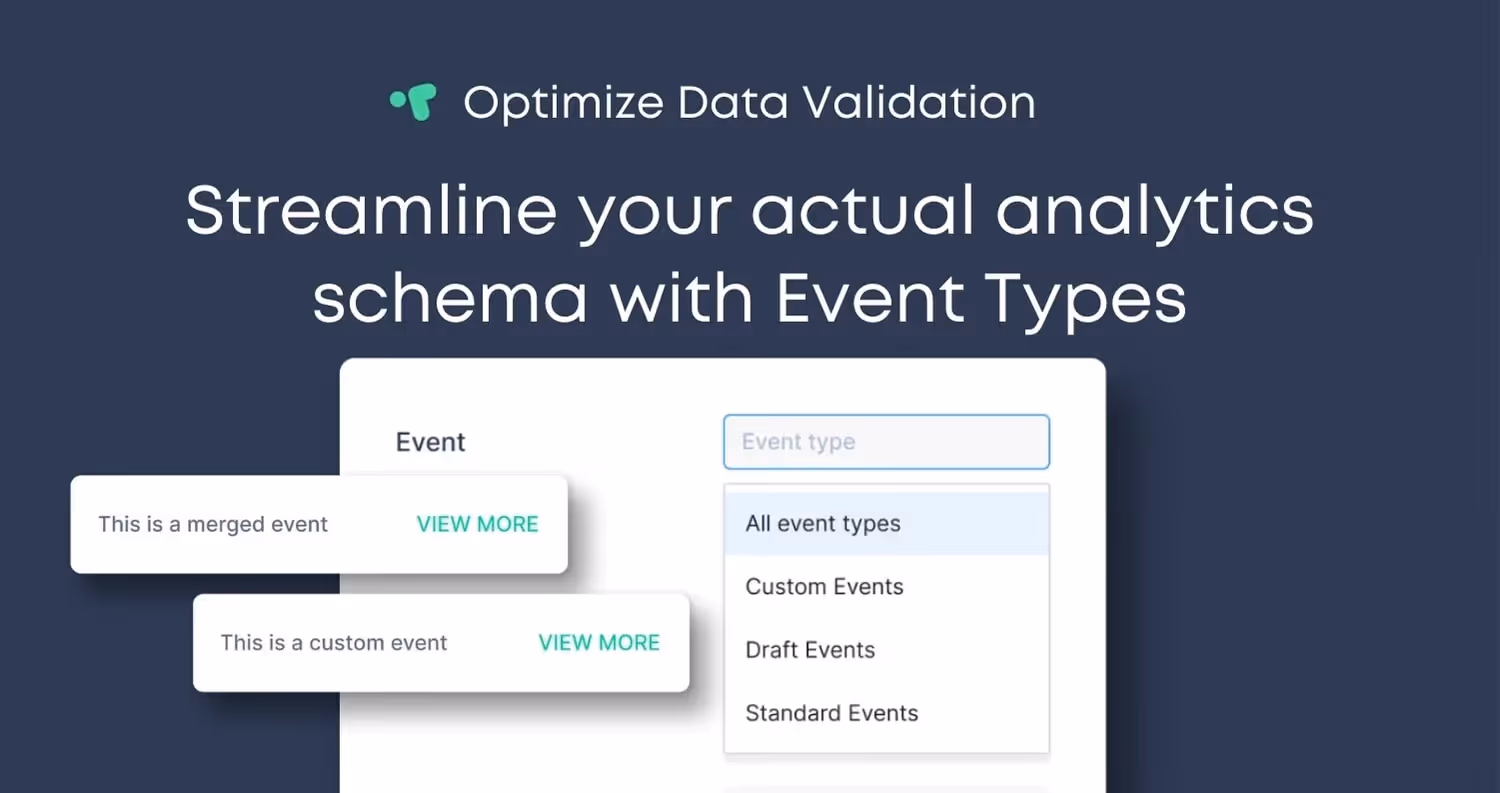
Automated Discovery and Analytics Mapping
The first thing any truly effective platform needs is automated discovery. So many organizations are working with undocumented or outdated tracking plans, which makes it nearly impossible to know what data you're supposed to be collecting. Instead of demanding a perfect tracking plan from day one, modern solutions automatically discover and map out your entire analytics implementation based on live user traffic.
This process essentially reverse-engineers your tracking setup. It creates a living, always-current catalog of every single event, property, and destination. It shows you where data is coming from (your website or app), where it’s headed (Google Analytics, Mixpanel, ad platforms), and exactly what it looks like at every step.
This creates a single source of truth that becomes essential for developers, marketers, and analysts, finally giving a clear answer to the question, "What are we actually tracking?"
The screenshot below gives you an idea of how a platform can create a clean, visual map of your analytics ecosystem, from the sources all the way to their destinations.
Seeing it laid out like this is powerful. It instantly clarifies complex data flows that are usually buried deep in code or scattered across different team documents.
Real-Time Anomaly Detection and Smart Alerting
Once your analytics stack is mapped, the next critical capability is real-time anomaly detection. A modern platform doesn't sit around waiting for a weekly report to tell you something's wrong. It actively watches your data streams 24/7, using smart algorithms to spot any deviation from established patterns the second it happens.
This covers a whole range of common problems:
- Traffic Anomalies: A sudden, unexpected drop in "page_view" events right after a new deployment.
- Missing or Rogue Events: The "purchase_complete" event stops firing, or worse, test events start polluting your production data.
- Schema Mismatches: A
product_priceproperty that has always been a number suddenly shows up as a string, completely breaking your revenue calculations.
When an anomaly is spotted, the platform sends an immediate, context-rich alert to the right people through tools like Slack or email. This single feature transforms data quality from a reactive fire drill into a proactive, automated process. You can learn more about how it works to see this automated monitoring in action.
The true power of real-time alerting is speed. It shrinks the time between a problem’s creation and its resolution from weeks or days down to mere minutes, preventing bad data from ever making a significant business impact.
Automated Root-Cause Analysis
Finding a problem is only half the battle. The part that really eats up time is figuring out why it happened. This is where automated root-cause analysis changes the game. Instead of just flagging an error, advanced data quality solutions provide the exact context developers need to fix it quickly.
For example, if an event breaks, the alert won’t just say "event failed." It will pinpoint the exact code release, feature flag, or version update that caused the issue. This lets developers jump in and resolve bugs in minutes by cutting out all the frustrating guesswork that usually comes with debugging analytics. It also builds a bridge between technical and non-technical teams, creating a shared language for talking about and solving data issues efficiently.
How to Put Your Data Quality Strategy Into Action
Bringing a new tool into the mix can feel like a huge project, but weaving powerful data quality solutions into your daily workflows doesn't have to be a headache. The real goal is to make data quality operational—turning it from a one-off cleanup project into an automated, continuous process. This shift means you can finally stop fighting fires and start building a proactive discipline that protects your analytics from the very beginning.
The secret is a streamlined implementation that starts delivering value almost immediately. Most modern solutions get going with a simple tag or SDK added to your website or app. This lightweight approach kicks off the discovery process without a long, complicated setup, letting you see your entire analytics ecosystem in a whole new light within hours, not weeks.
This process flow shows how a modern data quality platform cuts through the chaos, breaking the journey down into three core stages.
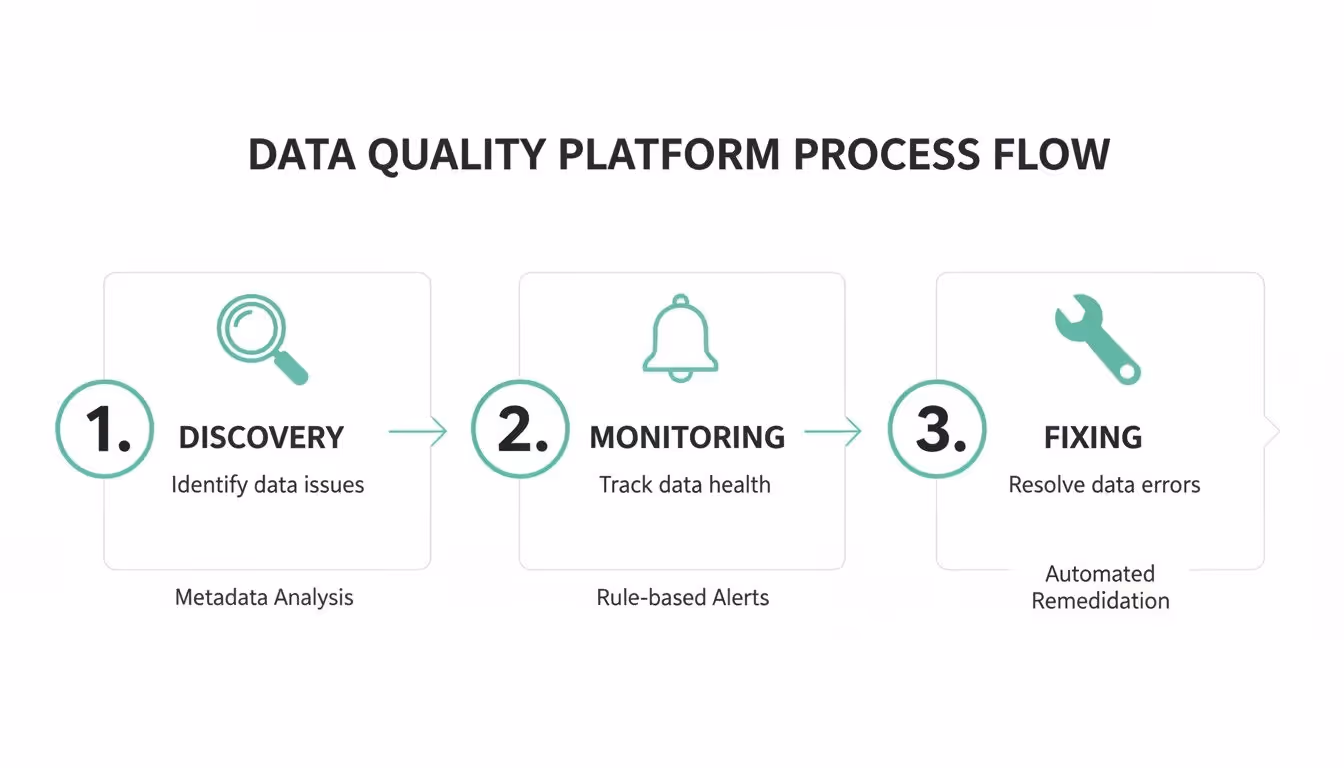
As you can see, effective data quality management isn’t a one-and-done task. It's a continuous cycle of discovery, real-time monitoring, and quick, efficient fixes.
A Phased Approach to Implementation
A practical rollout isn’t about flipping a switch overnight. It’s about building momentum and proving the tool's worth at each step. This gradual approach ensures your teams can adapt without feeling overwhelmed and helps build confidence in the new process.
A typical implementation follows a pretty logical path:
- Initial Discovery and Mapping: First things first, you need visibility. After a simple installation, the platform automatically maps out every single event, property, and destination. The result is a complete, up-to-date inventory of your entire analytics implementation.
- Configuring Baseline Monitoring: With a clear map in hand, you can set up your first alerts for the big, critical issues. This could be monitoring core conversion events (like "purchase" or "sign_up") for any sudden drops or watching for major schema changes that could wreck your dashboards.
- Expanding to Granular Rules: Once the baseline is stable, you can get more specific. This is where you start creating more detailed validation rules, like enforcing UTM naming conventions for marketing campaigns or making sure a
user_idis always present for logged-in actions. - Integrating with Team Workflows: The final piece is piping alerts directly into the tools your teams already live in, like Slack or your project management software. This makes sure the right person gets notified the instant an issue relevant to them pops up.
Fostering Cross-Team Collaboration
Here’s the thing about data quality: it's a team sport. It demands smooth collaboration between marketing, analytics, and development—teams that have historically worked in their own silos. A shared platform acts as a neutral territory, giving everyone a single source of truth they can all trust.
This shared visibility is a game-changer for breaking down communication barriers.
When a marketer, an analyst, and a developer are all looking at the same data quality dashboard, the conversation shifts from "Whose fault is this?" to "How do we fix this together?" This collaborative environment is crucial for diagnosing and resolving issues efficiently.
Think about it. When a broken pixel is detected, an automated alert can go straight to a shared Slack channel. The marketing manager sees the business impact, the analyst confirms the data loss, and the developer gets the technical details needed for a quick fix—all from the same notification. This shared context gets rid of the frustrating back-and-forth that usually slows bug fixes to a crawl.
Creating a Proactive Data Quality Culture
Ultimately, operationalizing data quality is about shifting the entire organization's mindset from reactive to proactive. It’s about catching problems before they ever poison a dashboard and building a culture where everyone feels responsible for keeping the data clean.
To build this kind of culture, focus on a few key practices:
- Establish Clear Ownership: Define who is responsible for which parts of your analytics implementation.
- Automate Everything Possible: Lean on automated monitoring and alerts to cut down on manual work and human error.
- Celebrate Quick Fixes: Give a shout-out to teams that use the platform to spot and solve issues quickly.
By turning data governance into a simple, automated part of your daily operations, you empower every team to trust the data they rely on. Your analytics stack is transformed from a source of uncertainty into a reliable engine for growth.
Driving ROI with Automated Analytics QA
When you connect the dots between clean data and business growth, the picture becomes incredibly clear. Schema drift, rogue events, and inconsistent tagging aren't just technical headaches—they're direct threats to your bottom line. The real answer isn't piling on more manual audits or building bigger spreadsheets. It’s a fully automated observability platform.
Think of this kind of platform as a guardian that never sleeps, monitoring your entire analytics stack around the clock. It keeps an eye on everything, from the initial dataLayer push on your website all the way to its final stop in Google Analytics, your ad platforms, and beyond. This is what separates modern data quality solutions from the old, reactive ways of doing things.
It’s all about shifting from damage control to damage prevention. Instead of finding out about a data disaster weeks after it happened, your teams get immediate, actionable alerts that protect revenue and make everyone more efficient.
Real-World ROI in Action
This isn't just about having prettier dashboards. It's about tangible business results you can actually measure. The value of automated analytics QA becomes undeniable when you see it solve real, expensive problems in minutes.
Just imagine a couple of scenarios where this tech delivers instant ROI:
- Saving a High-Spend Campaign: A marketer kicks off a huge Facebook campaign with a six-figure budget. Right after a new code deployment, the platform detects that the Facebook pixel is broken and firing incorrectly. An instant alert goes out to the marketing and dev teams. They pause the campaign, fix the bug in minutes, and save thousands in wasted ad spend.
- Ensuring Report Confidence: An analyst is prepping a quarterly review for the leadership team. Because of continuous monitoring, they can present their findings with total confidence. They know the data is solid, free from the kind of errors that lead to awkward questions and a loss of credibility.
The real value isn't in the features themselves, but in the business outcomes they create. Cutting out manual work, preventing costly data loss, and giving teams data they can finally trust—those are the true drivers of ROI.
From Technical Debt to Business Asset
Manual data validation is just another form of technical debt. It quietly accumulates interest with every flawed report and misinformed decision. Automated data quality solutions pay down that debt by building a system of accountability and reliability you can count on. For anyone serious about proving their impact and boosting profitability, implementing effective marketing ROI measurement strategies is a must, and it all begins with data you can trust.
This automated approach also unlocks huge efficiency gains. The reality is that time is money, and Trackingplan’s role in digital analytics efficiency is to give that time back to your people. Developers are freed from chasing down tedious bugs, analysts can focus on strategy instead of validation, and marketers can run campaigns knowing their measurement is spot-on. This shift transforms your analytics from a fragile liability into a dependable asset for growth.
Frequently Asked Questions About Data Quality Solutions
Let's be honest, diving into the world of data quality solutions can feel a bit overwhelming. If you're used to putting out fires manually, the shift to a more automated, proactive approach brings up a lot of valid questions. Here are some of the most common ones we hear from teams just like yours.
What Is the Difference Between Data Observability and Traditional Data Quality Tools?
This is a big one. Think of traditional data quality tools as a cleanup crew. They show up after the data has already landed in your warehouse to clean, standardize, and de-duplicate it. They're reactive, tidying up a mess that's already been made downstream.
Data observability is completely different—it’s all about prevention. It monitors your data "in motion," watching it as it travels from your website or app to its final destination. This approach catches things like a broken tracking event or a schema mismatch the moment they happen, stopping bad data from ever polluting your analytics tools in the first place. It’s the difference between cleaning up a spill and preventing it from ever happening.
How Quickly Can We See Value After Implementation?
Almost instantly. This isn't one of those old-school software rollouts that takes months to set up and even longer to show results. Most modern platforms use a simple, tag-based installation that you can get running in just a few minutes.
Once the tag is live, an automated platform starts discovering your entire analytics implementation and spotting anomalies within hours. You’ll get actionable alerts and a complete picture of your data health on day one. The ROI is immediate because you start preventing costly errors before they can ever impact the business.
Our Analytics Implementation Is Complex and Undocumented. Can a Solution Help?
Absolutely. In fact, that's exactly where these solutions shine. Modern data quality solutions are built for the messy reality of complex, often undocumented analytics setups. You don’t need a perfect, pre-existing tracking plan to get started.
Instead, the platform automatically discovers and maps out your entire implementation by observing live user traffic. It essentially reverse-engineers your tracking plan, giving you a single source of truth that's always up-to-date. It cuts through the "undocumented chaos" from the get-go by giving every team a clear, accurate view of what’s actually being tracked. This visibility is the crucial first step toward building real data governance.
Ready to stop chasing data errors and start trusting your analytics? Trackingplan offers a fully automated observability platform that discovers, monitors, and validates your entire analytics stack in real time. Get a demo today and see how you can achieve reliable data with zero manual effort.