Exit rate vs bounce rate: A Clear Guide to Better Conversions
Learn exit rate vs bounce rate and how to optimize pages to boost conversions.
David Pombar
Swiss army knife at Trackingplan
January 27, 2026
TL;DR
The real difference between exit rate and bounce rate is pretty simple once you get the hang of it. A bounce is a one-and-done visit—someone lands on a page and leaves right away without clicking anything else. An exit, on the other hand, is just the last page someone sees before they leave, no matter how many other pages they visited during their session.
Think of it like exploring a house. A bounce is like someone walking into the foyer, looking around for a second, and immediately walking back out the front door. An exit is leaving the house from any room—maybe they explored the kitchen, the living room, and then left from the back porch.
Decoding User Intent: What These Metrics Reveal
Getting the distinction between exit rate and bounce rate right is fundamental for any meaningful website analysis. If you mix them up, you could end up chasing the wrong problems, leading to flawed marketing strategies and wasted resources. While both metrics tell you when users leave your site, they tell two completely different stories about their behavior and intent.
A bounce often signals a problem with a landing page's relevance or appeal, while an exit simply highlights the last stop in a user's journey, which could be perfectly normal.
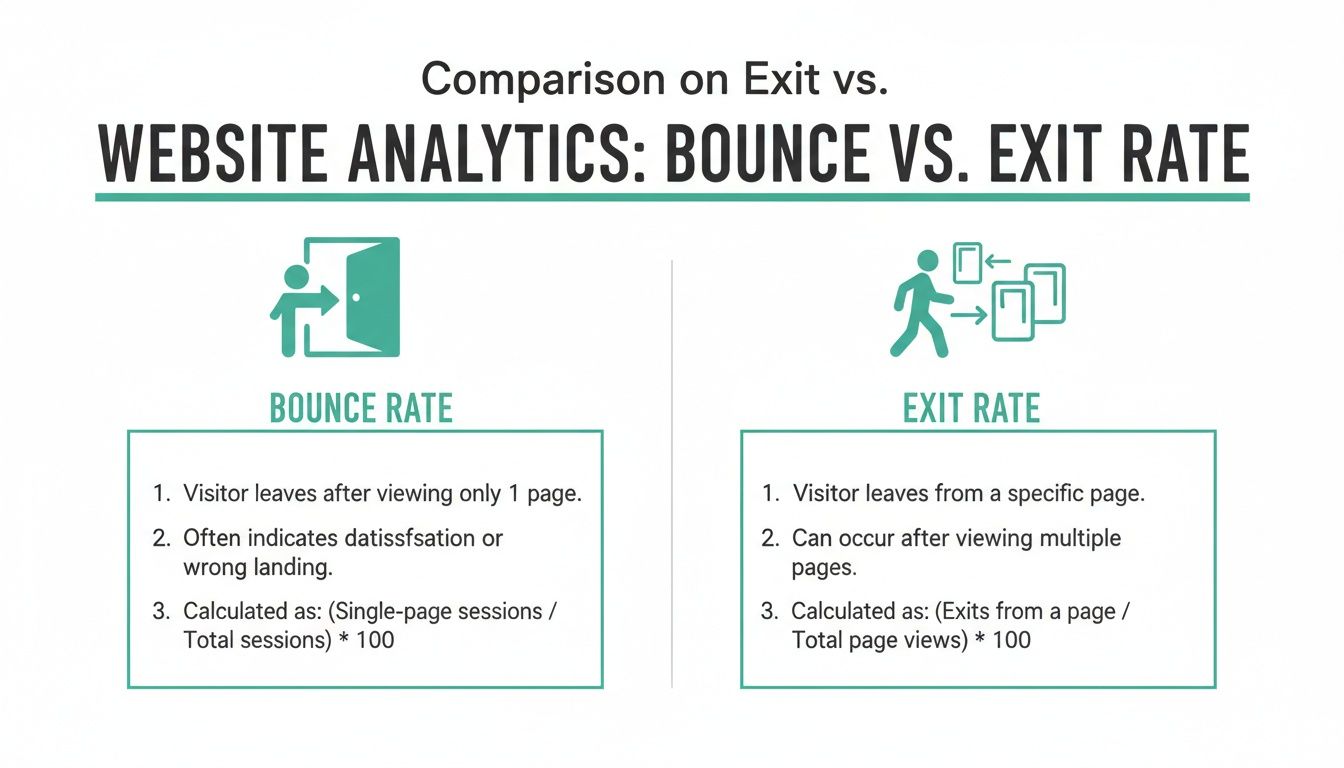
This visual breaks down the core concepts perfectly.
As the infographic shows, a bounce is an immediate departure. An exit is the conclusion of a journey that might have included several steps.
Why Context Is Everything
A high number for either of these metrics isn't automatically "good" or "bad." The context is what matters. For example, a high bounce rate on a blog post that thoroughly answers a user's question can actually be a sign of success—they found what they needed and left satisfied.
But a high exit rate on the second step of your checkout process? That’s a massive red flag. It points to a serious leak in your conversion funnel that needs immediate attention.
Every bounce is an exit, but not every exit is a bounce. This is the key. Internalizing this distinction helps you diagnose whether you have a landing page problem (high bounce rate) or a user journey problem (high exit rate).
Industry benchmarks also show these metrics behave differently. One survey found the median bounce rate to be 44.04%, while exit rates are generally lower, with many sites reporting rates under 40%. You can check out the full research on these findings over at Databox.com.
Exit Rate vs Bounce Rate At a Glance
To make it even clearer, here’s a quick breakdown of the fundamental differences between these two crucial metrics.
Aspect
Bounce Rate
Exit Rate
Key Question Answered
Focus
Measures how effective an entry page is at engaging a user.
Identifies the last page a user viewed in any given session.
"Did the first page I saw meet my immediate needs?"
Scope
Only applies to single-page sessions (where the entry is also the exit).
Applies to all sessions, regardless of how many pages were viewed.
"On which page did I ultimately decide to leave the site?"
Action
A user lands on a page and leaves without triggering any other events.
A user views one or more pages before leaving from a specific page.
"What was the last thing I saw or did on the site?"
Use Case
Perfect for evaluating the performance and relevance of landing pages.
Essential for finding leaks and points of friction in a conversion funnel.
"Where is the biggest friction point in my user journey?"
Ultimately, understanding which metric to use and when is what separates surface-level analysis from deep, actionable insights. Bounce rate tells you about first impressions, while exit rate maps out the final moments of a user's journey on your site.
How Exit Rate and Bounce Rate Are Calculated
To really get the difference between exit rate and bounce rate, you have to look at the math. The formulas themselves show you the specific user behaviors each metric is built to track, which clears up a lot of confusion about when and why you should use them.
Even though they sound alike, their calculations are focused on completely different scopes. Bounce rate only cares about single-page sessions. Exit rate, on the other hand, looks at all sessions, no matter how many pages a user clicked through.
The Classic Formulas Explained
Let's break down the old-school formulas that platforms like Universal Analytics used. Seeing how the numbers are crunched helps you interpret your analytics data with a lot more confidence.
Bounce Rate Calculation
The bounce rate formula is pretty simple: it’s the percentage of sessions that started and ended on the very same page.
Bounce Rate = (Total Single-Page Sessions ÷ Total Sessions Starting on That Page) x 100
For instance, say a landing page gets 1,000 total sessions, and 400 of those were single-page visits. The bounce rate for that page is 40%. This tells you that four out of every ten visitors landed and left without doing anything else.
Exit Rate Calculation
The exit rate calculation is different. It takes into account every time a page was viewed, not just when it was the first page of a session. It’s designed to pinpoint which pages are the most common final stop in a user's journey.
Exit Rate = (Total Exits from a Page ÷ Total Pageviews of That Page) x 100
Imagine a checkout page gets 500 total pageviews, and 100 sessions end right there. Its exit rate is 20%. This metric is crucial for finding the leaks in your conversion funnel.
Here's where it gets interesting. One metrics analysis showed that on a test page with four sessions, two exits resulted in a 50% exit rate. But the bounce rate only hit 50% if two of those sessions were single-page visits. If three of the four sessions ended there, the exit rate jumped to 75%. This is a great illustration of a key concept: all bounces are exits, but not all exits are bounces. Exits can happen after long, multi-page journeys—a critical insight for any performance marketer. You can find more details on this kind of analysis at Optimizely.com.
The Modern Shift to Engagement in GA4
Google Analytics 4 (GA4) completely changed this conversation by pretty much ditching the traditional bounce rate. Instead, GA4 focuses on a more positive metric: engagement rate. In the GA4 world, a "bounce" is just what's left over—it's the inverse of your engagement rate.
An "engaged session" is defined as a session that meets one of these criteria:
Lasts longer than 10 seconds.
Includes a conversion event.
Has at least two pageviews.
If a session doesn't check any of those boxes, GA4 considers it a bounce. This change pushes analysts to focus on what users are doing, not just on the fact that they left quickly. For a deeper dive, you can check out our guide on understanding GA4 sessions and engagement metrics.
When Your Bounce Rate Is a Real Problem
Let's be clear: a high bounce rate isn't always a disaster. If someone lands on a blog post, finds the perfect answer to their question, and leaves, you could argue that's a win. They got what they needed. But in most other cases, a high bounce rate is a flashing red light on your analytics dashboard—a sign of a serious disconnect between what a user expected and what your page delivered.
Nowhere is this more critical than in paid advertising. When you're putting money on the line to bring people to a landing page, every single bounce is cash out the window. If users from a targeted ad campaign hit your page and immediately click away, your ad spend is leaking, and your ROI is taking a nosedive. This almost always points to a mismatch between your ad copy and the actual on-page experience.
Diagnosing the Disconnect
A high bounce rate on your core service or product pages is another huge red flag. It tells you that potential customers aren't finding the information they need to take the next step. The same goes for blog posts that are supposed to pull readers deeper into your site; if they're bouncing, your content strategy or user experience is failing to create that "what's next?" curiosity.
A bounce rate between 26% and 40% is often considered excellent, while 41% to 55% is about average. Once you start creeping above 70%, it's usually a problem for most pages, with the exception of single-purpose content like blogs or dictionaries.
A Practical Diagnostic Checklist
When you spot a bounce rate that makes you nervous, it's time to play detective. This goes beyond just the exit rate vs bounce rate debate; it's about figuring out why that crucial first impression fell flat. You need to methodically check for the common culprits.
Here’s a simple checklist to get you started:
Traffic Source Alignment: Does the user's intent match the page content? If your ad promises "running shoes" but the page is a generic athletic gear category, you've created a disconnect. This is the number one cause of bounces.
Page Load Speed: Is your page painfully slow? Studies have shown that even a one-second delay can send bounce rates soaring. Test your page speed on both mobile and desktop.
Mobile Experience: Pull up the page on your phone. Seriously. Is the layout a mess? Is the text too small to read? If navigating the page feels like a chore, mobile users are gone in a flash.
Content Clarity and Value: Does the headline instantly reassure the user they're in the right place? Is your value proposition crystal clear within the first few seconds?
Once you've figured out that your bounce rate is a symptom of a bigger issue, you can start digging into specific strategies for how to reduce bounce rate on your website.
Using Exit Rate to Pinpoint Funnel Leaks
While bounce rate helps diagnose a bad first impression, exit rate is the metric you turn to when you need to find the exact leaks in a user's journey. It's an indispensable tool for figuring out precisely where and why users are abandoning a specific path, especially one as critical as a conversion funnel.
Think of it as a map that highlights the exact spots where your carefully designed user flow is breaking down. A high exit rate on a 'Thank You' or order confirmation page is completely normal—that's the logical end of the road. But when you see a spike in exits on a page that’s supposed to lead users forward, you’ve got a major red flag that needs investigating.
Finding Leaks in an E-commerce Checkout
The classic use case for monitoring exit rates is, without a doubt, the e-commerce checkout process. Every step is a micro-commitment, and a high exit rate at any point before the final purchase points to a specific moment of friction.
Let's look at a couple of common scenarios:
High Exit Rate on the Shipping Page: This almost always points to unexpected shipping costs. A user who was perfectly happy to buy might hit the brakes when they see a $15 shipping fee they weren’t expecting.
High Exit Rate on the Payment Page: This could be anything from a technical glitch to a lack of preferred payment options like PayPal or Apple Pay. It might even be something as simple as a poorly designed form that makes users hesitant to enter their credit card info.
Analyzing exit rates page-by-page through a funnel transforms a vague problem like "low conversions" into a specific, actionable insight like "our shipping costs are scaring away 30% of potential buyers at the final step."
Context Is Crucial for Interpretation
An exit rate number is meaningless without context. Whether a high exit rate is good or bad depends entirely on the purpose of the page. It's the context that tells you whether it's a sign of success or a symptom of failure. For example, a high exit rate on a 'Create Account' page is a problem you need to solve immediately, as it shows a clear barrier preventing new users from signing up.
The key is to monitor both metrics where they make sense. While high bounce rates flag issues at the entry point, exit rates pinpoint the exact end of a user's journey. Industry reports show that content pages naturally see exit rates of 70-80%, but key funnel pages like product listings should ideally stay within the 20-40% range. You can discover more insights about these benchmarks on Pingdom.com.
This distinction is what helps you focus your optimization efforts where they'll actually move the needle on your conversion goals.
Interpreting High Rates by Page Type
To help you get started, here’s a quick guide to what high bounce and exit rates might be telling you on different kinds of pages.
Page Type
High Bounce Rate Potential Cause
High Exit Rate Potential Cause
Homepage
Unclear value proposition, confusing navigation, or poor design.
Users found what they needed (e.g., contact info) or couldn't find a clear next step.
Blog Post
Misleading title, slow load time, or irrelevant content for the audience.
User finished reading and had no compelling CTA to continue their journey.
Product Page
Poor product images, missing information (e.g., specs), or high price.
Price is too high, shipping info is unclear, or the "Add to Cart" button isn't prominent.
Checkout: Shipping
User is just price shopping and not ready to buy.
Unexpectedly high shipping costs or limited delivery options.
Checkout: Payment
User is not yet committed to buying.
Lack of trusted payment options, technical errors, or security concerns.
Contact Us Page
User arrived by mistake or the page is hard to find from the start.
User successfully found the information they needed (phone, address) and left.
Confirmation Page
N/A (Users don't typically land here first).
The journey is complete. A high exit rate here is expected and normal.
This table isn't exhaustive, but it should give you a solid framework for starting your own analysis. Remember, these metrics are just the beginning of your investigation, not the final answer.
Common Tracking Errors That Ruin Your Data
What if the problem isn’t your website's performance but a hidden flaw in your data collection? When we talk about exit rate vs bounce rate, bad data will send you down the wrong path, making you “fix” problems that don’t actually exist. Seemingly small mistakes in your technical setup can dramatically inflate or deflate these key metrics, poisoning the very insights you rely on.
These tracking errors often hum along silently in the background. It's incredibly difficult to know your numbers are wrong until you’ve already made bad decisions based on them. Getting to know these common culprits is the first step toward trusting your analytics again.
Duplicate Analytics Tags
One of the most frequent—and easily missed—errors is having duplicate analytics tracking codes installed on your website. This usually happens during a site migration, a theme update, or when multiple plugins or marketing tools each decide to install their own version of the same tag.
Here's the breakdown: when a page has two identical tracking tags, the script fires twice for a single pageview. Your analytics platform sees this as two separate pageviews happening in the same session. As a result, a user who lands on a page and leaves immediately—a classic bounce—gets recorded as having viewed two pages. This artificially tanks your bounce rate straight to 0%.
Misconfigured Event Tracking
Event tracking is an incredibly powerful tool, but it's also a common source of data pollution when it’s not configured correctly. In Universal Analytics, any event could be set as an "interaction event." If an event like "scrolled 25%" was set to be an interaction and fired automatically on page load, it immediately prevented a single-page session from ever being counted as a bounce.
This gives you a misleadingly low bounce rate because the system thinks users are engaging, even if they leave right after the event fires. The same logic applies in GA4, where any event can warp engagement metrics if it’s not implemented with a clear, intentional strategy.
Key Takeaway: An artificially low bounce rate can be more dangerous than a high one. It masks real problems with your landing pages, stopping you from identifying and fixing critical user experience issues that are costing you conversions.
Cross-Domain and Subdomain Tracking Issues
Another all-too-common headache pops up when a user's journey takes them across different domains or subdomains you own. Think moving from yourblog.com to shop.yourblog.com. If cross-domain tracking isn't set up perfectly, your analytics tool will simply end the first session on the original domain and kick off a brand new one on the second.
This mistake messes things up in two ways:
It incorrectly inflates the exit rate on the page that links out to the subdomain.
It completely shatters the user journey, making it impossible to see the full conversion path.
Getting user behavior tracking right is a complex job. It’s critical to proactively detect silent tracking errorsbefore they lead you to make flawed strategic decisions. Once your data is clean, the true story behind your exit and bounce rates becomes much clearer.
Automating Analytics QA to Ensure Accurate Metrics
Relying on manual checks to spot tracking errors is a slow, reactive process that’s just begging for human error. When you're trying to dig into the nuances between your exit rate vs. bounce rate, bad data can send you on a wild goose chase, "fixing" problems that don't even exist. This is where a modern approach to data integrity isn't just nice to have—it's essential.
Automated analytics quality assurance (QA) platforms work by keeping a constant, end-to-end watch over your entire tracking implementation. Instead of waiting for a quarterly audit to catch a broken pixel, these systems give you a heads-up the moment something goes wrong.
Think about getting an instant ping the moment a new deployment adds a duplicate tag, which artificially drops your bounce rate to 0%. Or what if a schema change in your data layer starts corrupting your conversion funnel, making your exit rate data completely useless? That's the kind of thing automation catches immediately.
Moving from Reactive to Proactive Monitoring
Without automation, most teams are stuck in a painful "find-and-fix" loop. They often discover data issues weeks or months after the damage is done, long after key decisions have been made based on faulty numbers. An observability platform completely flips this script, moving you into a proactive workflow.
Automated monitoring creates a single source of truth, giving marketers, analysts, and developers the confidence they need to act on the data they see. Here’s how it generally works:
Continuous Discovery: It automatically maps out your entire Martech stack, from the data layer all the way to every destination, to build a picture of what should be tracked.
Real-Time Monitoring: The platform watches live user traffic, spotting anomalies, missing events, broken pixels, and schema mismatches as they happen.
Instant Alerts: When an issue pops up, it sends an immediate alert through Slack, email, or other channels with enough context to find the root cause fast.
By automating the tedious work of data validation, teams can finally shift their focus from firefighting tracking bugs to actually extracting valuable insights. It ensures every decision—from tweaking a landing page's bounce rate to plugging a funnel leak you found with exit rates—is built on data you can actually trust.
Ensuring Reliable Data for Key Business Decisions
This level of monitoring is critical for any organization that uses data to drive growth. A broken event, for example, might hide the real reason users are abandoning your checkout process, rendering your exit rate analysis useless. In the same way, a misconfigured campaign tag could make it impossible to know which marketing channels are truly performing.
Automated QA helps you build robust data governance and a reliable analytics foundation. If you're interested in going deeper on this, check out our article on data quality and automated data validation in GA4. Ultimately, this process ensures the metrics you lean on are always accurate, complete, and trustworthy.
Unpacking Common Questions About Exit and Bounce Rates
Even with a solid grasp of the exit rate vs. bounce rate difference, a few questions always seem to pop up. Nailing these down will sharpen your analytics skills and make sure you’re reading your data the right way. Let's dig into some of the most frequent ones.
Is a High Bounce Rate Always a Bad Thing?
Not at all. Context is everything.
Think about a blog post that perfectly answers a very specific question. A user lands, gets the answer, and leaves. That's a bounce, but it's also a success story. The same goes for a "Contact Us" page—if someone finds the phone number and leaves to call you, the bounce is a good thing.
On the other hand, a high bounce rate on a product landing page, a services page, or the first step of a sign-up form is a huge red flag. It usually signals a disconnect between your ad copy and your on-page content, or just a plain bad user experience.
In short, a bounce on an informational page might be fine, but on a transactional page, it's a problem. Always judge bounce rate against the page's specific goal.
Can a Page Have a Higher Exit Rate Than Bounce Rate?
Absolutely, and it happens all the time. You just have to remember the fundamental difference: every bounce is an exit, but not every exit is a bounce. A page can have a tiny bounce rate because most people who land there first continue browsing your site.
But that very same page could have a massive exit rate because it’s the last stop for many user journeys that started somewhere else. For example, a "Shipping Policy" page is a common final stop before a user leaves, even though very few sessions actually start on that page.
How Does Google Analytics 4 Handle These Metrics?
Google Analytics 4 (GA4) flips the script entirely. It moves away from penalizing bounces and toward rewarding actual user engagement. Instead of the classic bounce rate, GA4 introduces "engagement rate," which tracks meaningful interactions like session duration, conversions, or multiple pageviews.
In the GA4 world, the bounce rate is just the inverse of the engagement rate. This shift nudges analysts to focus on what users are doing, not what they aren't, giving you a much more useful and positive way to look at user behavior.
Trustworthy analysis is built on a foundation of data integrity. Trackingplan provides a fully automated observability and QA platform that constantly monitors your analytics to catch tracking errors in real time. Make sure your decisions are based on accurate data—see how it works.
David Pombar
Read more from David, a Senior Product Strategist with 18+ years in digital product development and an atypical error detection knack.
By clicking “Accept All Cookies”, you agree to the storing of cookies on your device to enhance site navigation, analyze site usage, and assist in our marketing efforts. View our Privacy Policy for more information.