Practical guide to anomaly detection in bigquery: prep data, build BQML models, tune results, and automate alerts with SQL examples.
When you're swimming in data, anomaly detection isn't just a fancy data science term—it's your first line of defense. Using BigQuery for this is a game-changer. It’s all about leveraging its built-in machine learning (BQML) and powerful SQL functions to spot patterns that just don't look right.
This lets you move beyond staring at static dashboards and start proactively finding issues. Think sudden drops in user conversions or a marketing pixel that silently broke three days ago. BigQuery turns what used to be a complex, resource-heavy task into something analysts and even savvy marketers can manage directly inside their data warehouse.
Why BigQuery Is Your Secret Weapon for Anomaly Detection

Let's get practical. Anomaly detection is fundamentally about protecting revenue and keeping your data trustworthy. Your standard reports are great for tracking metrics you already know are important, but they have a massive blind spot: the silent, unexpected problems that slowly bleed your bottom line.
A broken script might tank mobile conversions, or a misconfigured marketing pixel could be feeding you garbage campaign data for days before anyone catches it. By the time these issues show up in a weekly review, the damage is done. This is where BigQuery completely changes the game.
Unifying Data and Machine Learning
In the past, setting up an anomaly detection system was a serious ordeal. You'd have to export huge datasets from your warehouse, spin up a separate environment to process everything, train a model, and then figure out how to put it all into production. It was a headache.
BigQuery brings machine learning right into its SQL environment, which simplifies everything. You never have to move your data. This native integration gives you a few massive advantages:
- Speed and Efficiency: You can train and run models on petabyte-scale datasets without ever leaving the BigQuery UI.
- Accessibility: Analysts can build and deploy ML models using the SQL they already know. No Python or specialized tools required.
- Scalability: Because it's serverless, BigQuery handles all the infrastructure headaches. Your system just scales as your data grows.
The real power here is turning your data warehouse into a proactive defense mechanism. You stop asking, "What happened last week?" and start getting alerts that answer, "What's breaking right now?"
The Business Impact of Proactive Detection
Catching these issues early has a real, measurable impact. I've seen it firsthand. One e-commerce company I worked with used BigQuery to flag a sudden 30% drop in mobile conversions that their regular dashboards had completely missed.
The system flagged the anomaly, which led them straight to a critical JavaScript error messing with Android checkouts. Finding it that quickly saved them an estimated $50,000 in what would have been lost revenue.
This kind of proactive monitoring is just fundamental to building data systems you can actually rely on. If you want to dive deeper into the core principles, our guide on how you can ensure data integrity is a great place to start.
Getting Your Data Ready for Analysis in BigQuery
Your anomaly detection model is only as good as the data you feed it. Let’s be real: raw event logs and transaction tables are almost never in the right shape for machine learning. So, before you even think about training a model, the first order of business is to clean, structure, and transform your data into a pristine, analysis-ready format.
This prep work is easily the most critical part of the whole process. If you skimp on it, you're essentially trying to build a house on a shaky foundation—everything that comes after will be unreliable. The good news is that BigQuery's SQL muscle is more than up to the task, letting you handle the entire workflow without ever having to move your data.
From Raw Events to Clean Time-Series Data
Most anomaly detection, especially when you're looking at business metrics like sales, sign-ups, or website traffic, leans heavily on time-series data. All this means is you need a dataset with two key ingredients: a regular timestamp and a numeric value you want to monitor. Your first job is to wrestle those messy, raw event logs into this clean, aggregated structure.
Imagine you have a table flooded with raw user sign-up events. The goal is to distill it down to a simple daily count of new users. A straightforward SQL query is all you need.
WITH daily_signups AS (
SELECT
DATE(event_timestamp) AS signup_date,
COUNT(DISTINCT user_id) AS total_signups
FROM
your-project.your_dataset.raw_events
WHERE
event_name = 'user_signup'
GROUP BY
1
)
SELECT
signup_date,
total_signups
FROM
daily_signups
ORDER BY
signup_date;
This simple aggregation is the bedrock for creating a time-series dataset ready for anomaly detection in BigQuery. It effectively pivots your data from tracking individual events to summarizing daily trends.
Handling Missing Values and Gaps
Real-world data is messy. You’ll have days where nobody signs up, leaving gaps in your time series. BQML models, especially time-series specialists like ARIMA_PLUS, really need a complete, unbroken sequence of data points to do their job correctly.
You can patch these holes by generating a complete date range and joining your aggregated data to it.
One of the most common pitfalls in time-series analysis is failing to account for missing data points. A model can't learn patterns from data that isn't there, so explicitly filling gaps with zeros or another imputed value is essential for accurate forecasting and anomaly detection.
Here’s a quick rundown of how to generate that continuous date series and fill any missing days with a zero count:
- Generate a Date Series: Use
GENERATE_DATE_ARRAYto create a full list of dates covering your entire event history, from the first timestamp to the last. - Left Join Your Data: Run a
LEFT JOINfrom your complete date series over to your aggregated daily counts. - Fill Nulls: Use
COALESCEorIFNULLto swap out anyNULLvalues—which represent days with no sign-ups—with a0.
This approach ensures your dataset is dense and consistent, which is a non-negotiable requirement for most time-series models. For a deeper dive into why clean data is so important, check out our complete guide on data quality monitoring.
Normalizing and Standardizing Features
What if your anomaly detection involves multiple features at once, like monitoring user sign-ups, session duration, and transactions? The scales of these metrics can be wildly different. Sign-ups might be in the hundreds, while session duration is in seconds. This kind of disparity can seriously bias your model, causing it to over-index on features with larger numbers.
To sidestep this, you should standardize your features using a technique like Z-score normalization. This process rescales every metric to have a mean of 0 and a standard deviation of 1.
You can pull this off directly in BigQuery using window functions:
AVG(metric) OVER(): Calculates the average of your metric across the whole dataset.STDDEV(metric) OVER(): Calculates the standard deviation.
By applying these transformations, you make sure every feature contributes equally to the anomaly detection process. The result? More reliable and balanced insights.
Choosing Your BigQuery ML Anomaly Detection Model
Once your data is clean and structured, you're ready for the exciting part: choosing the right tool for the job. BigQuery ML isn't a one-size-fits-all platform; it offers a specialized toolkit for unsupervised anomaly detection. Your choice of model will fundamentally depend on the nature of your data and the specific kinds of outliers you're trying to catch.
Picking the right model is a critical step that directly influences the quality of your results. This decision is at the heart of modern data practices, much like the broader applications of machine learning in financial services where the right algorithm can make all the difference in risk management.
This visual guide can help you decide which path to take based on your data's characteristics.
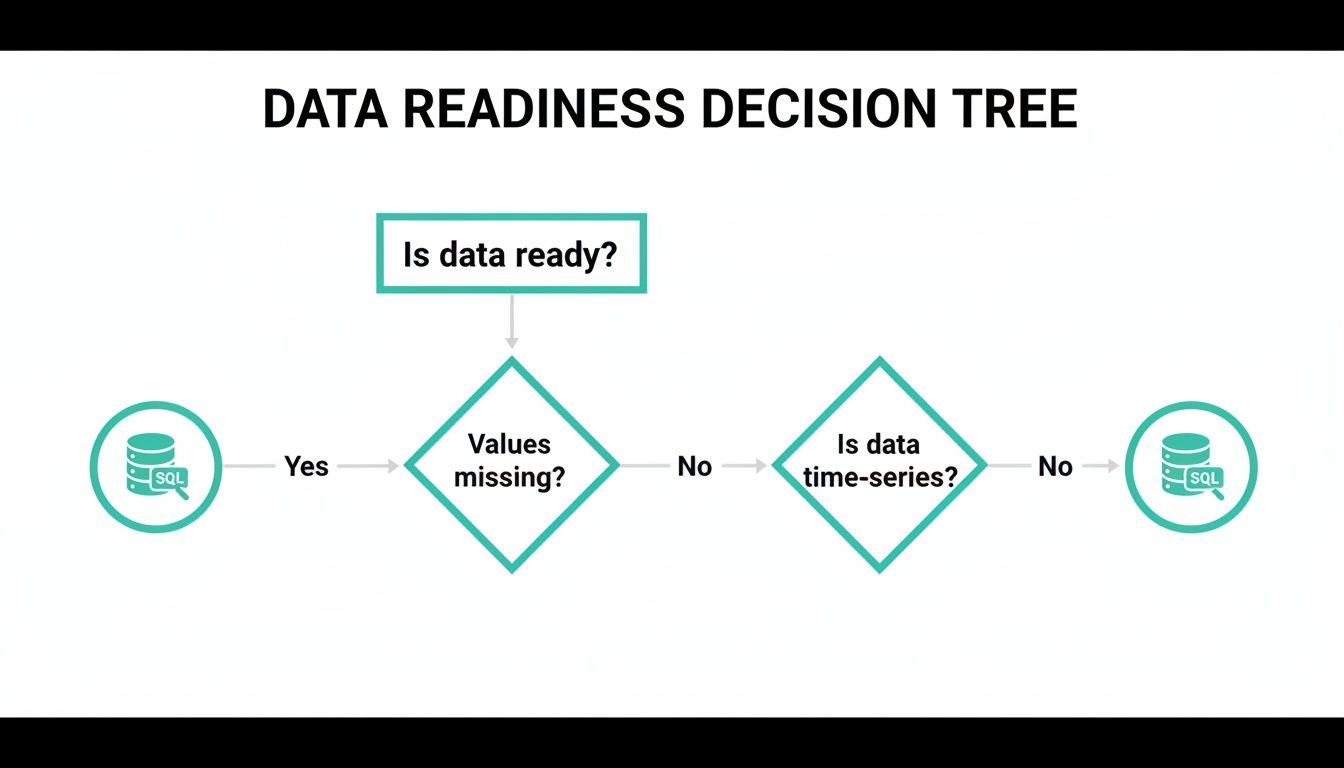
This decision tree helps you ask the right first questions. Is your data clean and complete? Is it a time-series dataset? The answers will point you toward the most suitable modeling approach right away.
K-Means for Cluster-Based Outliers
Think of the K-Means model as a way to group your data into natural clusters based on similarity. For example, you might have clusters of "high-engagement users," "casual browsers," and "new visitors." The model finds anomalies by measuring how far each data point is from the center of its assigned cluster.
If a particular user's behavior is wildly different from all known groups, it gets flagged as an anomaly. This makes K-Means an excellent choice for identifying outliers in multi-featured datasets that don't have a time component, like spotting fraudulent transactions or unusual customer profiles.
- Best For: Datasets with multiple numeric features where anomalies are defined by their dissimilarity to any known group.
- How It Works: It calculates the distance of each point to its nearest cluster centroid. Points that are exceptionally far away are flagged.
- Key Parameter: You define the number of clusters (
num_clusters) you expect to find in your data.
ARIMA_PLUS for Time-Series Anomalies
When your data is sequential—think daily sales figures or hourly website traffic—you need a model that understands time. The ARIMA_PLUS model is BigQuery ML’s powerhouse for both forecasting and anomaly detection in time-series data. It learns the underlying patterns, including trends and seasonality.
The model builds a forecast of what it expects the next data point to be, complete with a confidence interval. An anomaly is flagged whenever an actual data point falls outside this expected range. If your website traffic suddenly plummets on a Tuesday afternoon when it's normally high, ARIMA_PLUS will catch it.
ARIMA_PLUS excels because it doesn't just look at a single data point in isolation. It evaluates it in the context of what came before and what it expects to come next, making it incredibly effective at spotting deviations from established temporal patterns.
Autoencoders for Complex Pattern Deviations
Autoencoders are a more advanced technique, ideal for high-dimensional and complex data where anomalies are subtle. An autoencoder is a type of neural network trained to compress your data into a smaller representation and then reconstruct it back to its original form.
The model learns what "normal" data looks like during this process. When it encounters an anomalous data point, it struggles to reconstruct it accurately, resulting in a high reconstruction error. This error score becomes the indicator of an anomaly. It's perfect for use cases like detecting network intrusions or identifying defective products from sensor readings.
To help you decide, here's a quick comparison of the three primary unsupervised models in BigQuery ML. This table should make it easier to choose the right one for your specific data and use case.
BigQuery ML Anomaly Detection Model Comparison
Ultimately, a model you choose will depend on whether you're dealing with clusters of behavior, a time-based sequence, or complex, multi-dimensional patterns.
Understanding the Contamination Parameter
For K-Means and Autoencoder models, you'll encounter a critical parameter called contamination. This is a value between 0 and 0.5 that tells the model what proportion of your dataset you expect to be anomalous.
For example, setting contamination = 0.05 tells the model to flag the top 5% of the most unusual data points as anomalies. Choosing the right value is a balancing act. A higher value increases sensitivity but can lead to more false positives, while a lower value will only catch the most extreme outliers. It's a business decision that should align with your team's tolerance for risk and alert volume.
With your data prepped and ready, it’s time to shift from preparation to prediction. This is the exciting part where we turn that clean, structured time-series data into a smart model that can keep an eye on your key metrics for you. Thanks to BigQuery ML's SQL-based syntax, this is a lot more straightforward than you might think.
You won't need to spin up a complex Python environment. Instead, a single SQL statement is all it takes to create, train, and deploy a pretty sophisticated time-series model. Let's walk through a classic, real-world scenario: monitoring daily user sign-ups to catch any unusual spikes or drops.

Crafting the CREATE MODEL Statement
The heart of BigQuery ML is the CREATE OR REPLACE MODEL statement. This command is your instruction to BigQuery to get to work training a new ML model using the data you point it to and the settings you specify. For our daily sign-up example, we’ll use the ARIMA_PLUS model, which is tailor-made for time-series forecasting and anomaly detection.
Below is a complete, fully commented SQL query you can adapt. This one block of code gives BigQuery everything it needs to build your first model for anomaly detection in BigQuery.
CREATE OR REPLACE MODEL your-project.your_dataset.daily_signup_anomaly_detector
OPTIONS(
-- Specify the model type. ARIMA_PLUS is ideal for time-series data.
model_type='ARIMA_PLUS',
-- Tell the model which column contains the timestamp.
time_series_timestamp_col='signup_date',
-- Specify the numeric column we want to monitor for anomalies.
time_series_data_col='total_signups',
-- This is a key parameter for anomaly detection. It sets the sensitivity.
-- A value of 0.95 flags points that fall outside the 95% confidence interval.
anomaly_prob_threshold=0.95,
-- Optional: Helps the model handle holidays or special events.
holiday_region='US'
) AS
SELECT
signup_date,
total_signups
FROM
your-project.your_dataset.clean_daily_signups
WHERE
signup_date <= '2023-12-31'; -- Train on historical data only
This tells our model to learn from all the sign-up data up to the end of 2023, effectively teaching it what "normal" looks like.
Breaking Down the Key Model Options
The real magic happens inside the OPTIONS clause. This is where you fine-tune the model’s behavior. While there are plenty of parameters to play with, a few are absolutely critical for time-series anomaly detection.
model_type: This defines the algorithm. We're using'ARIMA_PLUS', which is great because it automatically figures out trends and seasonality.time_series_timestamp_col: You have to tell the model where your timestamps are. In our case, it's thesignup_datecolumn.time_series_data_col: This points to the metric you want to watch. For us, that'stotal_signups.anomaly_prob_threshold: Think of this as the sensitivity dial. A value of 0.95 tells the model to flag anything that falls outside its 95% confidence interval.
Think of the
anomaly_prob_thresholdas setting the boundaries of normalcy. A higher value (like 0.99) creates a wider, more tolerant boundary, flagging only the most extreme deviations. A lower value (like 0.90) creates a tighter boundary, making the model more sensitive to smaller changes.
Finding the right threshold is a bit of an art. Starting with 0.95 is a solid bet. You can always adjust it later if you're getting too many false alarms or, worse, missing subtle problems.
Putting Your Model to Work with ML.DETECT_ANOMALIES
Once trained, your model is ready for action. You don’t need to retrain it every day. Instead, you just apply the model to new data as it comes in using the ML.DETECT_ANOMALIES function.
This function takes your trained model, feeds it a new batch of observations, and spits out a table with the original data plus several new columns that tell you if each point is an anomaly.
Here’s how you'd run it against January 2024 data using the model we just built:
SELECT
*
FROM
ML.DETECT_ANOMALIES(
MODEL your-project.your_dataset.daily_signup_anomaly_detector,
(
SELECT
signup_date,
total_signups
FROM
your-project.your_dataset.clean_daily_signups
WHERE
signup_date >= '2024-01-01' -- Analyze new data
)
);
The output from this query is incredibly useful. It includes your original signup_date and total_signups, along with some very handy new columns:
is_anomaly: A simpleTRUE/FALSEflag that makes outliers easy to spot.anomaly_probability: The model's confidence score that a point is an anomaly.lower_boundandupper_bound: The expected range for your metric. Anything outside this band gets flagged.
This simple, repeatable query is the bedrock of your automated monitoring system. By pairing CREATE MODEL for the initial training with ML.DETECT_ANOMALIES for ongoing checks, you've built a powerful and scalable framework for anomaly detection right inside BigQuery.
Fine-Tuning Your Model for Actionable Results
Training a model in BigQuery is a great first step, but the real work starts after the initial run. An out-of-the-box model often acts like an overzealous security guard, flagging every tiny hiccup and burying your team in noisy alerts. The real value comes from fine-tuning—transforming a technically functional model into a trusted system that delivers meaningful, actionable insights.
This is where you close the gap between raw output and real-world utility. The biggest challenge is striking the right balance. You need a system that’s sensitive enough to catch real problems but doesn't drown your team in false positives. This is a classic case of alert fatigue. If your team gets 50 alerts a day and 49 are meaningless, they’ll eventually start ignoring all of them, including the one that actually matters.
Your main lever for controlling this balance is the anomaly_prob_threshold parameter. Adjusting this value is the most direct way to calibrate your model's sensitivity.
Calibrating the Anomaly Probability Threshold
Think of the anomaly_prob_threshold as your model’s sensitivity dial. When you set it to 0.95, you're telling BigQuery to flag any data point that falls outside the 95% confidence interval. This is a solid starting point, but it's rarely perfect for every business context.
Here’s a practical way to think about adjusting it:
- Getting too many false positives? If you're getting alerted for minor, acceptable fluctuations, your threshold is too low. Try increasing it to
0.98or0.99. This widens the "normal" range and tells the model to only flag more significant deviations. - Worried you're missing subtle issues? If your model seems to be overlooking smaller but potentially important anomalies, your threshold might be too high. Consider lowering it to
0.90to tighten the confidence bands and increase its sensitivity.
The key is to experiment. Run your model with different thresholds against historical data and watch how the results change. This iterative process is how you find the sweet spot that aligns with your operational needs.
Interpreting and Visualizing Your Results
Once you have a list of anomalies, the next step is to actually understand them. The output from ML.DETECT_ANOMALIES gives you everything you need: the actual value, the expected range (lower_bound and upper_bound), and the is_anomaly flag. But don't just stare at a table of flags—visualize the data.
Plotting your time series with the predicted upper and lower bounds creates a powerful visual that makes anomalies jump right off the screen. This context is crucial. Seeing an anomalous point in relation to its expected range helps you quickly judge its severity and decide if it warrants immediate action. This is the feedback loop that drives continuous improvement.
The goal isn't just to find anomalies; it's to understand why they're anomalies. Visualizing the output turns abstract flags into a clear story about your data's behavior, making it easier to separate critical signals from everyday noise.
The impact of careful tuning can be huge. In some controlled tests, simply adjusting the detection threshold from 0.95 up to 0.99999 helped reduce false positives by a staggering 95% while still successfully identifying 100% of intentionally introduced anomalies. By experimenting with these settings, organizations can dramatically refine their results. You can learn more about how small tweaks lead to major gains in this guide on optimizing anomaly detection in BigQuery.
Ultimately, a well-tuned model builds trust. When your team knows an alert is highly likely to be a real issue, they respond faster and more decisively. That’s how you turn your anomaly detection system from a noisy distraction into an indispensable operational tool.
Automating Your Anomaly Detection and Alerting

A finely-tuned model is a great start, but its real power is unlocked when you set it on autopilot. The final piece of the puzzle for mastering anomaly detection in BigQuery is shifting from manual checks to a fully automated monitoring and alerting pipeline. This is where your SQL scripts become a vigilant system, watching your data 24/7.
The idea is to create a seamless loop: from detection to notification and, ultimately, to a faster root-cause analysis. This approach frees up your team from the grind of running queries, letting them focus on what actually matters—investigating and fixing the issues your system finds. Luckily, BigQuery gives us all the tools we need to build this entire workflow.
Scheduling Your Detection Queries
The bedrock of automation in BigQuery is the scheduled query. This feature is your ticket to running any SQL script, including your ML.DETECT_ANOMALIES query, on a recurring schedule without any manual clicks. You can set it to run daily, hourly, or any custom interval that makes sense for your business.
Getting one up and running is pretty straightforward. You just save your detection query, set up a schedule, and tell BigQuery which table to dump the results into. Each time the query runs, it adds the latest checks to that table, creating a running history of your data’s health.
This simple step is the most critical one for getting your model into production. By scheduling the query, you guarantee that monitoring is always on.
Integrating Alerts with Your Team's Workflow
Spotting an anomaly is only half the job. The right people need to know about it, and they need to know now. Pushing alerts directly into the tools your team lives in every day, like Slack or Microsoft Teams, is key to getting a fast response. This is how you bridge the gap between BigQuery and the real world.
A common and highly effective way to do this involves using Google Cloud Functions that fire whenever a new entry pops up in your anomaly results table.
- Trigger Mechanism: You can set up a Cloud Function to kick off every time a new row is written to your anomaly output table.
- Alert Logic: Inside the function, your code simply checks if the
is_anomalyflag isTRUE. - Webhook Notification: If it finds an anomaly, the function can format a quick, clear message and fire it off to a specific Slack or Teams channel using an incoming webhook URL.
This creates a slick, real-time alerting system. For example, an alert could be as simple as: "Anomaly Detected: Daily sign-ups dropped to 150, well below the expected lower bound of 450."
An effective alert gives you three things at a glance: the metric that's off, its actual value, and what the expected range was. This immediate context helps the team gauge the severity without having to log into another platform to figure out what's going on.
From Alert to Actionable Insight
Going beyond just building and tuning models, the real magic happens when you set up this kind of continuous monitoring. Knowing how to automate analytics and data science workflows is what turns your raw data into timely, decisive actions.
The last piece is making sure your alerts connect back to a more detailed view for deeper investigation. For a truly robust system, think about adding these enhancements:
- Link to a Dashboard: Pop a link in your alert message that takes the team straight to a Looker Studio dashboard, pre-filtered to the exact time of the anomaly.
- Enrich with Metadata: Your Cloud Function could pull in related data—like recent code deployments or marketing campaign launches—to add some much-needed context to the alert.
- Tiered Alerting: Not all anomalies are created equal. You can build logic to send minor blips to one channel and critical, high-impact alerts to another to avoid overwhelming your team.
By connecting scheduled queries with webhooks, you transform your BigQuery ML model from a cool analysis tool into a fully operational, proactive monitoring system. This automation closes the loop from detection to resolution, helping you get ahead of data problems before they snowball.
For anyone looking to achieve this level of oversight, checking out tools that give you a complete picture of your data health, like our own Daily Digests for data observability, can be a fantastic next step.
Frequently Asked Questions
When you start moving from anomaly detection theory to a real-world implementation in BigQuery, a lot of questions pop up. Let's walk through some of the most common ones I hear from teams making this transition.
Can I Do Anomaly Detection in BigQuery Without Machine Learning?
Yes, you definitely can, and for many simpler cases, it's a great starting point. You can get surprisingly far with standard SQL.
The typical approach involves using window functions like AVG() OVER(...) to calculate a moving average and standard deviation over a set time window. From there, you just flag any data point that falls, say, more than three standard deviations away from that moving average. This statistical method is rock-solid for catching sudden, dramatic spikes or drops but will struggle with complex seasonality or subtle, long-term trends where BQML really shines.
How Does BigQuery ML Handle Seasonality in Time Series Data?
This is where BigQuery ML's ARIMA_PLUS model really flexes its muscles. It's built from the ground up to handle seasonality automatically. When you train it, the model intelligently scans your time-series data for recurring patterns, whether they cycle daily, weekly, or even monthly.
You don't have to manually break down the time series or get into complex feature engineering yourself—it's all handled for you. The model bakes these seasonal components right into its forecast. This means it flags anomalies based on deviations from the expected seasonal pattern, making it incredibly accurate for business data with strong cyclical trends.
The real magic of
ARIMA_PLUSis its ability to tell the difference between a legitimate seasonal spike (like a Black Friday sales surge) and a true anomaly. It understands context, something simpler statistical methods just can't do.
What Are the Main Costs Involved?
When you're running anomaly detection in BigQuery, your costs generally fall into three buckets. Getting a handle on these helps you manage your budget without any surprises.
- Data Storage: This is just the cost of keeping your raw and processed data in BigQuery. It’s usually the most predictable and often the smallest piece of the puzzle.
- Query Processing: This covers running all your SQL queries—for data prep, model evaluation, and actually executing the
ML.DETECT_ANOMALIESfunction. Costs here are based on how much data you process. - BigQuery ML Model Costs: BQML has its own pricing based on the model type and the data processed during training and prediction. Keep in mind that
ARIMA_PLUSoften trains multiple candidate models under the hood to find the best fit, so the training cost reflects that thoroughness.
A pro tip is to use partitioned tables to limit the amount of data scanned in each detection run. It's also smart to keep a close eye on your BQML expenses as you scale.
How Can I Send Anomaly Alerts to My Team on Slack?
Setting up a Slack alert pipeline is a common and highly effective workflow. The best way to do it is by combining a scheduled query with a Google Cloud Function.
First, you'll set up a scheduled query in BigQuery to run your ML.DETECT_ANOMALIES script on a regular interval, maybe hourly or daily.
Then, you create a simple Cloud Function that triggers right after the scheduled query finishes. This function just needs to check the results table, format a clean alert message if any new anomalies were found, and then post it to a specific Slack channel using an Incoming Webhook. Just like that, you’ve got a fully automated, real-time alerting pipeline.
While BigQuery gives you a powerful toolkit for detecting anomalies, none of it matters if the underlying analytics data is flawed. The first and most critical step is ensuring data quality at the source. Trackingplan provides a fully automated observability platform that constantly watches your entire analytics implementation—from the dataLayer to marketing pixels. It catches issues like missing events, schema errors, and broken tracking in real time, often before they ever have a chance to become anomalies.