Learn what is digital marketing analytics and how to turn data into measurable growth with essential metrics, tools, and actionable insights.
Digital marketing analytics is all about turning a flood of raw data—clicks, impressions, conversions—into a clear story about your marketing performance. It's the process of collecting, measuring, and analyzing all that data to figure out precisely what’s working, what’s falling flat, and where your budget will get the best bang for its buck.
What Is Digital Marketing Analytics Really About?

Think of it like a doctor's diagnostic toolkit. You wouldn't just guess what's wrong with a patient; you'd run tests, look at the results, and make an informed diagnosis. Analytics does the same for your marketing. Without it, you’re flying blind, relying on gut feelings. With it, you get a clear, data-backed picture of what’s happening beneath the surface.
This isn't just about staring at dashboards. It's about asking the right questions. Why did one campaign crush its goals while another flopped? Which channels are actually bringing in your most valuable customers? Where are people dropping off in the buying journey? Answering these questions is how you transform a confusing mess of metrics into a strategic roadmap for growth.
The Four Pillars of Digital Marketing Analytics
To really get a handle on digital marketing analytics, it helps to break it down into four core components. Think of these as the pillars holding up your entire data strategy, each with its own specific job.
Each pillar builds on the last, creating a cycle that moves you from raw data to real business results. It all starts with collecting the right information and ends with making smarter decisions.
Why It Matters Now More Than Ever
Relying on data isn't just a trend; it's a fundamental shift in how successful businesses operate. The digital marketing analytics market has seen explosive growth, valued at USD 6,979.7 million and projected to skyrocket to USD 37,470.04 million by 2034.
This surge isn't just a number—it shows how heavily companies worldwide are leaning on data to get an edge, especially in B2C, where everything is moving online. You can dig into the specifics in this detailed market growth report.
Digital marketing analytics provides a clear lens through which to view your business. It doesn't just show you what happened; it provides the clues to understand why it happened and what to do next.
Ultimately, getting good at analytics is about gaining control over your marketing destiny. It’s the difference between crossing your fingers and hoping for results versus systematically engineering them.
Getting to Grips with Your Analytics Framework
To really understand digital marketing analytics, you have to see it as a structured framework, not just a random collection of numbers. Think about building a house. You don’t just start piling up bricks and hope for the best. You need a blueprint, a solid foundation, and quality materials. Your analytics framework works the same way, with different parts that lock together to give you a reliable structure for making decisions.
This framework starts with the raw materials—your data. It then organizes that data into meaningful metrics, connects actions to outcomes through attribution, and finally, pulls it all together in a clear report. Let’s break down each of these essential building blocks.
The Journey of Data: From Source to Dashboard
Every piece of marketing data starts its life at a data source. These are the digital touchpoints where your audience interacts with your brand. They’re the origin points for every single insight you'll eventually uncover.
Common data sources include:
- Website and Mobile Apps: This is your home turf for tracking user behavior—page views, clicks, session duration, and in-app actions. Platforms like Google Analytics are masters at capturing this rich behavioral data.
- CRM Systems: Your Customer Relationship Management (CRM) tool, like HubSpot or Salesforce, is a goldmine of information on leads, customers, and their purchase history.
- Ad Platforms: Sources like Google Ads and Meta Ads give you the hard numbers on your campaign performance, including impressions, clicks, cost-per-click (CPC), and return on ad spend (ROAS).
- Social Media Platforms: These platforms tell you how your content is landing with your audience through engagement metrics like likes, shares, comments, and follower growth.
Data from these different sources is collected and piped into analytics tools. There, it gets processed and prepped for the next stage of its journey: analysis. This flow is the lifeblood of your entire marketing analytics operation.
Key Metrics: Acquisition, Engagement, and Retention
Once you have the data, you need to know what to measure. Metrics are the specific, quantifiable data points that tell you how your marketing is actually performing. But not all metrics are created equal. To get the full picture, it helps to group them by the stage of the customer journey they represent.
Here’s a breakdown of the essentials across the funnel:
- Acquisition Metrics: These tell you how good you are at attracting new people. Think Website Traffic, Click-Through Rate (CTR), and Customer Acquisition Cost (CAC). They answer the big question: "Are we reaching the right audience?"
- Engagement Metrics: Once people arrive, these metrics measure how they interact with your stuff. You’ll want to look at Bounce Rate, Average Session Duration, and Pages Per Session. They help you figure out if your content is genuinely interesting and easy to use.
- Retention Metrics: These metrics show how well you’re keeping customers coming back for more. The heavy hitters here are Customer Lifetime Value (CLV), Churn Rate, and Repeat Purchase Rate. They reveal the long-term health of your customer base and their loyalty to your brand.
The cost of getting this wrong is staggering. The digital marketing analytics market in North America has hit USD 1,807.28 million, with companies dedicating up to 38.5% of their marketing tech budgets to analytics. That massive spend highlights the pain businesses feel when data goes haywire from something as simple as a rogue event or a broken UTM, leading to costly bad decisions. You can explore more insights into the market dynamics of digital marketing analytics here.
Attribution and Reporting: The Story Behind the Numbers
Finally, we get to the most strategic parts of the framework: attribution and reporting. Attribution is simply how you give credit for conversions to the different marketing channels that played a part.
Think of your marketing channels as a soccer team. The striker who scores the goal gets the final glory (last-touch attribution). But what about the midfielder who made the perfect pass or the defender who started the whole play? Multi-touch attribution models make sure every player who helped score that goal gets the credit they deserve.
Reporting is the final step, where all this complex data is turned into a visual story. Tools like Tableau or Google Looker Studio create dashboards and reports that make trends and insights jump off the page. This is where you shift from just knowing "what happened" to understanding "what we should do next," turning raw data into something you can actually act on.
Building Your Modern Analytics Tech Stack
Moving from theory to practice means you need the right toolkit. Your digital marketing analytics tech stack is the collection of software that powers your entire data operation, from capturing a user’s first click to delivering the final report. Putting this stack together isn't about buying the most expensive tools; it’s about creating a seamless, interconnected system where every piece has a clear job.
Think of it like building a production line. First, you need a station to gather raw materials (data collection). Next, you need a station to process and shape them into a finished product (data analysis). Finally, you need a quality control station to inspect everything before it goes out the door (observability and QA). Skip that final check, and you risk shipping a faulty product.
The Foundation Layer: Data Collection Tools
This is ground zero for your analytics. Data collection tools are the nervous system of your stack, responsible for capturing every click, scroll, and purchase across your digital properties. They serve as the central hub for managing and deploying tracking codes, or "tags," without needing a developer for every tiny change.
The most common tool here is a Tag Management System (TMS) like Google Tag Manager. A TMS lets you:
- Deploy tracking pixels from platforms like Meta and Google Ads.
- Implement event tracking to monitor specific actions, like button clicks or video plays.
- Manage all your marketing tags from a single interface, which reduces website bloat and makes updates much easier.
As you build out this layer, it's also worth understanding how tools like transparent proxy servers for digital marketers can be critical for ad verification and media buying.
The Insight Layer: Data Analysis Platforms
Once the data is flowing, you need a place to make sense of it all. That’s the job of data analysis platforms, which turn raw data into structured reports and dashboards. These are the tools where you’ll spend most of your time spotting trends, segmenting audiences, and figuring out the "why" behind your performance.
Popular choices include:
- Google Analytics 4 (GA4): The industry standard for web and app analytics, GA4 focuses on event-based measurement to give you a complete picture of the user journey.
- Mixpanel or Amplitude: These are product analytics tools that really shine when it comes to understanding user behavior within complex applications.
To get a better sense of which tools fit best, check out our guide on the best analytics tools for mobile apps.
This visual shows the basic flow of a modern analytics framework, from raw data sources all the way to final reporting.
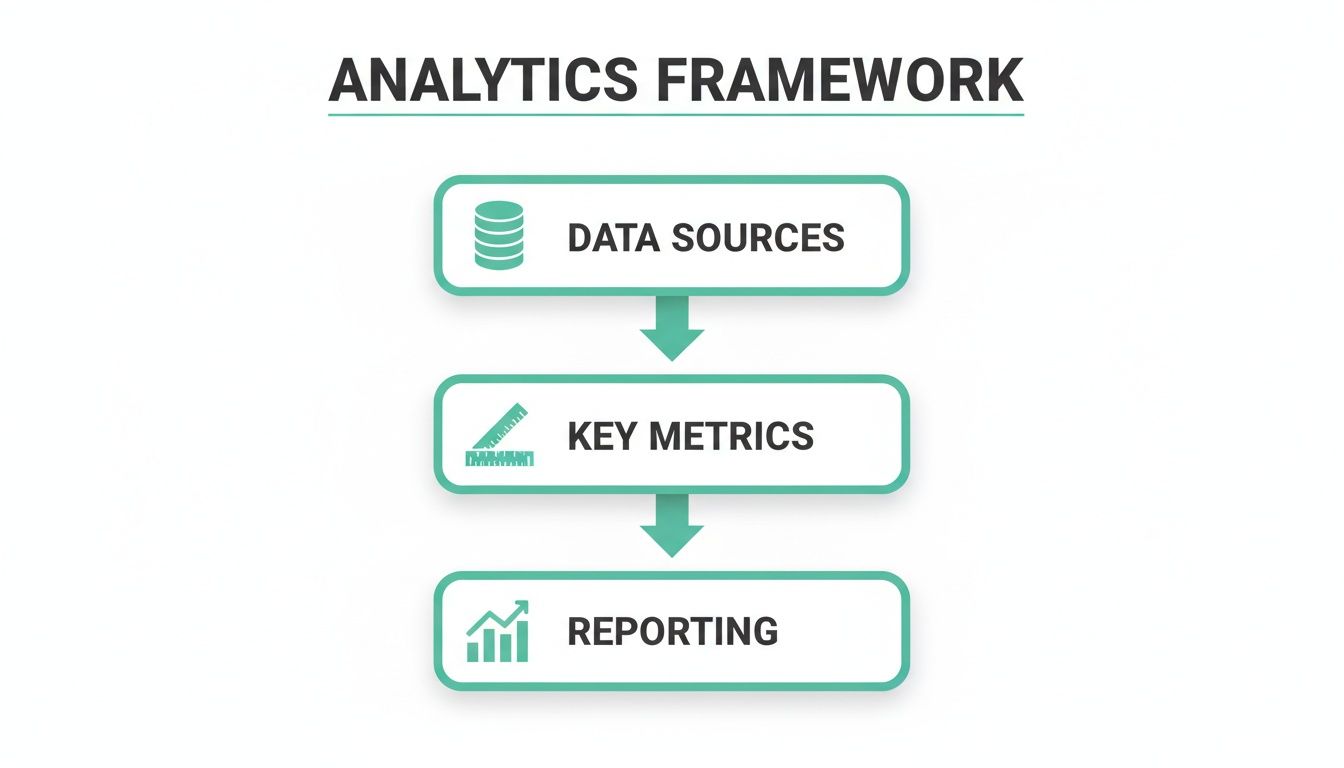
The key takeaway here is that your reports are only as good as the data you collect and the metrics you choose to define.
The Trust Layer: Analytics Observability and QA
This critical—and often overlooked—layer acts as the security guard for your entire data pipeline. Analytics observability platforms don't just show you data; they monitor the health of your data collection process itself. They’re always scanning for errors, inconsistencies, and broken tracking before bad data can poison your reports and lead to bad decisions.
An analytics observability platform like Trackingplan ensures the data flowing into your analysis tools is accurate and trustworthy. It’s the difference between assuming your numbers are correct and knowing they are.
This layer addresses a huge challenge in the industry. The field of marketing automation analytics is exploding, set for a CAGR of 13.5% through 2035. While large enterprises hold a 64% market share, analytics solutions still captured 38.5% of martech spend overall. Yet, data quality remains a persistent problem without proper observability.
Platforms like Trackingplan automate this QA process, giving you a single source of truth and protecting your most valuable asset: trusted data.
Why Your Marketing Data Is Often Wrong

You log into your analytics dashboard, ready to make a strategic call, but something just feels…off. The numbers don't quite line up with what you’re seeing on the ground. It’s that sinking feeling that you might be about to make a huge decision based on faulty information.
This is a much bigger problem than most marketers want to admit. The hard truth is that the data flowing into those beautiful dashboards is often broken. These aren’t just minor quirks; they're silent killers of marketing ROI. A seemingly small glitch can snowball into a disastrous business decision, like cutting the budget for your best-performing channel because an attribution error made it look like a dud.
Figuring out where these data quality issues come from is the first step toward building a strategy on trust, not guesswork.
The Silent Killers of Data Accuracy
Bad data doesn't just materialize out of thin air. It’s the direct result of specific, often hidden, technical breakdowns in your analytics implementation.
Think of your data pipeline like a plumbing system. A single crack or a clogged pipe somewhere along the line can contaminate the entire supply. The exact same thing happens with your marketing data.
Here are some of the usual suspects:
- Broken or Missing Tracking Pixels: A developer pushes an update to a landing page, or an agency launches a new campaign, and suddenly a tracking pixel is gone. Just like that, you have a blind spot where user actions go completely unrecorded.
- Inconsistent UTM Tagging: Sloppy or non-standardized UTMs are a classic data polluter. When one team member uses "Facebook" and another uses "facebook.com" as a source, your analytics platform sees them as two separate channels. Your data gets fractured, and accurate channel analysis becomes impossible.
- Rogue Events and Outdated Code: Old code from a previous analytics tool or a forgotten third-party script can keep firing "rogue" events that don't belong. This creates noise, inflates your metrics, and completely skews your understanding of real user behavior.
One of the best preventative measures is a thorough Website Quality Assurance Checklist. A structured process like this helps catch those sneaky technical glitches before they have a chance to poison your analytics.
How Small Glitches Cause Big Problems
It’s tempting to write these off as minor technical details, but their business impact is massive. A single data quality issue can trigger a chain reaction of poor decisions that directly hit your bottom line.
Picture this real-world scenario: an e-commerce company sees their "Add to Cart" event count has plummeted by 30%. The marketing team, trusting the data, concludes their new product campaign is a total failure and pulls the plug. They've just wasted thousands on creative and setup costs.
In reality, a website update had broken the tracking on the "Add to Cart" button. The campaign was actually driving huge interest, but the broken data told a completely different, and very expensive, story.
Bad data is worse than no data at all. No data forces you to rely on intuition, but bad data gives you the false confidence to make confidently wrong decisions.
The link between a small technical flaw and a major business consequence isn't always obvious. This table breaks down how common issues translate directly into flawed marketing strategy.
Common Data Quality Issues and Their Business Impact
At the end of the day, without a system to guarantee data accuracy, you're just operating on assumptions. The numbers in your reports might look convincing, but they could be pointing you in the completely wrong direction. The first step is admitting that your data is probably flawed and starting to hunt down the weak spots in your implementation.
Moving from Reactive Fixes to Proactive Governance
For way too long, marketing and data teams have been trapped in a frustrating cycle of putting out data fires. An important report is due, a key metric suddenly tanks, and everyone scrambles to find the broken pixel or the bad UTM tag. This reactive approach—finding and fixing problems after they’ve already poisoned your data—is slow, costly, and ultimately erodes trust in your entire analytics system.
The traditional method is a painful grind of manual audits, messy spreadsheets, and endless back-and-forth between marketing and development. It’s a process that burns hundreds of hours and leaves you constantly looking in the rearview mirror. But what if you could stop the fires from ever starting?
This is the core idea behind proactive analytics governance. Instead of waiting for something to break, you put a system in place that continuously monitors the health of your data collection, catching issues the moment they happen. It’s a fundamental shift from manual spot-checks to automated, always-on observability.
The Old Way vs. The New Way
The difference between reactive and proactive data quality is night and day. The old way is all about manual labor and delayed reactions; the new way is built on automation and real-time alerts.
- Reactive (The Old Way): Teams manually pore over tracking plans, build brittle QA tests that go stale almost immediately, and only realize there’s a problem when a dashboard looks off. The "fix" often comes days or even weeks after the bad data started flowing in.
- Proactive (The New Way): An automated system watches your live data implementation around the clock. It knows what your tracking should look like and instantly flags any deviation, letting you fix issues before they mess up a single report.
This proactive model isn’t about adding more work. It’s about using smart automation to kill the tedious, repetitive tasks that drain your team’s focus and resources.
How Automated Observability Works
Analytics observability platforms like Trackingplan are designed to automate this entire governance process. Think of them as a dedicated security detail for your data pipeline, making sure every piece of information flowing into your analytics tools is accurate and trustworthy.
The process is simple but incredibly powerful:
- Automated Discovery: The platform automatically scans your website, apps, and server-side setup to discover and map out your entire analytics implementation. It identifies every event, property, and pixel you’re currently tracking—no manual documentation needed.
- Real-Time Monitoring: Once it has a baseline, it monitors every single event in real time. It watches for traffic anomalies, missing or unexpected events, and errors in campaign tagging or UTM conventions.
- Instant Alerts: The moment an issue is detected—like a broken pixel after a new code deployment or a schema mismatch—it fires off an instant alert to your team via Slack, email, or other channels.
This automated system creates a single source of truth that finally gets marketing, development, and data teams on the same page. Everyone works from the same up-to-date tracking plan, which cuts out the confusion and makes real collaboration possible.
This screenshot shows how a proactive system can automatically spot and flag a new, unexpected event that doesn't match the defined tracking plan.
This kind of immediate detection stops "rogue" data from polluting your analytics and skewing your reports. You can be confident you’re only analyzing clean, intended information.
The goal of proactive governance is to make data quality a given, not a question. It frees your team from the burden of data validation so they can focus on what they do best: driving growth.
By adopting this modern approach, you move past the limitations of manual QA. You can confidently roll out new features and campaigns, knowing you have a safety net that will catch any data quality issues the second they appear. If you're interested in building a more robust framework, you can learn more about creating a marketing data governance strategy that scales.
Ultimately, proactive governance is about building a foundation of trust. When you know your data is accurate, you can make faster, more confident decisions that have a real impact on your bottom line. It transforms your digital marketing analytics from a source of frustration into a reliable engine for business growth.
Frequently Asked Questions About Digital Marketing Analytics
Diving into digital marketing analytics can feel overwhelming, whether you're just starting out or trying to level up your current strategy. It's totally normal to have questions. This section cuts through the noise to give you straight answers to the things marketers ask most.
What Is the First Step to Get Started with Digital Marketing Analytics?
Before you touch a single tool or look at a single metric, you have to start with your business objectives. It sounds simple, but it's the most critical step. Ask yourself, "What are we actually trying to accomplish with our marketing?"
This question is your North Star. Are you trying to drive more online sales? Generate better leads for the sales team? Or maybe just build brand awareness in a new market? Your answer dictates which data actually matters.
Let's say your goal is to "increase online sales by 15%." Suddenly, you know exactly what to look for. Your Key Performance Indicators (KPIs) become crystal clear:
- Conversion Rate: How many visitors are actually buying something?
- Average Order Value (AOV): How much is the typical customer spending?
- Customer Lifetime Value (CLV): What's the long-term value of each new customer?
Once you've defined your goals and the KPIs that track them, then you can start setting up your analytics tools. Starting with objectives ensures you’re collecting data with a purpose, not just hoarding numbers.
Do I Need to Be a Data Scientist to Succeed with Analytics?
Absolutely not. While a data scientist’s skills in statistical modeling are invaluable, a marketer's greatest strengths in analytics are business context and a healthy dose of curiosity. Your job isn't to write complex algorithms; it's to ask smart questions and use the data to tell a story about your customers.
Modern analytics platforms are built to be user-friendly, putting powerful data into the hands of non-technical people. The most important skills for a marketer are critical thinking and connecting the dots. Can you look at a drop in conversions and ask, "What did we change on the website last week?" Or see a traffic spike and dig into, "Which campaign is driving this?"
For the really deep technical stuff or to make sure the data plumbing is solid, you can always loop in developers. Or, even better, you can lean on automated observability tools that do the heavy lifting of data validation for you.
How Can I Prove the ROI of Investing in Better Analytics and Data Quality?
You prove the ROI by drawing a straight line from your data quality efforts to real business outcomes. It’s all about showing how better data leads to smarter decisions, which in turn leads to more revenue or lower costs.
First, take a snapshot of where you are now. How many hours does your team waste every month chasing down data discrepancies? How many campaigns are launched based on a gut feeling instead of hard evidence?
Once you put a solid analytics governance process or tool in place, you can measure the impact across a few key areas:
- Reduced Wasted Ad Spend: When your data is accurate, you can confidently cut underperforming campaigns and shift that budget to channels you know are working.
- Increased Conversion Rates: Data-driven optimizations to your website, landing pages, and user funnels translate directly into more sales and revenue.
- Higher Team Efficiency: Automating manual QA and data validation frees up hundreds of hours. Your team can finally stop fighting fires and start thinking strategically.
Frame the investment not as a cost, but as a direct driver of profitability. When you can show that a $1 investment in data quality prevents a $10 loss from a bad decision, the value becomes undeniable.
By linking clean data to smarter spending, higher conversions, and a more efficient team, you'll build a business case for ROI that's impossible to ignore.
Ready to stop reacting to data fires and start preventing them? Trackingplan provides a fully automated observability and QA platform to ensure your analytics are always accurate and reliable. See how you can build a foundation of trusted data by visiting https://trackingplan.com.