What is marketing analytics? This guide breaks down how to use data, metrics, and tools to move beyond guesswork and drive real marketing growth.
Marketing analytics isn't just a buzzword; it's the practice of taking raw marketing data and turning it into a roadmap for growth. It’s how you measure, manage, and scrutinize your marketing performance to squeeze every last drop of value out of your budget and maximize your return on investment (ROI).
Essentially, it’s the bridge between a spreadsheet full of numbers and game-changing business insights. This shift allows marketers to finally step away from guesswork and start making strategic decisions backed by cold, hard evidence.
From Gut Feelings to Data-Driven Growth
Not too long ago, marketing felt more like an art than a science. You’d launch a brilliant, creative campaign, cross your fingers, and hope for the best. Measuring what actually worked and resonated with customers was often a fuzzy, imprecise process.
Marketing analytics flips that entire script.

Think of it this way: old-school marketing was like navigating a ship with a dusty star map. It could point you in the right general direction, sure. But marketing analytics is your live GPS, giving you real-time data on your exact position, speed, and any icebergs lurking ahead. It provides a crystal-clear view of where you are and the best path forward.
This move from intuition to information is what separates the most successful teams from the rest. It’s what empowers you to deeply understand your customers, justify your budget with solid numbers, and confidently tie every marketing dollar to a real business outcome.
To give you a clearer picture, let's break down the core components of marketing analytics into a simple table. This helps visualize how each piece of the puzzle works together to provide a complete view of your marketing efforts.
Core Components of Marketing Analytics at a Glance
This table is just a snapshot, but it illustrates how these pillars build on one another—from gathering the raw data to predicting what comes next.
The Growing Importance of Analytics
This reliance on data isn't just a fleeting trend; it represents a fundamental change in how modern businesses compete. The proof is in the numbers. The global marketing analytics software market has exploded, growing from $2.7 billion in 2019 to a projected $6.8 billion by 2026. That’s a staggering 16.9% compound annual growth rate (CAGR).
This boom isn't happening in a vacuum. It’s driven by businesses all over the world scrambling for a competitive edge. As you can see from these marketing analytics market trends, the field is only getting bigger and more essential.
The reason for this rapid adoption is simple: companies that master analytics just perform better. They are far better equipped to:
- Understand the Full Customer Journey: You can finally map out how customers really interact with your brand across every touchpoint, from the first ad they saw on Instagram to the final click to buy.
- Optimize Every Marketing Dollar: Pinpoint exactly which channels are driving the highest ROI and confidently shift your budget away from the ones that aren't pulling their weight.
- Dramatically Improve Customer Experience: Use real behavioral data to find and fix friction points on your website or app, leading to happier customers and higher conversion rates.
- Forecast What's Coming Next: Analyze your historical data to predict future customer behavior, get ahead of market shifts, and build proactive strategies instead of constantly reacting.
In essence, marketing analytics gives you the "why" behind the "what." It doesn't just tell you that sales went up last month. It tells you exactly which campaign, which audience, and which message made it happen, so you can do it again. And again.
Understanding the Building Blocks of Analytics
To really get what marketing analytics is all about, you have to break it down into its core components. Think of these as the fundamental ingredients that turn a chaotic flood of raw data into sharp, actionable business intelligence. They're the DNA of your analytics—the essential pieces that snap together to tell a clear story about your customers and campaigns.
It all starts with metrics. These are the hard numbers, the quantifiable measurements that tell you what is happening. They are the specific figures you see in your reports, like website visits, conversion rates, or how many new leads you generated last month.
But metrics on their own are pretty one-dimensional. That's where dimensions come into play. Dimensions are the attributes that give your data context—the who, where, and when behind the numbers. For example, "visits" is just a metric. But "visits from organic search in Canada" combines that metric with two dimensions (channel and country) to give you a much richer insight.
Key Metrics Every Marketer Should Know
While you could track hundreds of different numbers, a few key metrics are the true vital signs of your marketing health. These are the KPIs (Key Performance Indicators) that really measure performance and prove your value.
- Return on Ad Spend (ROAS): This is the bottom line for your advertising. It tells you exactly how much revenue you're generating for every dollar you put into a campaign. A ROAS of 4:1 means you made $4 for every $1 you spent. It doesn't get much clearer than that.
- Customer Lifetime Value (LTV): This metric looks at the long game, predicting the total revenue you can expect from a single customer over their entire relationship with your brand. LTV is crucial for figuring out how much you can sustainably spend to acquire new customers.
- Cost Per Acquisition (CPA): This is the total cost of landing one new paying customer through a specific channel or campaign. A low CPA is a sure sign of an efficient and well-oiled marketing machine.
- Conversion Rate: This is the percentage of users who take a specific action you want them to, whether it's making a purchase, signing up for a newsletter, or downloading a guide. It's a direct measure of how persuasive your marketing really is.
Weaving Together a Complete Customer Picture
Knowing individual data points is useful, but the real magic happens when you start weaving different types of data together. By combining behavioral, transactional, and demographic information, you graduate from seeing what users do to understanding who they are and why they do it.
This holistic view is the difference between simply collecting data and truly understanding your audience. It's how you build a complete picture of the customer journey, from the first touchpoint to the final conversion and beyond.
Let's say you're an e-commerce brand. You might be collecting:
- Behavioral Data: Which pages a user browsed, which products they clicked on, and if they ditched their cart.
- Transactional Data: The final purchase total, the specific products they bought, and whether they used a promo code.
- Demographic Data: Their general location, age bracket, and the device they used (mobile vs. desktop).
When you layer these data sets, you might discover that mobile users aged 25-34 in California who watch product videos are 3x more likely to make a purchase over $100. Now that's an insight. It's a powerful piece of intelligence that allows you to tailor your campaigns and website experience with surgical precision.
The Challenge of Attribution
Finally, let's talk about one of the trickiest—but most critical—concepts in analytics: attribution. Attribution is the science (and art) of giving credit to the marketing touchpoints that led to a conversion. Was it the Facebook ad, the email newsletter, or the blog post that sealed the deal?
A common and deeply flawed approach is last-touch attribution. This model gives 100% of the credit to the final interaction a customer had right before converting.
Think of it like a championship basketball game. Last-touch attribution is like giving all the glory to the player who scored the final, game-winning basket. It completely ignores the point guard who made the perfect pass, the defenders who shut down the other team, and the coach who designed the play in the first place. It’s an incomplete story.
Modern analytics uses far more sophisticated models—like linear, time-decay, or data-driven attribution—to distribute credit more fairly across all the touchpoints in the journey. This gives you an accurate map of what's truly driving success, so you don't accidentally cut the budget for a channel that’s a crucial "assist" player.
Building Your Marketing Analytics Tech Stack
A marketing analytics strategy is only as good as the tools you use to bring it to life. Think of it like a chef's kitchen—you wouldn't use a bread knife to chop vegetables. In the same way, marketers need a curated set of platforms—a tech stack—to collect, analyze, and act on data. This ecosystem of connected tools is what turns messy, raw data into a clear stream of actionable information.
Your tech stack isn't just a single platform; it's a team of specialized tools working together. Each one has a specific job, whether it's tracking website traffic or dissecting how users interact with your product. Understanding these distinct roles is the first step toward building a solid analytics foundation that can answer just about any question you throw at it.
The infographic below shows how the core concepts your tech stack measures—metrics, dimensions, and segments—fit together in a hierarchy.
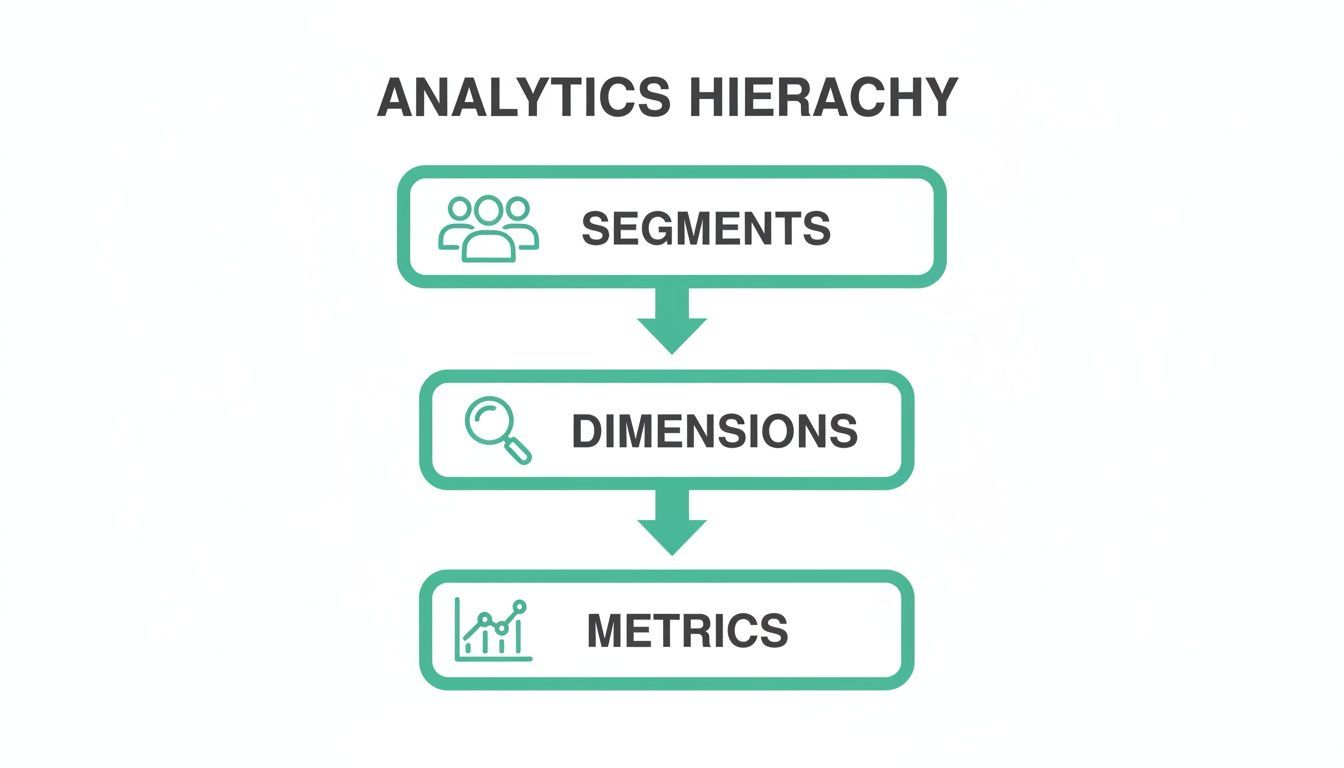
This visual breaks down how metrics get filtered by dimensions to create meaningful segments—the very building blocks of any analysis your tools will run.
Core Categories of Analytics Tools
The market is flooded with options, but most tools fall into a few key categories. While you might not need them all from day one, a mature stack usually includes at least one from each group.
Web Analytics Platforms: These are your eyes and ears for website traffic. Tools like Google Analytics 4 (GA4) or Adobe Analytics are masters at answering questions about where visitors come from, what pages they look at, and how they move through your site. They give you that high-level view of audience acquisition and engagement.
Product Analytics Platforms: When you need to know what users are doing inside your app or product, you turn to tools like Amplitude and Mixpanel. They focus on event-based tracking, letting you analyze things like feature adoption, user retention, and conversion funnels with incredible detail.
Data Visualization and BI Tools: Platforms like Tableau, Looker, and Power BI are where all your data comes together. They transform complex datasets from multiple sources into easy-to-understand dashboards and reports, making it simple for everyone—from marketers to the C-suite—to see the big picture.
The real magic happens when these tools talk to each other. An effective stack integrates these platforms, allowing web traffic data to connect with in-app behavior, which is then visualized in a single, unified dashboard.
Choosing and Integrating Your Tools
So, how do you choose? The right stack always depends on your business goals. An e-commerce site might lean heavily on web analytics and visualization to optimize its sales funnel. A SaaS company, on the other hand, will likely prioritize product analytics to fight churn and improve user onboarding.
To get a better sense of how these platforms can work together, check out our guide on integrating with various marketing analytics tools.
Beyond these core types, your stack will probably need specialized tools for specific channels. For example, it’s essential to explore various social media analytics tools to gather and interpret data from platforms like Facebook, Instagram, and LinkedIn.
The table below breaks down the most common tool categories, their functions, and where they shine.
Common Marketing Analytics Tool Categories
Ultimately, the power of your tech stack lies in its ability to provide a seamless, reliable flow of information. This sets the stage for what really matters: ensuring the data flowing between these tools is accurate, consistent, and trustworthy.
Why Data Quality Is the Foundation of Trust
In marketing analytics, there's an old, brutally honest saying: "garbage in, garbage out." It’s the unofficial motto for every analytics project that has ever gone sideways.
No matter how sophisticated your tools are or how slick your dashboards look, if the data feeding them is flawed, your conclusions will be useless. Worse, they could be dangerously misleading. This is why data quality isn't just a best practice; it's the absolute bedrock of everything you do.
Imagine driving a car with a speedometer that's off by 20 MPH. You'd either be crawling along and frustrating everyone or speeding and risking a ticket. You couldn’t trust it to make good driving decisions. Bad marketing data works the same way, causing you to misallocate your budget and miss critical opportunities.
Making decisions on bad data gets expensive, fast. With marketing budgets in the U.S. soaring to nearly $481 billion in 2022, the financial stakes have never been higher. A simple misconfiguration in a tracking pixel can erode already slim margins, turning potential revenue into wasted ad spend.

Uncovering the Silent Saboteurs of Your Data
Data quality issues are often subtle. They creep into your systems unnoticed and quietly sabotage your reports from the inside out, making your analytics completely untrustworthy.
Most of these problems fall into a few common categories that can wreak havoc on your entire data pipeline.
- Broken or Missing Tracking Tags: A new site update goes live, and suddenly the "add to cart" event stops firing. Without it, your conversion rate plummets to zero, and you have no idea why.
- Inconsistent Naming Conventions: The marketing team uses "utm_campaign=summer-sale" while the agency uses "utm_campaign=SummerSale2024". Your analytics platform sees these as two separate campaigns, splitting your data and making it impossible to measure the true ROI.
- Schema and Property Mismatches: A developer sends the
priceproperty as a string ("19.99") instead of a number (19.99). Now you can't perform calculations like summing up total revenue, breaking key financial dashboards. - Accidental PII Leaks: A user’s email address is mistakenly captured in a URL parameter and sent to your analytics tool. This isn't just a data quality issue; it’s a serious privacy violation that can lead to hefty fines.
These errors create a cycle of distrust. When leadership sees conflicting numbers or dashboards that don't make sense, they lose faith in the data—and in the teams that manage it.
Shifting from Manual Audits to Real-Time Observability
For years, the only way to combat these issues was through slow, painstaking manual audits. Analysts would spend days buried in spreadsheets, comparing implementation guides to actual data, trying to spot inconsistencies. That reactive approach just isn't sustainable anymore.
The modern solution is a shift toward analytics observability. Instead of hunting for problems after they've already corrupted your data, observability platforms automatically monitor your entire analytics setup in real time.
This new paradigm is all about moving from a reactive to a proactive stance on data quality. Platforms like Trackingplan continuously scan your websites and apps, discovering your tracking implementation and automatically detecting issues the moment they appear.
Think of it as a smoke detector for your analytics. It alerts you instantly to problems like:
- Broken Pixels: Notifying you if your Meta or Google Ads pixels stop firing.
- UTM Errors: Flagging campaigns that don't follow your established naming conventions.
- Data Mismatches: Identifying when data properties don't match the expected format or type.
- PII Leaks: Detecting and alerting you to potential privacy compliance risks.
This continuous, automated monitoring frees your team from the grind of manual audits, allowing them to focus on generating insights instead of fighting fires. It creates a system where every report and every dashboard is built on a foundation of data you can actually trust. To truly build trust and make effective decisions, it's crucial to understand How to Improve Data Quality in your analytics efforts.
By prioritizing this level of integrity, you ensure that your marketing analytics efforts are not just an academic exercise but a reliable engine for growth. You can also dive deeper into some key data quality best practices to strengthen your foundation.
Putting Marketing Analytics Into Practice
Knowing the theory behind marketing analytics is one thing, but seeing it solve real problems and drive real growth is where the magic happens. This is the point where data stops being just numbers on a screen and starts becoming a story about your customers.
Let's walk through a few mini-stories that show analytics in action. Each one started with a nagging business problem, used data to find the "aha!" moment, and ended with a measurable win for the company.
Use Case 1: The E-commerce Checkout Leak
An online fashion retailer had a big problem: a massive 70% of shoppers were adding items to their cart, only to disappear before paying. They were bleeding potential revenue, but they couldn't pinpoint where the leak in their checkout funnel was.
The team fired up their product analytics tool and ran a funnel analysis. This gave them a step-by-step visual of the checkout journey: "Add to Cart," "Enter Shipping Info," "Enter Payment Details," and finally, "Confirm Purchase."
The data screamed from the screen. A huge number of users—especially on mobile—were dropping off at the "Enter Shipping Info" stage. The culprit? Their shipping form was clunky, complicated, and a nightmare to fill out on a small screen.
Armed with that clear insight, they completely revamped the form, simplifying fields, adding autofill, and introducing a guest checkout option. The results were immediate. Within a month, their mobile checkout completion rate shot up by 25%, turning lost sales into real revenue.
Use Case 2: The B2B Content ROI Puzzle
A B2B software company was pouring money and effort into its blog, creating killer articles and guides. It was driving plenty of traffic, but the leadership team wasn't convinced. "Is this blog just getting us clicks," they asked, "or is it actually helping us sell software?"
The marketing team dug into their multi-touch attribution model. Instead of giving all the credit to the last thing a person did before requesting a demo (like a Google search for their brand name), this model looked at every single interaction a lead had along their journey.
The "aha" moment came when they saw the data. The blog was consistently the first or second touchpoint for over 40% of their highest-value customers. It played a crucial role in introducing the brand and educating prospects early in their decision-making process.
This proved the blog wasn't just a traffic-generating machine; it was a powerful lead-nurturing engine. With hard data in hand, they not only justified their budget but secured an increase. They doubled down on top-of-funnel content, leading to a 15% jump in qualified leads the very next quarter.
Use Case 3: The Mobile App Retention Crisis
A new mobile gaming app was seeing tons of downloads, but there was a catch: users were deleting it in droves within the first week. The churn was alarming, and the team had to figure out what separated the users who stuck around from those who didn't.
They turned to cohort analysis. This technique groups users by when they signed up (e.g., the "January Week 1" group) and then tracks their behavior over time. By comparing high-retention cohorts to low-retention ones, they could look for patterns.
The analysis revealed something critical: users who finished the tutorial and joined a "guild" within their first 24 hours were 5x more likely to still be playing 30 days later. The game itself wasn't the problem—it was a confusing and unengaging onboarding experience.
Based on this insight, the developers completely redesigned the first-time user experience. They made the tutorial more fun and interactive and prompted every new player to join a guild right away. This single change boosted their Day 7 retention rate from a dismal 12% to a healthy 28%, saving the app from the brink.
Common Analytics Pitfalls and How to Avoid Them
Knowing what not to do in marketing analytics is just as important as knowing what to do. So many promising data initiatives get derailed by common, avoidable mistakes. Getting a handle on these pitfalls is the first step to building a resilient, trustworthy analytics practice that actually delivers value.
One of the biggest traps is chasing vanity metrics. These are the numbers that look impressive in a slide deck but don't tell you a thing about your business's health. Think page views, social media likes, or follower counts. They might feel good to report, but they lack real context and don't connect to revenue or growth.
The fix? Relentlessly focus on actionable KPIs—metrics that reflect real business outcomes. Instead of obsessing over page views, track your conversion rate. Instead of counting likes, measure your cost per acquisition (CPA). Actionable KPIs tell you if you're making money, not just making noise.
Overcoming Data Silos
Another major roadblock is the classic data silo. This happens when data gets trapped within individual departments or platforms. The marketing team has its data, sales has its CRM data, and the product team has its usage data—and none of them talk to each other.
This fragmentation makes getting a unified view of the customer journey impossible. You can’t connect the dots between a marketing campaign and a final sale if the data lives in separate, disconnected worlds.
To break down these walls, you need a "single source of truth." This is often a centralized data warehouse or a Customer Data Platform (CDP) where all customer information is consolidated. It also helps to create cross-functional teams with folks from marketing, sales, and product to foster a culture of shared insight, ensuring everyone is working from the same playbook.
Ignoring Data Governance
Finally, a ton of organizations stumble by ignoring data governance. This is simply the set of rules, processes, and standards for how data is collected, stored, and used. Without it, you get chaos: inconsistent naming conventions, duplicate data, and a general lack of trust in the numbers.
For example, if one campaign uses utm_source=google and another uses utm_source=Google, your analytics tool treats them as two different sources, muddying your attribution reports. This might seem small, but thousands of these tiny inconsistencies can render your data useless.
A strong governance plan is your analytics constitution. It provides the framework for maintaining clean, consistent, and reliable data across the entire organization, ensuring every decision is based on a solid foundation.
Avoiding these common pitfalls isn't just about cleaning up data; it’s about building a culture of data discipline. By focusing on the right metrics, breaking down internal silos, and setting clear rules for data management, you transform your analytics from a source of confusion into a powerful engine for growth.
Frequently Asked Questions About Marketing Analytics
As you start to figure out what marketing analytics means for your team, a few common questions always seem to pop up. This section gives you quick, straightforward answers to help you tackle practical challenges and build on the core concepts we've covered.
How Do I Get Started If We Have No Analytics System?
The trick is to start small and stay focused. Don't fall into the trap of trying to measure everything at once—that’s a one-way ticket to analysis paralysis.
Start by defining one critical business goal, like boosting trial sign-ups or cutting down on cart abandonment. Next, install a foundational tool like Google Analytics 4 and concentrate on tracking only the key user actions (events) that directly influence that specific goal. Once you’ve mastered a handful of vital metrics and can prove their value, you can build out from there.
Think of it like building a house. You wouldn't start by decorating the rooms; you'd begin by pouring a solid foundation. For analytics, that foundation is tracking one or two core business objectives exceptionally well.
What Is the Difference Between Marketing Analytics and Business Intelligence?
While they're related, they play different roles. Here’s a simple way to look at it: Marketing Analytics is a specialist, laser-focused on marketing campaign performance and customer behavior to make marketing efforts better. Its main job is to boost marketing effectiveness and prove its ROI.
Business Intelligence (BI), on the other hand, is a generalist. It takes a much broader view, pulling together data from all corners of the business—sales, finance, operations, you name it—to inform the company's overall strategy. In short, marketing analytics is a vital, specialized piece of the much larger BI puzzle.
Which Marketing Analytics Skills Are Most In-Demand?
Knowing your way around platforms like GA4 or Adobe Analytics is just the start. The most valuable skills today are a mix of technical know-how and strategic thinking. The market wants professionals who can do more than just pull reports.
Here are the skills that really stand out:
- Data Interpretation and Storytelling: This is the magic of turning a spreadsheet of numbers into a clear story that explains what happened, why it matters, and what the team should do next.
- Data Quality and Governance: A solid understanding of how to keep data accurate, consistent, and trustworthy. This means knowing your way around tagging, UTM conventions, and privacy rules.
- Data Visualization: Being handy with tools like Tableau or Looker to build clean, intuitive dashboards that make complex information easy for anyone to grasp.
Don't let data quality issues undermine your marketing decisions. Trackingplan offers a fully automated observability platform that ensures your analytics are accurate, reliable, and trustworthy across your entire tech stack. Fix errors fast and build dashboards with confidence by visiting https://trackingplan.com to see how it works.