Confused about bounce rate vs exit rate? Learn the critical differences, how to analyze each metric, and strategies to improve user engagement on your site.
At first glance, bounce rate and exit rate can seem like two sides of the same coin. They both measure users leaving your site, right? Yes, but they tell completely different stories about why and when they leave.
The core distinction is this: Bounce rate is all about first impressions. It tracks the percentage of visitors who land on a page and leave without doing anything else. Exit rate, on the other hand, is about last impressions. It shows the percentage of visitors who left your site from a specific page, regardless of how many other pages they saw first.
Understanding the Key Differences

Let's use a real-world analogy. Think of your website as a physical store. A bounce is like someone peeking in the front door, deciding it’s not for them, and immediately turning around to leave. They never made it past the entrance.
An exit is completely different. This is a customer who came in, browsed a few aisles, maybe even tried something on, and then walked out through a specific exit. Every visitor eventually leaves, and the exit rate just tells you which door they used most often.
A bounce is always a single-page session. The page they entered on was the same page they left from. This often points a finger at a disconnect between your ad or link and the landing page content, a poor user experience, or just plain irrelevant traffic.
But an exit isn't inherently bad. In fact, it's often a sign of a successful visit. A high exit rate on a "Thank You for Your Purchase" page is exactly what you want to see. The visitor completed their goal and left satisfied. For a deeper dive into the metric itself, this guide on what is bounce rate breaks down the nuances across different platforms.
A high bounce rate often means your "front door" is broken. A high exit rate on a page that shouldn't be an exit suggests a problem somewhere deeper inside the store.
Getting this distinction right is foundational to good analysis. If you mix them up, you could end up trying to "fix" a thank-you page that’s working perfectly or, worse, ignoring a leaky checkout page that’s costing you sales.
Quick Comparison Bounce Rate vs Exit Rate
To put it all in one place, here’s a quick summary table that breaks down the fundamental differences between these two critical metrics.
This table helps clarify where you should focus your optimization efforts depending on which metric is raising a red flag.
How Each Metric Is Calculated and Interpreted
To really get the difference between bounce rate and exit rate, you have to look past the definitions and get into the math. The formulas themselves tell a unique story about user behavior, and knowing how to read that story is what separates surface-level reporting from genuine analysis. These metrics are not interchangeable—their calculations are fundamentally different.

A page’s bounce rate is all about its performance as a landing page. It’s only calculated for sessions that start on that specific page, which isolates the first impression and tells you how many people showed up and left without clicking anything else.
Here’s the formula:
Bounce Rate = (Total Single-Page Sessions on Page X / Total Sessions Starting on Page X) * 100
On the other hand, exit rate looks at all sessions that include a particular page, no matter where that session started. It shows how often a page was the very last thing a user saw before leaving your site. Every session has an exit page, but not every session has a bounce.
And its formula:
Exit Rate = (Total Exits from Page X / Total Pageviews of Page X) * 100
The Context of Calculation
The real key is in the denominator of each formula. Bounce rate is divided by entrances, making it a very narrow measure of a landing page’s relevance. Exit rate is divided by total pageviews, which gives you a much broader look at how a page fits into a larger user journey.
This mathematical distinction makes a huge difference in practice. A comprehensive Databox survey found the median bounce rate across all industries was 44.04%, which is way higher than typical exit rates that most sites keep under 40%. This contrast highlights a core truth in web analytics: bounces often signal immediate disengagement, while exits can be the natural conclusion of a successful visit. For a deeper dive, you can explore more insights on bounce and exit rates to see how they stack up.
A high bounce rate almost always signals a problem with relevance or user experience on arrival. A high exit rate, however, requires more context—it could be a sign of a successful conversion or a critical point of friction.
Practical Scenarios and Interpretations
Let's run through a few real-world examples to see how the context completely changes the interpretation.
Scenario 1: The Confirmation Page
Your "Thank You for Your Order" page might have an exit rate of 95%. This is fantastic. It means people are finishing their purchase and leaving, just as they should. Its bounce rate, however, will be close to 0% because almost nobody starts their session on a confirmation page.Scenario 2: The Blog Post
An informative blog post could easily have a bounce rate of 80%. This is often perfectly fine. Someone comes from a search engine, gets the answer they needed, and leaves satisfied. The single-page session fulfilled their intent.Scenario 3: The Checkout Funnel
Now, imagine your "Shipping Information" page has an exit rate of 60%. This is a massive red flag. It tells you that a majority of users who get this far are abandoning the checkout process, pointing to problems like high shipping costs, a confusing form, or technical glitches.
Getting these numbers wrong can send your optimization efforts in the wrong direction. Trying to "fix" the high exit rate on a confirmation page is a total waste of time. But ignoring a high exit rate on a critical funnel page could be costing you a ton of revenue. A high bounce rate usually points to a mismatch between what the user expected and what the page delivered, while a high exit rate on a non-exit page signals a clear roadblock in their journey.
Analytics Platforms and Measurement Differences
Getting a handle on bounce rate vs. exit rate is only half the battle. How these metrics are actually measured can change dramatically depending on your analytics platform, and the shift from Universal Analytics (UA) to Google Analytics 4 (GA4) is the biggest shake-up we’ve seen in years. The way you measure user disengagement has fundamentally changed.
In the days of Universal Analytics, the classic bounce rate was simple and punishing. A session was a bounce if it had only a single pageview—that’s it. It didn’t matter if the user spent ten minutes reading a blog post or just two seconds. This rigid definition often mislabeled productive single-page visits as failures.
The Rise of Engagement in GA4
Google Analytics 4 threw that old model out the window. It replaced the traditional bounce rate with a far more insightful metric called Engagement Rate. Instead of measuring instant rejection, GA4 focuses on meaningful interaction.
In GA4, Bounce Rate is simply the inverse of Engagement Rate. If your Engagement Rate is 80%, your Bounce Rate is 20%. This reframes the metric from a negative indicator to a more balanced view of user behavior.
So, what does GA4 consider an "Engaged Session"? It's any session that meets at least one of these criteria:
- Lasts longer than a specific time (the default is 10 seconds, but you can adjust this).
- Includes a conversion event.
- Involves at least two pageviews or screenviews.
This approach is much more nuanced. A user who lands on a blog post, reads it for a full minute, and then leaves is now correctly counted as engaged. UA would have called that a bounce. This shift gives you a much truer picture of your content's performance and whether it's actually satisfying your users. To get a better grasp of these new concepts, our detailed guide on understanding GA4 sessions and engagement metrics offers a deeper look.
How Exit Rate Remains Consistent
While bounce rate went through a major overhaul, the exit rate calculation has stayed pretty much the same between UA and GA4. It still tells you the percentage of sessions where a specific page was the very last one viewed. Its value as a diagnostic tool for finding friction points in your user journey is completely unchanged.
Whether you're looking at UA or GA4 data, a high exit rate on a critical funnel page, like your payment form, is still a major red flag that needs immediate investigation. The context and how you interpret this metric haven't really been altered by the platform update.
The Critical Role of Event Tracking
The move to GA4's event-based model makes precise tracking more important than ever. Because an "Engaged Session" can be triggered by a conversion event, a single misconfigured event can throw off your engagement metrics in a big way.
For instance, imagine a custom event meant to track a video play accidentally fires on page load. Suddenly, your Engagement Rate will be artificially inflated, and your Bounce Rate will plummet. This could easily mask a genuine problem with a landing page, tricking you into thinking it’s a top performer when it’s actually driving users away.
This is where data integrity becomes non-negotiable. An improperly configured tag can make a high-bounce page look like a star performer. Tools like Trackingplan are built to solve this exact problem by automatically validating your entire analytics implementation. It can spot misconfigured, missing, or rogue events in real time, ensuring your GA4 data is accurate and trustworthy. Without that layer of automated QA, you risk making critical decisions based on flawed engagement data.
When to Prioritize Bounce Rate vs Exit Rate
Deciding whether to focus on bounce rate versus exit rate all comes down to context. While both metrics track users leaving your site, they diagnose fundamentally different problems. The key is to align your analysis with the specific goal of each page, because one metric might signal a critical failure while the other is completely irrelevant.
Getting this context right is what moves you from just collecting data to making strategic decisions that actually improve user experience and drive your business goals.
The flowchart below shows how modern platforms like Google Analytics 4 think about user sessions, which helps visualize whether a single-page visit is considered engaged or a bounce.
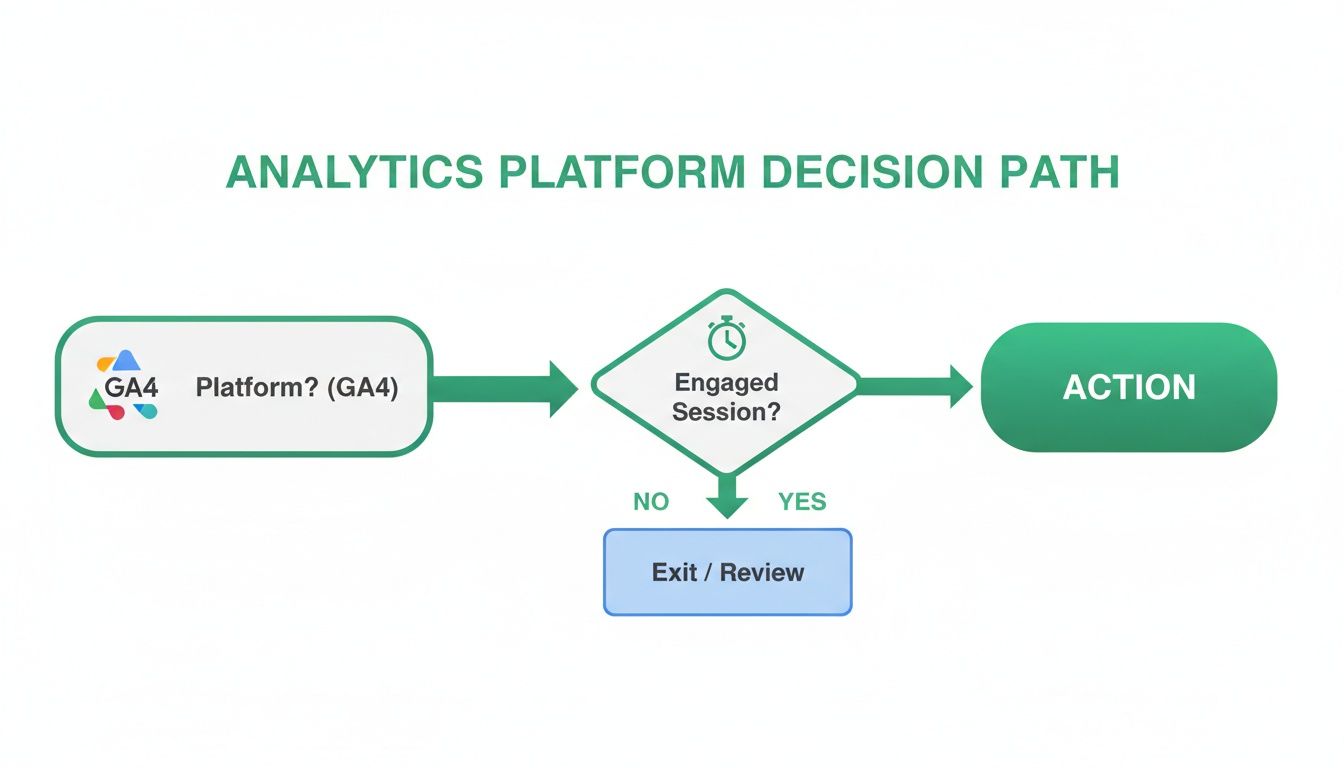
This decision tree makes it clear that in GA4, a session's outcome isn't just about the number of pages someone viewed. It's about whether they took a meaningful action or stayed long enough to consume the content.
Landing Pages and First Impressions
For pages designed to be the primary entry point for a specific audience, bounce rate is almost always the more important metric. This is especially true for pages tied to marketing campaigns, like those you build for paid search or social media ads.
Imagine you're running a Google Ads campaign for a new product and spending a good chunk of your budget to drive traffic to a dedicated landing page.
- A high bounce rate (or low engagement rate in GA4) is a serious red flag. It tells you there's a major disconnect between your ad copy and what's on the landing page.
- Users aren't finding what they expected, the page is loading too slowly, or the value proposition just isn't clear enough to convince them to click further.
In this situation, the exit rate is far less informative. Since it's a landing page, every session that bounces also counts as an exit, but the bounce rate specifically isolates the failure of that all-important first impression.
User Journeys and Funnel Analysis
On the flip side, when you're analyzing pages that are part of a multi-step user journey, exit rate becomes the critical metric to watch. These are pages that people aren't supposed to land on directly but navigate to from other parts of your site.
Think about an e-commerce checkout process, which typically includes several steps:
- Cart Review
- Shipping Details
- Payment Information
- Order Confirmation
A high bounce rate on the "Shipping Details" page is unlikely and not very useful, since very few users will start their session there. However, a high exit rate on this page is an immediate cause for alarm. It signals a major point of friction where users are abandoning their purchase—maybe due to unexpected shipping costs, a confusing form, or a lack of payment options.
High bounce rates often scream landing page failures from poor content matching or slow load times, while high exit rates whisper of funnel friction or natural journey endpoints. The median bounce rate often hovers around 44.04%, whereas exit rates below 40% are common on well-structured sites, showing how bounces are inflated by being tied to entries. For instance, 300 single-page sessions out of 1,000 entries is a 30% bounce rate, but 150 exits from 500 total pageviews is a 30% exit rate, which could just be a benign post-conversion event. To dig deeper into these benchmarks, you can find more about exit and bounce rate differences on WP Statistics.
Content and Informational Pages
For content-heavy pages like blog posts or knowledge base articles, the choice between bounce rate vs exit rate is more nuanced. A high bounce rate isn't necessarily a bad thing. A user might find the exact answer they need from a Google search, read your article, and leave completely satisfied. In GA4, if they stay for more than 10 seconds, this is considered an engaged session, not a bounce.
However, if you're analyzing a blog category page or a product listing page, a high exit rate could be problematic. These pages are designed to encourage exploration. If users are leaving from these pages frequently, it might indicate:
- Poor Navigation: Users can't easily find the next step or relevant links.
- Unappealing Content: The article titles or product images aren't compelling enough to click.
- Information Overload: The page is too cluttered, causing users to give up and leave.
In these cases, the exit rate gives you a much better sense of whether your navigational pages are effectively guiding users deeper into your site. Focusing on bounce rate here would be misleading, as these aren't typically landing pages.
To make this even clearer, here’s a quick guide to help you decide which metric to focus on depending on the page's purpose.
Scenario-Based Focus Metric Guide
Ultimately, choosing the right metric depends on what question you're trying to answer. Are you evaluating the first impression of a campaign, or are you looking for leaks in your conversion funnel? Answering that first will always point you to the right metric.
Ensuring Data Integrity for Accurate Insights
The entire conversation about bounce rate vs. exit rate rests on one massive assumption: that your data is actually accurate. Without trustworthy data, any analysis you do is just a well-informed guess—or worse, dangerously misleading. Even the most seasoned analyst can be led astray by faulty tracking that silently poisons their key metrics.
Your dashboard might paint a rosy picture of user engagement, but it could be hiding a serious bleed on your landing pages. Flawed data can convince you to pour money into failing campaigns or ignore friction points that are quietly killing your conversions.
Common tracking errors have a direct and dramatic impact on your bounce and exit rates. A single misplaced tag or a misconfigured event can corrupt thousands of data points, making your reports totally unreliable.
How Tracking Errors Distort Your Metrics
It’s often the small technical glitches that create the biggest analytical headaches. These errors can artificially inflate or deflate your engagement metrics, making it impossible to get a true read on what users are actually doing.
Here are a few common culprits that can wreak havoc on your data:
- Duplicate Pageview Tags: If a pageview tag fires twice on the same page, your analytics tool sees a "session" with two pageviews. This instantly prevents a single-page session from being counted as a bounce, artificially tanking your bounce rate and making underperforming pages look successful.
- Misconfigured Auto-Events: Events that fire automatically on page load, like a scroll tracking event that triggers instantly, can make GA4 register a session as "engaged" even if the user bounces immediately. This completely masks genuine bounces and gives you a false sense of security.
- Incorrectly Timed Events: If a timer-based event fires too quickly (say, after just one second), it can misclassify a bounce as an engaged session, hiding problems with your content's initial hook.
These seemingly minor implementation mistakes are often the root cause of confusing or contradictory analytics reports. When your bounce rate suddenly drops to near zero, it’s rarely because you’ve created the perfect landing page; it’s almost always a sign of a tracking error.
The Challenge of Manual Audits
Trying to catch these errors by manually auditing your analytics setup is a monumental task. It’s painfully slow, requires deep technical expertise, and is wide open to human error. A manual check might spot an obvious problem, but it will almost certainly miss the subtle issues that only pop up under specific conditions.
On top of that, modern websites are dynamic, with code being deployed multiple times a day. A perfectly configured setup today can break with the next release, and you might not even notice the data corruption for weeks or months. To truly get value from bounce and exit rates, it's essential to understand the broader field of Marketing Analytics and how it powers real growth—all of which depends on a foundation of clean data.
This is where automated data validation becomes non-negotiable. Continuous, real-time monitoring is the only practical way to ensure your metrics stay accurate over time.
Automated Monitoring for Reliable Dashboards
Automated analytics QA platforms like Trackingplan are designed to solve this exact problem. They continuously monitor your website’s data layer and tracking pixels in the background, acting as a permanent safeguard for your data integrity.
Instead of relying on periodic spot-checks, Trackingplan gives you real-time alerts the moment an anomaly is detected. This lets your team find and fix issues before they have a chance to corrupt your datasets and lead to poor business decisions.
Trackingplan can automatically spot critical problems that manual audits almost always miss, including:
- Rogue Events: Unplanned or deprecated events that are still firing and polluting your data.
- Schema Mismatches: Events sent with incorrect properties or data types, leading to data loss.
- Broken or Missing Tags: Critical marketing or analytics pixels that fail to fire on key pages.
By catching these issues as they happen, you can maintain trustworthy dashboards and have real confidence in the insights you draw from your bounce and exit rate analysis. This automated approach ensures that when you see a spike in your exit rate, you’re looking at a genuine user behavior problem—not just a technical glitch in your tracking.
Actionable Strategies for Improving Engagement
Knowing the difference between bounce rate and exit rate is one thing. Actually using that knowledge to make things better? That’s where the real value lies. With the right strategies, you can boost user engagement, smooth out friction points, and guide more visitors toward your goals.
Cutting down a high bounce rate is all about nailing that first impression. When someone lands on your page, you have just a few seconds to prove they’ve come to the right place.
On the other hand, tackling high exit rates means you need to dig deeper into the user journey. It’s about finding and fixing the roadblocks that make people give up halfway through a task, ensuring a clear path from start to finish.
Tactics to Reduce High Bounce Rates
If your landing pages are losing visitors as soon as they arrive, your focus should be on meeting their immediate expectations.
Optimize Page Load Speed: We live in an impatient world, and speed is everything. A page that takes more than a couple of seconds to load is a guaranteed bounce-driver. Study after study confirms that even a one-second delay can spike bounce rates, especially on mobile. Start by compressing images, minifying code, and using a content delivery network (CDN) to get content in front of users faster.
Strengthen Keyword-to-Content Alignment: A high bounce rate is often a clear sign of a mismatch between what users were looking for and what your page delivered. Make sure your page title, headers, and core content speak directly to the intent behind your target keywords. If your ad promises a 50% discount, that offer better be front and center on the landing page.
Craft Compelling Above-the-Fold Content: What users see without scrolling has to grab their attention and instantly confirm they're in the right spot. Use a clear, benefit-driven headline, punchy supporting text, and a high-quality visual to engage them from the get-go and encourage them to scroll down.

Strategies to Lower Problematic Exit Rates
When you see users dropping off from critical funnels, it’s time to simplify their path and get rid of any friction.
Improve Internal Linking Architecture: Don’t lead users to a dead end. On pages that aren’t a natural final step (like blog posts or category pages), provide clear, relevant internal links that guide them to the next logical action. For instance, a blog post about "social media trends" should link directly to a related service page.
Simplify User Pathways: A convoluted journey is a recipe for high exit rates. Map out your key conversion funnels—like your checkout process or a sign-up form—and hunt for unnecessary steps. Every extra click or form field is another chance for a user to get frustrated and leave.
Clarify Calls-to-Action (CTAs): A weak or confusing CTA can stop a user journey dead in its tracks. Make your CTAs pop with contrasting colors and use clear, action-oriented language. "Get Your Free Quote" is far more effective than a vague "Submit." If users don't know what to do next, they’ll probably just leave. For more detailed strategies, check out our guide on how to reduce bounce rate.
A key takeaway is that fixing bounces is about meeting initial expectations, while fixing exits is about guiding ongoing intent. The first is a sprint to capture interest; the second is a marathon to maintain momentum.
Frequently Asked Questions
To help you get a better handle on the practical differences between bounce rate and exit rate, let's tackle a few common questions that pop up during analysis.
Can a Page Have Both a High Bounce Rate and High Exit Rate
Yes, and when you see this, it’s often a red flag signaling a significant problem. This scenario typically happens on pages that act as both a major entry point from external sources (like paid ads or organic search) and a stop along an internal user journey.
For instance, a product page might get a high bounce rate because it’s the landing page for an ad campaign where the messaging doesn’t quite match the page content. At the same time, it could have a high exit rate if users arriving from other parts of your site discover the product is out of stock or poorly described, prompting them to leave right there.
What Is a Good Bounce Rate
There’s no magic number here. What counts as a “good” bounce rate is completely dependent on the page’s purpose and your industry. A blog post, for example, could have a bounce rate of 80%, and that might be perfectly fine if visitors found the answer they were looking for and left satisfied.
On the other hand, a service or product page with a bounce rate over 40-50% could point to a serious issue with its relevance or user experience. Context is everything. Always benchmark against your own goals, not generic industry averages.
How Does Custom Event Tracking Affect Engagement in GA4
In GA4, your custom event tracking setup is absolutely critical for getting accurate engagement metrics. An "Engaged Session" can be triggered by a conversion event, so if you have a misconfigured event that fires immediately on page load, a high-bounce page can suddenly look like one of your top performers.
This is precisely why a meticulous setup is non-negotiable for trustworthy analytics. One small error can artificially inflate your engagement rate and mask underlying problems, which is why continuous data validation is so important—it ensures the metrics you rely on reflect what users are actually doing.
Ensure every marketing decision is based on accurate, reliable data. Trackingplan automatically validates your entire analytics setup, detecting critical errors in real-time so you can fix issues fast and trust your insights. See how Trackingplan can protect your data integrity today.