A practical guide to digital marketing analytics. Learn to build a solid measurement plan, track the right metrics, and use data to drive real business growth.
Digital marketing analytics is all about collecting, measuring, and analyzing data from your online channels to figure out what's working and what's not. It’s how you turn a jumble of raw numbers—clicks, views, sign-ups—into a clear roadmap for growth, trading guesswork for data-driven decisions.
Why Digital Marketing Analytics Matters More Than Ever

Think of digital marketing analytics as the GPS for your entire marketing strategy. It’s not just about hoarding data; it's about using that data to tell a story. A story that reveals what your customers truly want, which campaigns are actually hitting the mark, and where every single dollar of your budget should go. Without it, you’re flying blind.
This practice is what connects your day-to-day marketing activities directly to real business outcomes. When you understand the data, you can finally answer the big questions that make or break your success.
Key Questions Analytics Can Answer
- Who are my most valuable customers? Analytics helps you pinpoint the demographics, behaviors, and acquisition channels of your best customers, so you can go find more of them.
- Which marketing channels deliver the highest ROI? It shows you whether that budget you poured into Google Ads, social media, or email marketing is actually paying off.
- How do users interact with my website or app? By tracking user journeys, you can spot and fix the friction points that are killing your customer experience.
- What content resonates most with my audience? You can see exactly which blog posts, videos, or social updates are driving the most engagement and conversions.
To really unlock the potential of your digital efforts, you need to get the fundamentals of marketing and data analytics right. This knowledge is what lets you build strategies based on solid evidence instead of just a gut feeling.
The High Stakes of Data Accuracy
Let’s be clear: the importance of accurate data can't be overstated. With global digital ad spend projected to soar past $730 billion by 2025, the cost of making decisions on bad data is astronomical. Poor tracking can lead to misguided budget allocations, costing teams millions in wasted ad spend. This is where automated observability platforms come in, detecting issues like broken pixels and UTM errors in real-time to make sure every dollar is accounted for.
The ultimate goal of digital marketing analytics is to achieve a single source of truth—a reliable, unified view of performance that your entire team can trust to make faster, smarter decisions.
This guide will walk you through everything you need to know, from the core metrics that matter to building a bulletproof measurement plan. The kind of plan that ensures your data is always accurate and ready for action. You can learn more about how this discipline works by checking out our complete guide on what digital analytics is and how it drives growth.
Choosing Your North Star Metrics and Models

In the world of digital marketing analytics, it’s incredibly easy to get lost in a sea of data. With hundreds of potential metrics at your fingertips, the real challenge isn't collecting data—it's figuring out what actually matters.
The solution is to cut through the noise and zero in on a select few Key Performance Indicators (KPIs) that are directly tied to your core business objectives. These are your "North Star" metrics. They serve as a constant guide, ensuring every marketing decision you make is steering the ship in the right direction. To find yours, you have to start with your goals.
Aligning KPIs with Business Goals
Every marketing campaign, ad, or piece of content ultimately serves one of three core business goals: getting new customers, keeping them engaged, or turning them into long-term fans. If you organize your KPIs under these pillars, you create a powerful framework for measuring what truly drives the business forward.
- Acquisition: This is all about bringing new people into your ecosystem and converting them into customers. Your metrics here should be focused on efficiency and growth.
- Engagement: Once you've captured their attention, you have to hold it. These KPIs tell you how people are interacting with your website, app, and content.
- Retention: The real win is building a loyal customer base that sticks around. Retention metrics track how well you're doing at creating long-term value.
This structure helps you avoid the trap of vanity metrics—things like page views or social media followers. They might look impressive on a report, but they rarely correlate with actual business growth. Instead, you'll focus on actionable metrics that inform real strategic decisions.
Choosing the right KPIs is like picking the right tools for a job. You wouldn't use a hammer to saw wood, and you shouldn't use engagement metrics to measure acquisition success. The right metric brings clarity and purpose to your work.
To help you get started, here’s a look at some of the most essential KPIs, broken down by the business objective they help you measure.
Key Marketing KPIs by Objective
This table provides a simple breakdown of crucial metrics, what they track, and which marketing goal they align with.
Focusing on these types of metrics ensures that your analytics are directly contributing to the bottom line, rather than just generating noise.
Understanding Attribution Models
Once you know what you’re measuring, the next big question is how you assign credit. A customer's path to purchase is rarely a straight line. They might see a social media ad, click a link in a Google search, and finally convert after opening a promotional email. So, which channel gets the credit? This is where attribution models come into play.
Think of your marketing channels as a soccer team. One player might score the goal (the final click), but several others made the crucial assists that set up the shot (the earlier touchpoints). An attribution model is the rulebook that decides how you credit both the goal-scorer and the assisters for that win.
Picking the wrong model can cause you to undervalue the channels that are quietly building awareness and nurturing leads in the background. It's vital to understand the different ways you can assign credit to see what best reflects your typical customer journey.
Here are a few common attribution models:
- First-Touch Attribution: This model gives 100% of the credit to the very first channel a customer ever interacted with. It’s great for understanding which channels are best at generating new awareness.
- Last-Touch Attribution: Here, the final touchpoint right before the conversion gets all the credit. This model highlights which channels are most effective at closing the deal.
- Linear Attribution: This model takes a team approach, distributing credit equally across every single touchpoint in the customer's journey. It’s a balanced view that acknowledges the contribution of each channel.
The model you choose fundamentally shapes your strategy and budget allocation. To go deeper, check out our guide on how to master channel attribution in GA4 and get a clearer view of performance. By pairing the right KPIs with a smart attribution model, you can build an analytics framework that gives you a true, actionable picture of your marketing impact.
How to Build a Bulletproof Measurement Plan
Good digital marketing analytics doesn't start with code; it starts with a solid blueprint. Just like you wouldn't build a house without architectural drawings, you shouldn't rush into implementation without a clear plan. That's a recipe for chaos, inconsistencies, and mistakes that are a real pain to fix later. Your measurement plan is that architectural work, making sure the data you collect is clean, consistent, and trustworthy from the get-go.
Think of this plan as the single source of truth for your entire organization. It spells out exactly what you'll track and, more importantly, why. It's the perfect antidote to that all-too-common problem where different teams track the same action with different names, leaving you with a messy, unusable pile of data. Getting these rules straight upfront will save you countless hours of debugging down the road.
A truly robust measurement plan stands on three pillars: a detailed tracking plan, a standardized data schema, and consistent UTM conventions.
Create Your Core Tracking Plan
The tracking plan is the heart of your measurement strategy. It’s usually a document, like a spreadsheet, that maps out every single user action you want to capture. It’s basically a dictionary for your data, defining the events and properties that actually matter to your business goals.
Instead of just tracking "clicks," a good tracking plan gets granular. For an e-commerce site, this means defining key events like "Product Viewed", "Added to Cart", and "Checkout Started". Each one of these tells a piece of the customer's story and helps you pinpoint exactly where people might be dropping off.
A great tracking plan doesn't just list events; it connects them directly to business questions. If you want to know "Why do users abandon their carts?" your plan must include events that capture every step of the checkout process.
Your tracking plan should be a living, collaborative document. Get marketers, product managers, and developers in the same room (or on the same call) to build it. This alignment ensures everyone agrees on what data is important and how it will be used, creating a shared language across the company. If you're ready to get started, you can learn more about how to build a customer data tracking plan that gets your whole team on the same page.
Standardize Your Data Schema
Once you've figured out what to track, the next step is to standardize how you track it. This is where your data schema comes in. A schema is just a set of rules for naming your events and their properties, ensuring you have absolute consistency across all your platforms—whether it's web, mobile, or server-side.
For example, your schema might state that all event names must follow an "Object Action" format, like "Product Viewed". It would also define the properties tied to that event, such as product_name, product_id, and price. This kind of strict naming convention is what stops your data from splintering into confusing pieces.
Without a schema, one developer might log an event as product_viewed while another uses viewed_product. Even though they seem similar, your analytics tool sees them as two completely separate actions, making accurate analysis impossible.
Key Schema Rules to Establish:
- Case Convention: Pick one and stick with it. Decide whether you'll use snake_case, camelCase, or another format for all event and property names.
- Property Naming: Standardize common property names. For instance, always use
user_idinstead of letting it get mixed up withuserIdorcustomer_id. - Data Types: Be specific about the data type for each property (e.g., string, integer, boolean). This prevents a world of hurt when it's time for analysis.
Establish Clear UTM Conventions
The final piece of your measurement plan is a clear set of UTM conventions. Urchin Tracking Modules (UTMs) are the little parameters you add to URLs to track how your marketing campaigns are performing. They are the primary way you tell your analytics tools where your traffic is actually coming from.
Inconsistent UTM tagging is one of the most common ways marketing data becomes a mess. A single campaign might get tagged with utm_source=facebook in one ad and utm_source=Facebook in another, splitting what should be a single source into two.
A UTM convention document solves this by setting firm rules for everyone on the marketing team. It should define exactly how to use each parameter.
utm_source: The platform sending the traffic (e.g.,google,facebook,linkedin).utm_medium: The marketing channel (e.g.,cpc,email,social).utm_campaign: The specific campaign name (e.g.,summer_sale_2024).utm_term: The paid keyword, if you're running search ads.utm_content: Used to tell different ads apart when they point to the same URL.
By enforcing simple rules like using lowercase, standardized names, and a clear structure, you ensure your campaign data stays clean and organized. This makes it far easier to analyze and accurately measure your ROI.
Implementing Analytics and Avoiding Common Pitfalls
With your measurement blueprint in hand, it’s time to bring your analytics strategy to life. This is the moment where theory meets practice, but it's also where many teams run into trouble. A brilliant strategy is only as good as its execution, and a flawed implementation can poison your data right from the start.
The first big decision is how you'll get your tracking in place. This usually boils down to using a tag management system or integrating SDKs directly.
- Google Tag Manager (GTM): This is a go-to for marketers. GTM lets you add and update tracking codes—or "tags"—on your website without having to mess with the site's actual code. It’s flexible and really speeds things up.
- Direct SDKs: For mobile apps or more advanced server-side tracking, developers will often integrate an SDK (Software Development Kit) straight into the codebase. This gives you more control but means you'll need an engineer every time you want to make a change.
This is the point where the foundational work you've already done—the plan, the schema, and the UTM definitions—becomes absolutely critical.
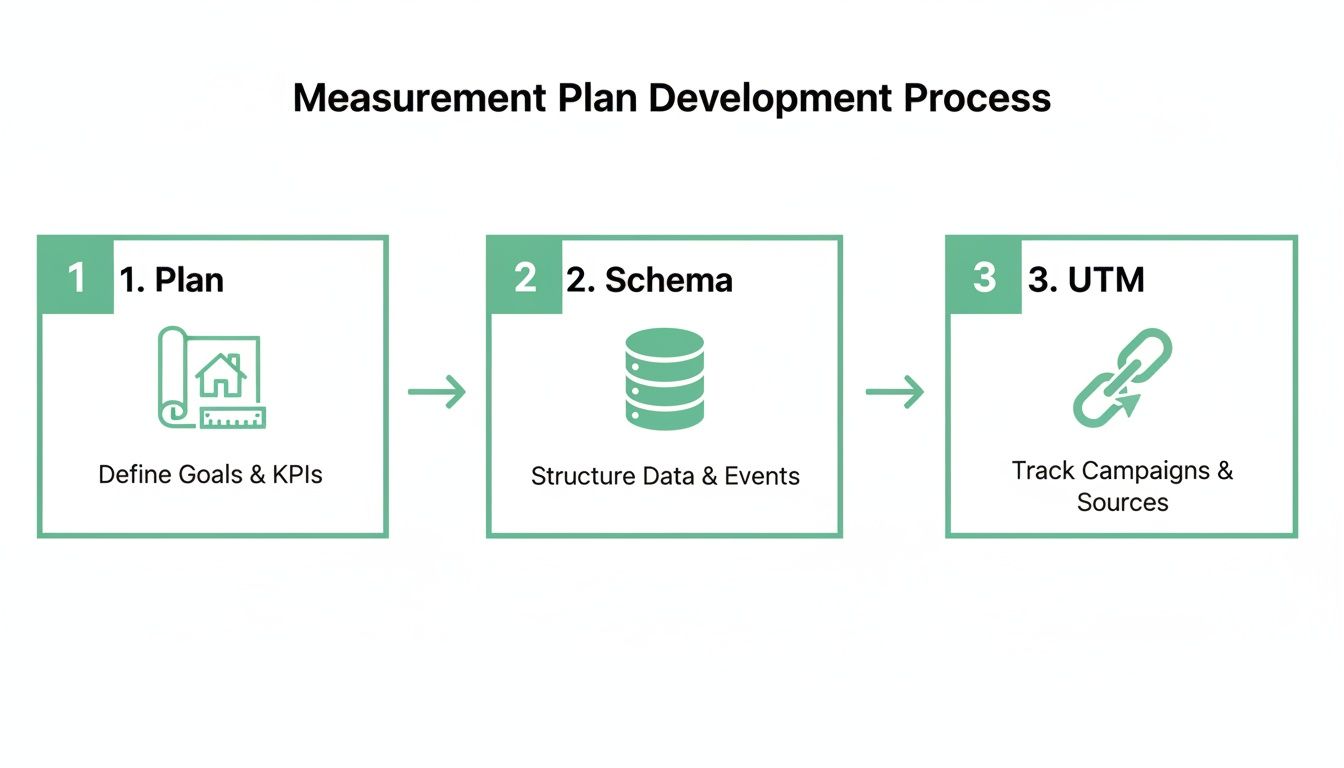
As you can see, a successful implementation doesn’t just happen. It's built on a clear, step-by-step planning process that ensures every piece is defined before a single line of code gets shipped.
Dodging Common Implementation Mistakes
Even with the best tools, a few hidden traps can completely derail your digital marketing analytics efforts. Knowing what they are is the first step toward building a data pipeline you can actually trust. The worst part is, these errors often go unnoticed for weeks or even months, silently chipping away at the quality of your insights.
One of the most common culprits is broken tracking pixels. A simple website update or a configuration slip-up in your tag manager can cause a marketing pixel, like the Meta Pixel or a Google Ads tag, to just stop loading. When that happens, your ad platforms go dark. No conversion data means you can't measure ROAS or optimize your campaigns. You’re effectively flying blind, burning through your budget with no idea what’s working.
Another sneaky problem is a data schema mismatch. This happens when the data being sent from your website doesn't align with the structure you laid out in your measurement plan. For example, a developer might accidentally send a price property as a string (text) instead of a number. This one tiny error can break every revenue dashboard you have and make it impossible to calculate simple metrics like average order value.
The integrity of your data is only as strong as its weakest link. A single broken pixel or mismatched property can invalidate entire reports, leading to poor decisions and wasted budget. Continuous, automated monitoring is the only way to catch these issues before they cause significant damage.
Preventing Silent Data Corruption
Beyond obviously broken pixels and schema errors, other critical issues often hide just below the surface. These problems are especially dangerous because they don't throw up big red flags—they just quietly corrupt your data over time.
Accidental PII Collection is a huge one, and it happens more often than you'd think. Personally Identifiable Information (PII) like names or email addresses can get captured in URL parameters after someone fills out a form. This is a major violation of privacy laws like GDPR and creates serious legal and financial risks for your business.
Finally, inconsistent event naming can create chaos. One team might track a newsletter signup as generate_lead while another uses form_submission. Your analytics tool sees these as two completely separate actions, splitting your data and making it impossible to get an accurate count of total leads. This is exactly why your measurement plan has to be the single source of truth for everyone involved.
These pitfalls all point to one critical reality in modern analytics: manual spot-checks just don’t cut it anymore. The complexity of today's tech stacks—with countless tags, tools, and platforms—demands an automated approach. Continuous monitoring is the only way to maintain data integrity, spot anomalies in real-time, and ensure the insights guiding your business are built on a foundation of trust.
Why You Need Automated Analytics Monitoring
Manually spot-checking your data is like trying to guard a fortress by only watching the front gate. While you're busy staring at one area, problems are quietly slipping in through a dozen other entry points. In today's complex digital ecosystems, this reactive approach to digital marketing analytics just doesn't cut it anymore. By the time you notice something's wrong, the damage is already done.
This is where automated analytics monitoring, or observability, comes into play. Think of it as a comprehensive security system for your data, with sensors on every window, door, and wall. It gives you a single source of truth by continuously watching your entire data pipeline—from user interactions on your website all the way to their final destinations in your analytics tools.

This dashboard shows how automated platforms pull everything into one place. Instead of logging into a half-dozen tools to hunt for errors, teams get an instant, real-time health check of their data quality across all sources and destinations.
Moving from Reactive to Proactive
The real power of automation is its ability to flip your organization from a reactive, firefighting mode to a proactive state of data confidence. You're no longer discovering a drop in conversions and then spending days trying to figure out why. Instead, an automated system alerts you the moment a tracking pixel breaks or a schema error pops up.
This real-time detection is a total game-changer. It means your marketing team can actually trust the dashboards they rely on for daily decisions, and your engineers are freed from the thankless, endless cycle of debugging analytics issues. That proactive stance is what lets you maintain momentum and stay agile.
Eliminating Data Silos and Errors
Data silos are a massive headache for marketing teams. Recent findings show that only 31% of marketers are fully satisfied with how their data is unified. Worse, a staggering 78% of U.S. B2C marketing executives admit their tech stacks are completely siloed. This fragmentation makes getting a holistic view of performance nearly impossible, forcing teams to waste hours trying to reconcile conflicting reports. You can explore more about these marketing statistics to see just how widespread the problem is.
Automated monitoring tackles this problem head-on by validating data consistency across all your tools. It acts as a universal translator, ensuring the data sent from your website perfectly matches what your ad platforms and analytics tools are expecting to receive.
An automated monitoring platform doesn't just find problems; it provides the context needed to fix them fast. By pinpointing the exact location and cause of an error, it drastically reduces troubleshooting time and protects the integrity of your marketing data.
For example, let's say a new website deployment accidentally changes the data type of your revenue property from a number to a string. An automated system will catch it instantly. This simple alert prevents a nightmare scenario where your revenue reports show $0 for days, leading to panicked decisions based on faulty information.
An automated observability platform is built to catch a wide range of critical issues before they can poison your business decisions:
- Broken Pixels: Get alerted instantly if a key marketing or attribution pixel stops firing.
- Schema Mismatches: Detect when data properties don't match your defined tracking plan.
- UTM Errors: Identify campaign tagging that violates your established conventions.
- PII Leaks: Flag potential privacy breaches where personal data is accidentally collected.
By systematically catching these errors, automation builds a foundation of trustworthy data. This allows marketers to get back to focusing on strategy and optimization, confident that the numbers guiding them are accurate and reliable.
Putting Your Analytics into Action
Theory and planning are great, but the real magic in digital marketing analytics happens when you turn that data into actual decisions. This is where a well-built dashboard comes into play, transforming a sea of abstract metrics into a clear, actionable story.
Let's walk through two practical examples that show how different teams can put their analytics to work. Think of these workflows less as simple reports and more as a command center for making smart, strategic moves that answer critical business questions.
The Performance Marketer's ROAS Dashboard
For a performance marketer, every dollar spent is under a microscope. Their world revolves around maximizing return on investment, so they need a dashboard that draws a straight line from ad spend to revenue. This dashboard is all about efficiency and relentless optimization.
The big question this dashboard needs to answer is: "Which campaigns are actually delivering the highest Return on Ad Spend (ROAS)?"
To get that answer, the dashboard has to pull in several key metrics, all of which depend on clean, consistent UTM data from your measurement plan.
- Return on Ad Spend (ROAS): This is your hero metric. It shows the revenue you’re generating for every dollar you spend on ads. You should be able to slice this by campaign, channel, and even by a specific ad creative.
- Cost Per Acquisition (CPA): This tells you the average cost to land one new customer. It's perfect for spotting which channels are the most cost-effective at bringing people in.
- Conversion Rate: What percentage of users who click an ad actually take the action you want? This metric tells you if you're driving high-quality, motivated traffic.
- Click-Through Rate (CTR): This is a top-of-funnel diagnostic that shows how compelling your ads are. Low CTR? Your ad copy or creative probably isn't hitting the mark.
With this dashboard fired up, a marketer can see in a glance that their summer_sale_2024 campaign on Google is crushing it with a 4.5x ROAS, while the same campaign on Facebook is lagging at just 1.8x. The next move is obvious: shift budget from the underperforming Facebook campaign to double down on the profitable Google one.
The Product Analyst's Engagement Dashboard
While marketers are focused on getting users in the door, product analysts are obsessed with what happens after they sign up. Their mission is to figure out how people are actually using the product, all with the goal of improving the user experience and keeping them around for the long haul.
Their dashboard is built to answer: "Where are users dropping off in our onboarding funnel, and what features are driving long-term retention?"
This dashboard is powered by the event data you defined in your tracking plan—things like Signed Up, Completed Profile, and Used Feature X.
A product dashboard visualizes the user journey, revealing the moments of delight that create loyal customers and the points of friction that cause them to leave.
Here’s what you’d typically find on a product analyst's dashboard:
- Funnel Conversion Analysis: This is a step-by-step visualization of a key user flow, like onboarding. It clearly flags where the biggest drop-offs are happening between steps.
- User Retention Cohorts: This chart is the ultimate measure of product stickiness. It groups users by the week they signed up and shows what percentage of them are still coming back over time.
- Feature Adoption Rate: This metric tracks which features get the most love from your users. It helps the product team decide what to build next, what needs a refresh, and what might not be resonating.
Imagine the analyst notices a massive 60% drop-off between the "Create Account" and "Invite Teammate" steps in the funnel. That’s a huge red flag. This data gives them a clear signal to investigate that specific part of the user experience, likely kicking off some A/B tests to simplify the invitation flow and get more people through.
Beyond your own internal metrics, putting analytics into action also means understanding what your competitors are up to. This is where advanced AI competitor analysis tools can give you a serious strategic edge. When you combine your internal dashboards with external market intelligence, you get the complete picture you need to guide your strategy.
Frequently Asked Questions About Digital Marketing Analytics
It's natural to have questions when you're wading into digital marketing analytics. This space is full of nuances. Below, I've answered some of the most common questions and sticking points that marketers run into. My goal is to give you clear, straightforward answers to help you move forward with confidence.
How Do I Choose the Right Analytics Tool?
The best tool for you boils down to your specific business goals and, of course, your budget. For most businesses just getting started, Google Analytics 4 is a fantastic, no-cost option. It's powerful enough to give you a solid handle on website performance and where your users are coming from.
When you're ready to dig deeper into how users interact with your product, tools like Amplitude or Mixpanel are built for that kind of advanced behavioral analysis. And if you're trying to wrangle data from a dozen different sources, a Customer Data Platform (CDP) like Segment can be a lifesaver by creating one unified view of your customer.
My advice? Always lead with your measurement plan. Figure out what you need to track first, then go find the tool that fits. Don't let a tool's features dictate your strategy.
What Is the Difference Between Analytics and Reporting?
This is a really important distinction that often gets blurred. Think of it this way: reporting shows you what happened, while analytics explains why it happened and guides you on what to do next.
- Reporting is the "what." It's about presenting the facts. For instance: "We gained 1,000 new users this month."
- Analytics is the "why" and "what's next." It's about finding the story in the data. For example: "Those new users came from our latest ad campaign, which has a 20% higher conversion rate. We should probably put more budget behind it."
Reporting gives you the numbers; analytics gives you the narrative and the action plan.
How Can I Ensure My Analytics Are Compliant?
In today's world, privacy compliance isn't optional. The absolute first step is getting a Consent Management Platform (CMP) in place. This ensures you're properly handling user consent before any tracking cookies or pixels even think about firing.
It's also crucial to avoid collecting Personally Identifiable Information (PII)—things like names or emails—unless you have explicit consent and rock-solid security. Automated tools are great here, as they can continuously scan for accidental PII leaks and double-check that your consent rules are working correctly across every platform you use.
At Trackingplan, we built a fully automated observability platform to serve as the single source of truth for your analytics. We help you catch data errors before they become problems, stay on top of privacy compliance, and build dashboards you can actually trust. The result? You can maximize your marketing ROI with confidence. Find out how we can help protect your data integrity at https://trackingplan.com.