Unlock reliable insights with our complete guide to data quality monitoring. Learn key metrics, best practices, and tools to fix errors and trust your data.
Data quality monitoring is the practice of keeping a constant, automated eye on your data pipelines to spot, diagnose, and fix issues as they happen. Think of it as a proactive security system for your analytics, making sure the data you use for big decisions is always accurate and trustworthy.
The Hidden Costs of Bad Data and Why Monitoring Is Your Solution

Imagine your marketing dashboard is a car's GPS. If it's fed faulty location data, you'll just drive in circles, wasting time and gas. Bad data works the same way—it quietly sabotages your business decisions, and you often don't realize it until it's far too late.
Every broken pixel, rogue event, or inconsistent UTM tag introduces tiny errors that snowball as they move through your systems. This isn't just a technical headache; it leads to real, tangible losses. We're talking wasted ad spend on misattributed campaigns, flawed personalization that pushes customers away, and a slow, steady erosion of trust in your analytics platforms.
When your teams can’t rely on their dashboards, they stop using them. Gut feelings take over, and data-driven strategy goes out the window.
From Reactive Cleanups to Proactive Health
The old way of handling data quality was to run periodic, manual audits. This meant a frantic, reactive scramble to fix problems long after they’d already poisoned your insights. That model just doesn't cut it anymore.
Modern Martech stacks are a complex web of tools, with data flowing from countless sources to destinations like Google Analytics or Adobe Analytics. A single code change or a third-party script update can break your tracking without any warning, making manual oversight impossible.
This is why a shift to proactive data quality monitoring isn't just a nice-to-have. It’s a strategic imperative for protecting revenue and staying competitive.
Data quality monitoring moves your team from a state of reactive data cleanup to one of proactive data health. It's about catching issues the moment they happen, not weeks later when a stakeholder questions a report.
With continuous, automated monitoring, you're always ahead of the game. Instead of discovering a broken add_to_cart event at the end of the month, a monitoring system alerts you within minutes. This stops days or weeks of bad data from ever polluting your reports.
The contrast between unmonitored data and a well-monitored system couldn't be starker. Here’s a quick breakdown of how data quality impacts key business areas.
The Business Impact of Poor vs High-Quality Data
Ultimately, investing in data quality monitoring pays for itself by preventing costly mistakes and unlocking the true potential of your data.
The Growing Demand for Automated Solutions
The industry is clearly moving toward automation. The global AI in Data Quality Market was valued at USD 0.9 billion in 2023 and is projected to explode to USD 6.6 billion by 2033. This massive growth signals a huge demand for smarter, more efficient solutions.
For digital analysts and marketing teams, this trend is a game-changer. AI-powered tools are becoming essential for tackling data chaos head-on, preventing misguided campaigns and wasted ad spend before they can do any damage. You can explore the full research on this market growth and what it means for the future of analytics.
Exploring the Core Dimensions of Data Quality
To get a real handle on data quality, we first need a shared vocabulary for what "good" data actually means. It’s not one single thing. Think of it like a doctor’s checkup for your data—they don't just take your temperature. They check your blood pressure, listen to your heart, and run tests to get the full picture.
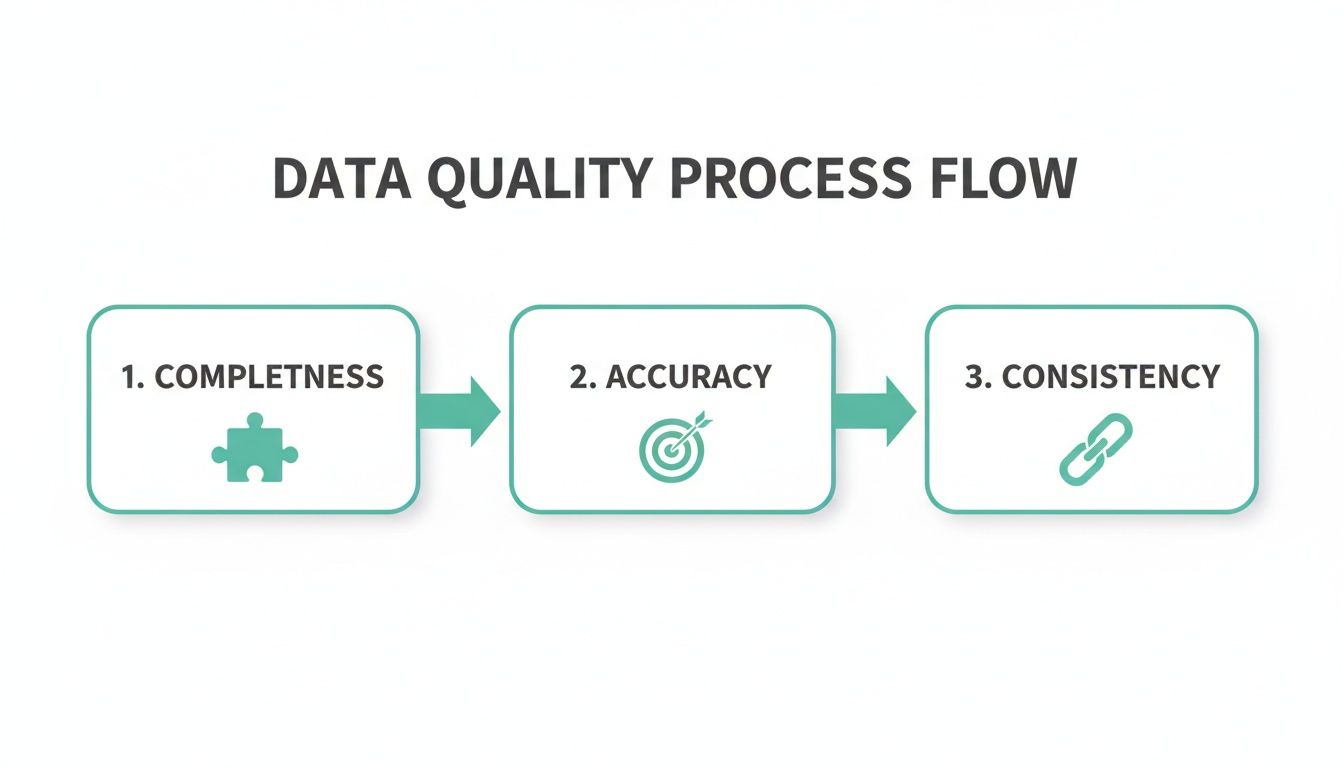
Similarly, breaking down data quality into its core dimensions helps teams move beyond a vague feeling that "the data is wrong." It lets you pinpoint the exact problem and find a solution. Let's walk through the six core dimensions every analytics and marketing team needs to know.
Completeness
Completeness asks a simple question: is all the data you expect to be there actually present? Are you seeing empty cells or null values in critical fields? Imagine you're trying to analyze a marketing campaign, but 30% of your records are missing the utm_source parameter.
That kind of gap makes it impossible to attribute your conversions correctly. You're left guessing which channels are actually working. Good data quality monitoring automatically flags these holes, making sure your datasets are whole and ready for analysis.
Accuracy
Accuracy is all about whether your data reflects what's happening in the real world. Is the information true? For instance, if your analytics tool says a user is in New York, but they're really logging in from California, that data is inaccurate.
In marketing, this could show up as an order_value of $1,000 for a product that costs just $10. Inaccurate data leads to bad conclusions, wasted budgets, and poor business decisions. Accuracy is what grounds your insights in reality.
Data quality dimensions give you a framework to ask the right questions. Instead of just saying the data is "bad," you can ask, "Is it incomplete, inaccurate, or inconsistent?" Getting that specific is the first step toward fixing the problem.
Consistency
Consistency ensures your data is uniform across different systems. Is the same piece of information represented the same way everywhere? If a customer is "John Smith" in your CRM but "J. Smith" in your email platform, you've got an inconsistency.
This fractures your view of the customer and makes personalization a nightmare. A consistent dataset means you have a single, reliable source of truth to work from. It's worth noting that frameworks like the SOC 2 Trust Services Criteria also emphasize processing integrity, which lines up perfectly with these principles of data quality.
Timeliness
Timeliness is about having data available when you need it. Data that shows up late can be just as useless as data that's flat-out wrong. If your daily sales report for Monday doesn't land in your inbox until Wednesday, you've already lost a critical window to react to performance trends.
Real-time decisions, especially in the fast-moving world of marketing, depend on timely data. Monitoring for timeliness guarantees your insights are current and actionable, not just a look in the rearview mirror. To learn more about this and other standards, it's a great idea to review some common data quality best practices.
Uniqueness
This dimension is all about hunting down and eliminating duplicates. Are you seeing the same person or event pop up as multiple, separate records? A classic example is having three different entries for the same customer because they used three different email addresses to sign up.
Duplicate records will inflate key metrics like your "total user" count and can lead to annoying customers by sending them the same marketing message multiple times. Ensuring uniqueness keeps your analysis clean and your customer experience smooth.
Validity
Finally, validity checks whether your data follows the rules. Does it conform to a specific format, type, or convention your team has agreed on? An email address field, for example, should always contain an "@" symbol, while a phone number should only contain numbers.
A perfect marketing analytics example is UTM parameters. If your team has a rule that utm_campaign must follow a "product_launch_q4_2024" format, any tag that doesn't fit this pattern is invalid. Monitoring for validity makes sure your data is structured correctly and actually usable for segmentation and reporting.
How to Build an Effective Data Quality Monitoring Workflow
You can't just buy an effective data quality monitoring strategy off the shelf; it's a process you have to build from the ground up. While tools are a huge help, it's the workflow that really turns monitoring from a dry, technical chore into a strategic advantage that gets everyone on the same page.
A solid workflow provides a clear blueprint for developers, analysts, and marketers, allowing them to work together to protect the integrity of your data. It takes the vague idea of "data quality" and breaks it down into a series of concrete, repeatable steps for finding, defining, and fixing issues before they ever have a chance to mess with your insights.
Step 1: Discovery and Baselining
You can't monitor what you don't understand. The very first step is to create a complete map of your entire analytics implementation. This means digging in and identifying every single event, property, and user journey that the business depends on.
Think of it like taking a detailed inventory of all your data assets. This process of baselining creates a single source of truth—your official tracking plan. It documents exactly what data should be collected and from where. Without this baseline, spotting a problem is nearly impossible because you have no "normal" to compare it against.
Step 2: Defining Rules and Thresholds
Once you have that baseline, you can start defining what actually counts as an error. This is where you get specific, setting up custom validations and thresholds for your most important data flows. The goal isn't to monitor everything with the same level of intensity; it's about zeroing in on what truly matters to the business.
Here are a few practical examples of rules you might set up:
- Critical Event Monitoring: Trigger an alert if the
purchase_completedevent volume suddenly drops by more than 50% in an hour. A dip that sharp could mean your checkout flow is broken. - Campaign Tagging Integrity: Create a validation to make sure all
utm_campaignparameters stick to a specific naming convention. This is how you keep your marketing attribution data clean and reliable. - Schema Validation: Flag any new or unapproved properties that pop up on a
user_signupevent. This stops "rogue" data from cluttering your analytics before it starts.
Rules like these turn your monitoring system into a customized watchdog, trained specifically to protect your key business metrics. You can learn more about how to set up these kinds of protections and ensure data integrity across your entire stack.
Step 3: Automated Monitoring and Alerting
With your rules in place, the next step is to let automation take over. Modern data quality monitoring platforms work around the clock, constantly scanning your data pipelines for any violations of the rules and thresholds you've established. This is where you finally get to say goodbye to manual spot-checking and hello to 24/7 automated vigilance.
When an anomaly is detected, the system immediately sends a notification to the right people. These alerts usually plug directly into your team's existing workflows through tools like Slack, Microsoft Teams, or email, so issues get seen and dealt with right away.
Step 4: Root Cause Analysis and Remediation
The final step closes the loop. Getting an alert is great, but it's only useful if it leads to a fast solution. An effective workflow needs a clear process for digging into the root cause of an issue and, of course, fixing it.
For instance, this dashboard gives teams immediate visibility into data inconsistencies.
By showing exactly which events or properties are missing or malformed, your team can quickly figure out if the problem came from a bad code deployment, a broken third-party pixel, or a recent API change. This systematic approach transforms data quality from a reactive headache into a proactive, manageable process.
Common Data Quality Issues and How to Catch Them
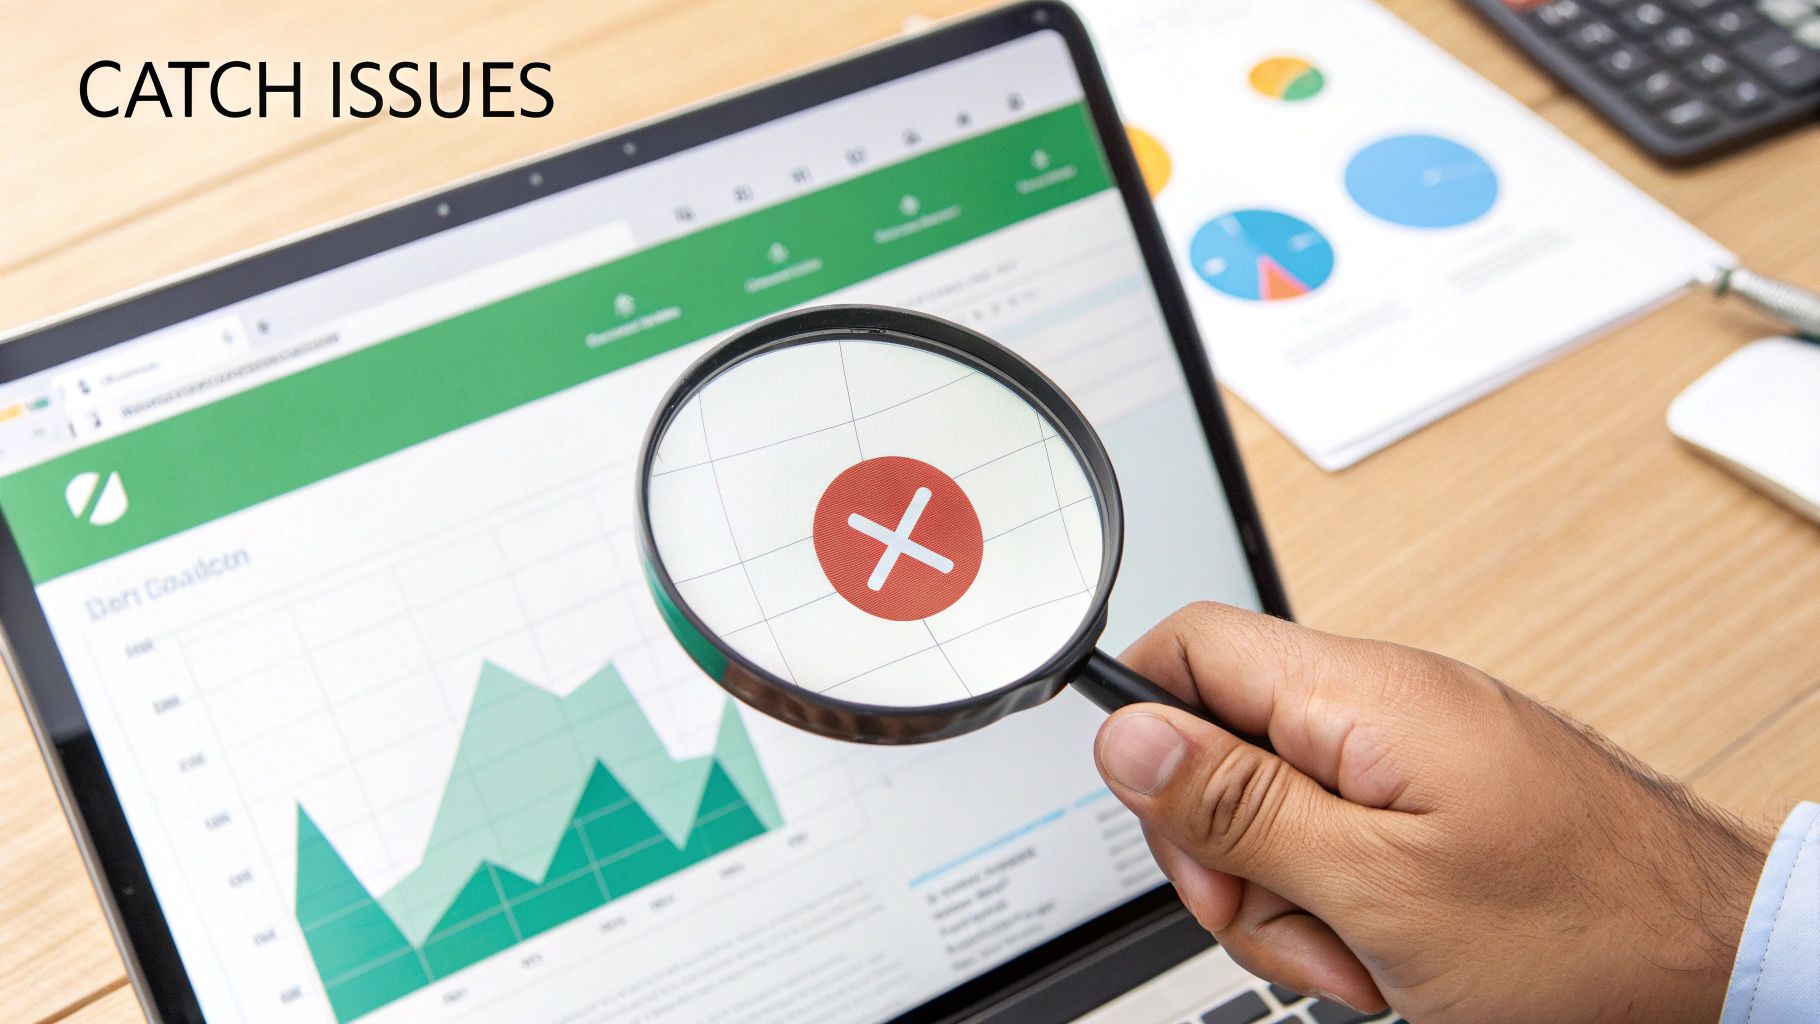
Theory is one thing, but the real test of a data quality monitoring strategy is how it holds up in the wild. Data breaks in predictable ways, often at the worst possible moments. Let’s get in the trenches and look at four common data disasters that give analytics teams nightmares.
Each scenario is a real-world problem that can quietly poison your data and lead business decisions astray. More importantly, we'll pinpoint the exact automated monitoring rule that acts as a safety net, catching the issue before it spirals out of control.
The Case of the Missing Events
Picture this: your e-commerce team just pushed a major site update. Everything looks fantastic, but an engineer accidentally nuked the dataLayer push for the add_to_cart event. For days, maybe even a week, the event volume is zero. Nobody notices because overall site traffic looks fine. By the time someone finally pulls up the conversion funnel report, you’ve lost a week of critical behavioral data.
The business impact is severe. You can't analyze which products are getting attention, A/B tests on product pages are shot, and your remarketing audiences are starving. This isn't just an inconvenience; it's a massive blind spot that directly hits the bottom line.
Automated Solution: A volume anomaly rule. This is your first line of defense. Set a monitor to scream if the
add_to_cartevent count craters by 90% or more over a 24-hour period compared to the previous week's average. This simple threshold turns a silent failure into an immediate, actionable alert.
The Rogue Property Invasion
In the rush to ship a new feature, a developer adds a few extra properties to the user_signup event for debugging. Things like dev_test_user_id and temp_debug_flag. They forget to clean them up before deploying to production. Suddenly, your analytics destination is flooded with unapproved, messy properties.
This "rogue property invasion" clutters your analytics environment, making it a nightmare for analysts to find what they need. It bloats your event schema, can push you over property limits in tools like Mixpanel, and creates a pile of technical debt someone has to deal with later.
Automated Solution: A schema validation rule. This is your quality gatekeeper. Implement a rule that automatically flags any event property that isn't defined in your official tracking plan. The second an unapproved property shows up, the system sends an alert, letting you squash the issue before it contaminates your dataset.
The UTM Chaos
Your marketing team is running campaigns across multiple channels, but there's no enforced standard for UTM tagging. One person uses utm_source=facebook, another uses Facebook, and an intern uses FB. The result? Absolute chaos in your attribution reports.
Because the source names are all different, your analytics platform sees them as three separate channels. It becomes impossible to accurately measure the ROI of your Facebook campaigns. You're left guessing which ads are working and which are just burning cash, defeating the entire purpose of tracking.
Automated Solution: A pattern matching rule. Create a validation that checks if the
utm_sourcefield sticks to a predefined list of accepted values (e.g., 'google', 'facebook', 'linkedin'). If a tag doesn't match this allowlist, the system triggers an alert, and the marketing team can fix the rogue tag immediately.
The Accidental PII Leak
A developer updates a web form and unintentionally configures it to capture the contents of the 'email' field as a custom event property. Just like that, Personally Identifiable Information (PII) is flowing directly into your analytics tools—a major privacy violation and a breach of terms of service for platforms like Google Analytics.
This is the DEFCON 1 of data quality errors. It exposes your company to huge legal and financial risks, including crippling fines under regulations like GDPR and CCPA. It also shatters customer trust, which is incredibly difficult to win back.
Automated Solution: A PII detection rule. A sophisticated monitoring tool can automatically scan all incoming event properties for patterns that look like sensitive data—email addresses, phone numbers, or credit card numbers. If a potential PII leak is found, it triggers a high-priority, all-hands-on-deck alert so you can shut it down instantly.
The table below summarizes these common headaches and how a solid monitoring setup can be the cure.
Common Analytics Errors and Their Automated Solutions
This table breaks down some of the most frequent data quality issues, their potential damage to the business, and the specific automated rules that catch them in real time.
Having these automated checks in place is like having a dedicated security team for your data, constantly watching for anything that looks out of place so you can act before minor issues become major disasters.
Understanding the Modern Data Quality Stack
Today’s data stack is a sprawling network of interconnected tools. Data flows from sources like your website, mobile app, and servers, often passing through a Customer Data Platform (CDP) like Segment before landing in destinations like Google Analytics, Mixpanel, or various ad platforms. With so many moving parts, keeping your data clean can feel like an impossible task.
This complexity has given rise to a new, critical category of tools: automated analytics QA and observability platforms. Think of them as a dedicated security system for your data pipelines.
These platforms don't actually process or transform the data themselves. Instead, they sit over your entire stack, watching everything that moves in and out. Their only job is to ensure nothing unexpected gets in, nothing important gets lost, and everything flowing through the system is exactly what it should be.
A New Layer of Trust
Unlike traditional tools that focus on data processing or visualization, an observability platform complements your existing stack instead of trying to replace it. It acts as an independent verifier, giving you a single source of truth that bridges the communication gap between different teams.
When a dashboard looks wrong, the old way involved a painful, multi-team blame game. Marketers would question the data, analysts would blame the implementation, and developers would be left trying to figure out what broke. Observability completely changes this dynamic.
It provides a clear, objective record of what data was sent, from where, and when. This gives teams the hard evidence they need to find the root cause quickly, whether it's a broken pixel, a bad code deployment, or an API change from a third-party tool.
How Observability Fits In
The modern data quality stack can be broken down into distinct layers. Each layer serves a specific purpose, and an observability platform provides the oversight needed to make sure they all work together seamlessly.
- Data Collection Layer: This is where data is born—your website's dataLayer, mobile app SDKs, or server-side events. Most data quality problems start right here.
- Data Transportation Layer: Tools like CDPs (Segment, Tealium) or event streaming platforms (Snowplow) act as the highways, routing data from sources to destinations.
- Data Destination Layer: This includes analytics tools (Amplitude), data warehouses (BigQuery, Snowflake), and marketing platforms (Facebook Ads, Google Ads) where data is finally put to use.
- Observability Layer: This is where a tool like Trackingplan lives, monitoring the entire flow. It validates data at the source and confirms its successful delivery to every destination, catching any discrepancies along the way.
By monitoring the entire journey, observability platforms ensure consistency and reliability across the stack. They validate that the data your developers implemented is the same data your marketing team is using for attribution, creating a unified and trustworthy view.
This layered approach is quickly becoming the standard for data-driven companies. Globally, data teams in major markets like the US, UK, and Germany are leveraging lightweight SDKs for installations that take just minutes, integrating with tools like Mixpanel or Snowplow to get alerts on schema mismatches or consent misconfigurations via Teams. Without this kind of vigilance, industry norms show that 15-25% of data can degrade every single month, crippling attribution and growth strategies. As businesses scale their Martech stacks, these numbers confirm that proactive, privacy-first monitoring isn't just an option—it's the backbone for trusted insights and maximized ROI.
For a deeper dive, check out our guide on the different types of data quality monitoring tools available today.
Spreading Data Quality Across Your Organization
Investing in the best data quality monitoring tools is a great start, but technology alone won't get you across the finish line. The most reliable data ecosystems are built on a culture of shared ownership and a collective commitment to getting the data right. This is what makes your data quality efforts stick.
It’s all about turning data quality from a siloed, technical chore into a team sport. When developers, marketers, and analysts all have skin in the game, real collaboration starts to happen. The goal is to create an environment where everyone understands how their work ripples through the entire data pipeline.
Create a Single Source of Truth
The bedrock of any data-aware culture is a centralized tracking plan. Think of this document as the official rulebook for your analytics—it defines every single event, property, and naming convention. It gets rid of ambiguity and becomes the go-to reference for every team.
When a developer needs to ship a new event, they check the plan. When a marketer kicks off a new campaign, they follow its guidelines. This simple act of centralization prevents the "rogue property invasions" and "UTM chaos" that plague so many companies, ensuring everyone is on the same page from day one.
Define Clear Roles and Responsibilities
For people to take ownership, they need to know what they own. Setting up clear roles is essential for a smooth data governance process. This isn’t about playing the blame game; it’s about empowering people to take action.
- Data Stewards: These are folks embedded within business teams (like marketing or product) who are responsible for defining the quality rules for their specific data domains. They know what "good" looks like.
- Data Custodians: Usually developers or engineers, these are the people responsible for the technical heavy lifting—implementing and maintaining the data pipelines and making sure data is captured and moved correctly.
- Data Consumers: This group includes analysts and other business users who depend on the data. Their job is to provide feedback on whether the data is usable and to flag any issues they run into.
This structure ensures someone is accountable at every stage of the data's journey, from the moment it's created to the moment it's used.
Integrate Quality into the Development Lifecycle
The best way to tear down silos is to embed data quality checks right into your development workflow. By integrating automated monitoring into your CI/CD (Continuous Integration/Continuous Deployment) pipeline, you shift quality control "left," catching problems long before they ever make it to production.
Imagine a developer seeing that their code change will break a critical marketing event—before they even merge the pull request. Suddenly, they're an active participant in maintaining data quality. This proactive approach stops fire drills before they start and connects technical work to its real-world business impact.
This shared visibility is where the magic happens. A powerful feedback loop is created when marketers see how their tagging decisions affect analysis and developers understand the business consequences of a broken event. Automated monitoring provides the common ground, giving every team member the power to help build more trustworthy data.
Got Questions About Data Quality Monitoring?
As you start digging into the world of data quality, you're bound to have some questions. It’s a field with its fair share of overlapping terms and nuanced concepts. Let’s clear up a few of the most common ones that pop up.
Data Quality Monitoring vs. Data Observability: What’s the Difference?
It’s easy to get these two tangled up, but they really are two sides of the same coin. The simplest way to think about it is this: data quality is the destination, and data observability is the GPS that gets you there.
Data quality is all about defining what good data means for your business. It’s the set of standards you create—the rules of the road. For instance, a data quality rule might be, "The order_id field must always be populated and never null." It's a clear, simple goal.
Data observability, on the other hand, is the active, real-time process of watching your data pipelines to make sure you’re staying on course. It’s the system that screams, "Hey! An order_id just came through with a null value!" This alert lets you pull over and fix the problem long before it causes a pile-up in your analytics dashboards.
In a nutshell: Data quality is the standard you aim for. Data observability is the suite of tools and practices giving you a constant, live view into your data’s health, making it possible to actually hit that standard.
How Often Should We Run Data Quality Checks?
The right answer here really depends on how fresh your data needs to be. In the old days, running batch checks nightly or even weekly was good enough for many businesses. But today, that approach leaves a massive window open for bad data to sneak in and wreak havoc.
For any business that relies on in-the-moment insights—think e-commerce, marketing analytics, or product teams tracking engagement—the only real answer is continuously.
Modern data quality monitoring isn’t a task you run; it’s a system that’s always on. An automated platform watches your data as it flows, giving you 24/7 coverage. This means you aren’t waiting for a scheduled report to tell you something broke yesterday. You get an alert within minutes of an anomaly, which shrinks the time it takes to spot and solve a problem from hours or days to mere moments.
How Can Monitoring Help with GDPR and CCPA Compliance?
Data quality monitoring is a huge ally in navigating the tricky waters of privacy regulations like GDPR and CCPA. One of the biggest compliance nightmares is accidentally capturing and sending Personally Identifiable Information (PII) to analytics tools where it has no business being.
A solid monitoring platform helps you stay on the right side of the law in two key ways:
- PII Detection: It can automatically scan your data streams for patterns that look like sensitive info—email addresses, phone numbers, credit card details, you name it. If it spots a potential PII leak, it fires off an immediate, high-priority alert. This gives you the power to shut down the data flow and fix the issue before it becomes a major incident.
- Consent Configuration Auditing: Beyond just PII, it can also check that consent flags and privacy settings are being correctly captured and honored throughout your data pipelines. This ensures you’re not accidentally processing data from users who’ve explicitly opted out.
This proactive approach flips the script on privacy compliance. Instead of a stressful, manual audit process after the fact, it becomes an automated, continuous safeguard for your customers' data.
Ready to stop data errors before they impact your revenue? Trackingplan provides a fully automated observability platform that gives you a single source of truth for your analytics. Detect issues in real time, fix them fast, and build unshakable trust in your data. Learn more and get started at https://trackingplan.com.