Discover how data quality monitoring tools safeguard analytics and drive smarter decisions. Learn how to choose and implement the right solution.
Data quality monitoring tools are essentially an automated quality control system for your data. They’re specialized platforms that constantly check, validate, and alert your teams to problems like inaccuracies, inconsistencies, or incomplete information. The goal is simple: make sure the data you use for business decisions is always reliable.
Why Data Quality Monitoring Is No Longer Optional
Imagine trying to navigate a massive container ship using a faulty compass. You could sail for days, convinced you're on the right track, only to find you've wasted a ton of fuel and are hopelessly lost. In business, your analytics data is that compass. When it's flawed, every single decision—from allocating marketing spend to forecasting revenue—is based on the wrong coordinates.
This isn't just some minor inconvenience; it's a huge risk. Bad data has a nasty habit of silently steering organizations toward poor outcomes. It creates a domino effect where one small error in a tracking event can lead to a skewed dashboard. That dashboard then causes a marketing team to double down on a failing campaign. Over time, this erodes the most valuable asset a data team has: trust. When stakeholders can no longer rely on the numbers, the entire analytics function loses its value.
The True Cost of Unreliable Data
The consequences of poor data quality go way beyond simple frustration. They show up as real, tangible business problems that hit the bottom line hard. Without a system to monitor data health, companies often find themselves dealing with:
- Wasted Marketing Budgets: Pouring money into campaigns that look great in reports but are actually driven by broken or incomplete data.
- Inaccurate Revenue Forecasts: Making critical financial plans based on flawed sales figures or user behavior metrics, which inevitably leads to missed targets.
- Loss of Stakeholder Trust: Presenting dashboards and reports that are constantly questioned, undermining the credibility of the analytics and marketing teams.
These issues make it crystal clear why manual spot-checks and reactive fixes just don't cut it anymore. The scale and speed of modern data pipelines demand a proactive, automated approach. You can get a deeper look into how this affects companies by exploring the business risks of poor data quality.
Think of data quality monitoring tools as an essential co-pilot for your data journey. They don't just point out when you're off course; they provide the real-time alerts you need to correct your path before you drift too far from your goals.
This guide will give you a clear roadmap for tackling this challenge. We'll start by understanding the core problem and move all the way to implementing a robust, automated solution. The aim here is to empower every team—from marketing to engineering—with a single source of truth, making sure your business compass is always pointing in the right direction.
What Can Modern Monitoring Tools Actually Do?
Think of a data quality monitoring tool less like a piece of software and more like a high-tech security system for your company's most valuable asset: its data. These platforms go way beyond simple checklists. They offer a suite of interconnected features that work together to shield your entire analytics ecosystem from the costly fallout of bad data. Each capability is built to solve a specific, often painful, problem that your teams deal with every day.
The demand for these tools is exploding for a reason. The global market for data quality solutions hit USD 2.1 billion in 2022 and is expected to grow at a blistering 18.5% each year through 2030. This isn't just hype; it's a direct response to the massive financial damage caused by unreliable information. Studies show that bad data can cost major companies anywhere from 15-25% of their revenue. With regulations like GDPR getting stricter, automated monitoring is no longer a "nice-to-have"—it's a necessity. You can dig into more of the research on the data quality tools market growth on marknteladvisors.com.
H3: Automated Data Discovery
Trying to manage your data stack without automated discovery is like trying to secure a massive warehouse without knowing what’s inside or where anything is. This capability is your always-on inventory scanner, continuously cataloging every single data point, event, and property across your websites and apps.
It automatically builds out a complete map of your data, creating a single source of truth that everyone can rely on. For a digital analyst, this means no more digging through outdated spreadsheets just to figure out what an event is supposed to track. It's all there, discovered and documented on the fly.
The infographic below drives this point home, showing the direct line from bad data to poor decisions and a complete loss of trust.
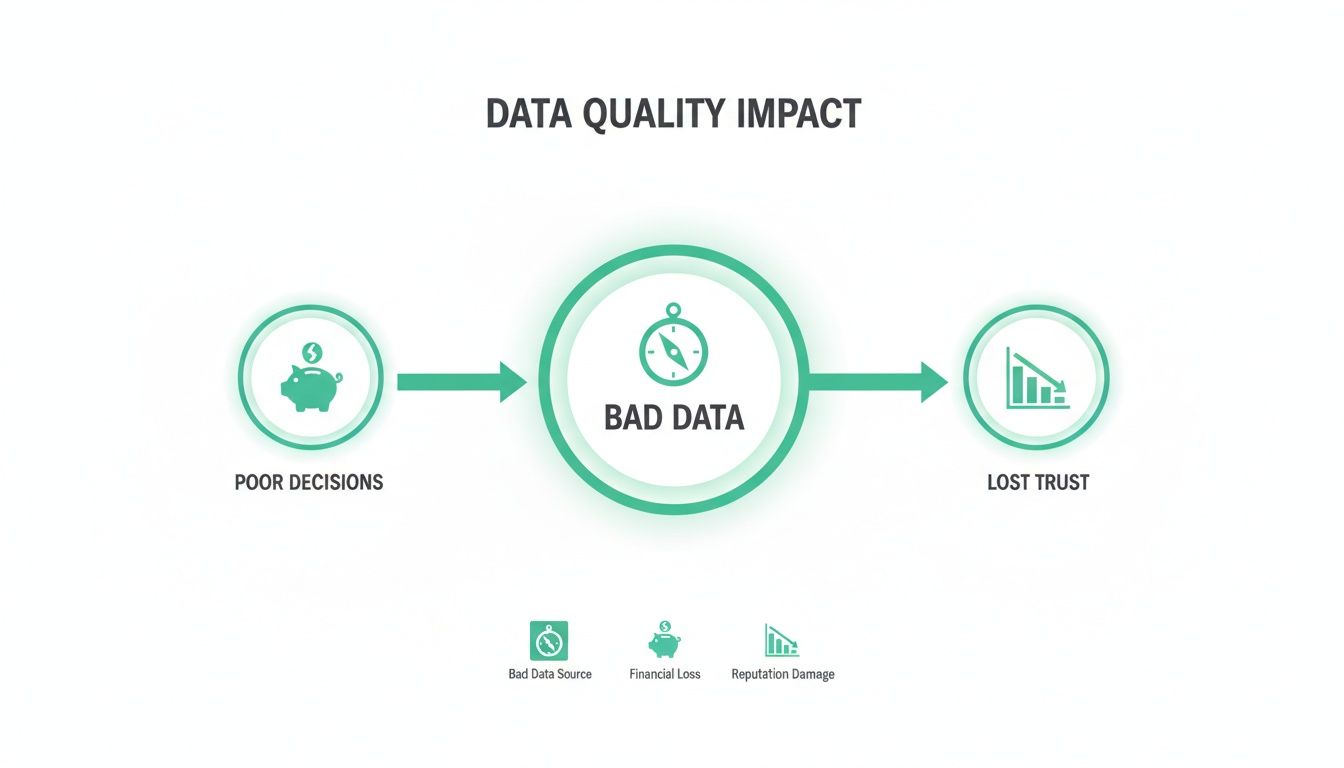
This chain reaction is what every data team wants to avoid. Faulty data doesn't just skew a report; it actively undermines financial outcomes and erodes stakeholder confidence in analytics itself.
H3: Real-Time Anomaly Detection
If data discovery is the inventory system, then anomaly detection is your network of smoke alarms and motion sensors. This feature uses machine learning to learn what "normal" looks like for your data—things like traffic volume, event counts, and property values.
The moment something deviates from that baseline, it triggers an alert. This is absolutely critical for catching problems before they poison your dashboards and lead to terrible decisions.
For example, a marketer might get an alert that the 'purchase' event count has plummeted by 90% in the last hour. That real-time warning lets them pause a high-spend ad campaign instantly, saving thousands of dollars that would have otherwise been wasted on a broken checkout funnel.
This proactive approach completely changes the game. It turns data quality management from a reactive, fire-fighting exercise into a calm, controlled process. It’s the difference between spotting a little smoke and dealing with a four-alarm blaze.
H3: Schema Validation and Consistency Checks
Schema validation is the quality inspector on your data's assembly line. It makes sure every piece of data rolling through your system sticks to the rules you've defined. This includes checking data types, formats, and required properties.
For instance, it verifies that a user_id is always a string, a price is always a number, and a signup_date follows the correct YYYY-MM-DD format. No exceptions.
This is a massive time-saver for developers. Instead of wasting hours debugging a broken report, they can see immediately that a recent app update started sending the price property as a string instead of a number. The tool pinpoints the exact source of the error, slashing resolution time from hours to minutes.
H3: End-to-End Data Lineage
Finally, data lineage gives you the complete travel history for every single data point. Think of it like a GPS tracker that shows you exactly where your data came from, what changes it went through along the way, and where it ended up.
This is absolutely essential for root-cause analysis and for building trust in your numbers. When a stakeholder questions a figure on a dashboard, an analyst with data lineage can trace it all the way back to its source, confidently explaining its entire journey. It connects the dots from a user clicking a button on your website to the final metric in a BI tool, providing a level of transparency and accountability that was previously impossible.
Core Capabilities of Data Quality Monitoring Tools
At their heart, these tools are designed to solve very specific, cross-functional problems. The core features don't just help one team; they create a ripple effect of efficiency and trust across the organization.
By combining these capabilities, modern monitoring platforms provide a comprehensive safety net. They empower both technical and non-technical teams to trust their data and, by extension, the decisions they make based on it.
How to Evaluate and Choose the Right Tool for Your Team
Picking the right data quality monitoring tool can feel overwhelming. You’re bombarded with options, and every single one promises to be the magic bullet for all your data problems. It’s easy to get lost in a sea of feature lists and slick sales pitches.
The real key is to cut through that noise. You need to focus on what actually matters for your team, your specific workflows, and the tech you already have in place. Choosing a tool isn't just about the tech; it's a strategic move that affects how your teams collaborate, how efficient they are, and ultimately, how much everyone trusts the data.
Get it right, and the tool becomes a central hub where marketers, analysts, and engineers can all speak the same language. Get it wrong, and you've just added another layer of friction that creates more problems than it solves. You’re looking for a dependable teammate, not just another piece of software.
Implementation Effort and Time to Value
First things first: how fast can we get this thing up and running and actually see a result? This is the most important question you can ask. The implementation process really sets the stage for your entire relationship with a tool. Some platforms demand months of heavy engineering work, wrestling with complex configurations, and tedious manual setup, pushing any real ROI far into the future.
Modern, effective tools should be the opposite—lightweight and quick to deploy. Look for solutions that you can install in minutes, like adding a single tag to your website or using a simple SDK in your mobile apps. The sooner you can start monitoring, the sooner you can catch those costly issues before they do real damage.
Avoid any tool that forces you to completely rip out and replace your existing processes. The best solutions slot into your workflow, not the other way around. Your team should see real, tangible value—like catching a broken campaign pixel or a critical schema error—within days, not quarters.
Seamless Integration with Your Martech Stack
Your data doesn't live on an island, and your monitoring tool shouldn't either. A platform’s real power comes from how well it plays with the tools your teams are already using every single day. When systems are disjointed, you create data silos and force people to constantly switch between different apps, which is a massive productivity killer.
Before you even think about signing a contract, map out the tool's integration capabilities. Does it connect smoothly with your most important analytics destinations?
- Analytics Platforms: Make sure it has native integrations with the big players like Google Analytics 4 (GA4), Adobe Analytics, Amplitude, and Mixpanel. The tool needs to be able to confirm that the data arriving in these platforms is actually accurate and complete.
- Data Warehouses and CDPs: Look for connections to platforms like Segment, Snowplow, and BigQuery to ensure you have true end-to-end visibility.
- Communication Tools: Real-time alerts are useless if they don't get to the right people, right now. Integrations with Slack, Microsoft Teams, and email aren't just nice-to-haves; they're essential for getting quick, collaborative responses.
A tool that plugs right into your existing stack acts as a unifying layer. It becomes the single source of truth that finally bridges the gap between different departments and the platforms they live in.
Scalability and Performance
As your business grows, so will your data volume—that’s a given. A monitoring tool that runs smoothly with a hundred thousand events a month might completely fall apart when faced with a hundred million. You have to evaluate a tool's ability to scale without taking a performance hit or becoming ridiculously expensive.
Ask vendors tough questions about their architecture. How do they handle massive traffic spikes, like the ones you see on Black Friday or during a big product launch? The platform needs to be built to handle enterprise-level data without slowing down your website or app. The last thing you want is for your user experience to suffer for the sake of data monitoring.
Customizable Alerts and Collaboration Features
Finally, think about how the tool helps your teams work together. Data quality is a team sport, and your chosen platform should make it easy for marketers, analysts, and developers to collaborate. One of the biggest killers of a good data quality initiative is alert fatigue—when teams get so many useless, low-priority notifications that they start tuning out everything, including the important stuff.
A top-tier tool must offer highly customizable alerting. You should be able to define very specific validation rules, set your own thresholds for anomalies, and route alerts to the right channels or people. For instance, a simple UTM parameter error should ping the marketing team's Slack channel, while a critical schema mismatch needs to page the on-call developer immediately. This kind of precision makes sure every alert is relevant and actionable, building a proactive culture of data ownership instead of a reactive one built on firefighting.
Implementing Your Data Quality Monitoring Solution
Jumping into the world of data quality monitoring might seem like a huge project, but modern tools have completely changed the game. Gone are the days of draining manual audits that took weeks, only to be obsolete the moment they were finished. Today's approach is all about speed, automation, and getting value right away.
It’s like the difference between building a custom car from scratch versus driving a high-performance vehicle right off the lot. The old way demanded a massive engineering effort, custom parts, and a long wait. The new way gets you on the road in minutes, with advanced features ready to go from day one. This shift makes comprehensive data observability an achievable goal, not a multi-quarter headache.

Your Initial Setup Walkthrough
Getting started with a modern data quality monitoring tool is surprisingly simple. The whole process is designed to be lightweight, avoiding the heavy lifting that used to define these kinds of projects.
- Install a Lightweight Tag: The first step is often as easy as adding a small code snippet to your website's header or integrating an SDK into your mobile app. This is usually a one-time action that takes just a few minutes.
- Configure Key Integrations: Next, you’ll connect the tool to your most important destinations. This just means pointing it toward your analytics platforms like Google Analytics or Amplitude and setting up alert channels in tools like Slack or Microsoft Teams.
- Establish Your First Rules: Finally, you can start defining what “good” data looks like. You might set up a basic validation rule to ensure a
user_idis always present or create an anomaly alert to flag a sudden drop inpurchaseevents.
This entire setup can often be knocked out in a single afternoon, letting you see data insights almost immediately.
Overcoming Common Implementation Hurdles
While the technical setup is quick, successfully embedding a data quality tool into your organization means navigating a few common challenges. Thinking about these hurdles ahead of time will ensure a smooth rollout and get everyone on board.
The stakes are high. The enterprise data observability software market is projected to hit USD 3.6 billion by 2035. This growth is driven by a critical need; 80% of data engineers spend over a third of their time just debugging pipelines, and bad data is responsible for 23% of analytics failures in ad platforms. For marketers, getting real-time alerts on broken events is non-negotiable for preventing revenue loss. You can uncover more about the trends in the enterprise data observability market on futuremarketinsights.com.
The biggest barrier to implementation is rarely technical. It's almost always organizational—getting teams aligned, defining clear ownership, and setting realistic expectations for what the tool can achieve in the first month.
To get ahead of this, focus on a few key strategies:
- Define Clear Data Ownership: Before you even start, decide which team owns which data domain. For example, marketing is on the hook for campaign UTM parameters, while the product team owns in-app user behavior events. This clarity prevents the finger-pointing game when an alert fires.
- Communicate the "Why": Overcome internal resistance by framing the tool as a win for everyone. Explain how it frees up developers from tedious debugging, gives marketers confidence in their campaign numbers, and provides analysts with reliable data for their reports.
- Set Realistic 30-Day Goals: Don't try to boil the ocean. For the first month, aim for a few specific wins. Your goal could be as simple as "eliminate all UTM formatting errors" or "ensure 100% uptime for our checkout funnel's tracking events." Nailing these initial goals builds momentum and shows immediate value to stakeholders.
Key Data Quality Metrics You Should Be Tracking
Once your data quality monitoring solution is up and running, the real work begins. The focus shifts from setup to measurement. How do you actually know if it’s working? Success isn't just about catching more errors; it's about proving the impact on the business. Tracking the right metrics is how you move from just observing problems to strategically improving your data, giving you the hard evidence you need to show ROI to stakeholders.

This means ditching vanity metrics for essential KPIs that truly signal the health of your data and, by extension, your business. These numbers help you understand not just that a problem happened, but how fast you found it, how quickly you fixed it, and what the real-world consequences were.
Measuring Speed and Responsiveness
Two of the most important metrics you can track are all about speed. They're a direct reflection of how efficient your team is at handling data incidents, turning what used to be a reactive scramble into a structured, measurable response.
Time to Detection (TTD): This is the clock starting the moment a data quality issue appears and stopping the second your team gets an alert. A low TTD is the signature of a truly proactive monitoring system. For example, if a bad code deployment at 2:00 PM breaks your
add_to_cartevent and your tool fires off a Slack alert at 2:05 PM, your TTD is just five minutes.Time to Resolution (TTR): Once an issue is detected, TTR measures how long it takes your team to actually fix it and get accurate data flowing again. A low TTR proves your team can diagnose the root cause and ship a solution fast, minimizing any disruption to the business.
Getting these two numbers down is fundamental. The faster you spot and solve data issues, the less damage they can cause.
Quantifying the Business Impact
Speed is critical, but connecting data quality to the bottom line means understanding how long an issue really affected your operations. This is where data downtime comes into play. It’s the total amount of time your data was wrong, incomplete, or otherwise untrustworthy.
Data downtime is calculated from the moment an issue begins until the moment it is fully resolved. It's the most powerful metric for communicating the business cost of bad data, as it represents a window of time where decisions are based on flawed information.
For an e-commerce company, significant data downtime in the checkout funnel translates directly into lost sales and skewed conversion rates. Cutting this downtime by just a few hours could protect thousands of dollars in revenue. This is exactly why the monitoring tools market, which includes data quality oversight, is exploding—it’s projected to jump from USD 24.5 billion in 2023 to USD 63.7 billion by 2028. This growth is fueled by the need to fix costly problems like tagging errors, which can waste up to 30% of digital ad spend. You can discover more insights about the monitoring tools market on marketsandmarkets.com.
Creating a Holistic View with a Data Quality Score
Tracking individual metrics is great, but trying to report a dozen different numbers to leadership can get messy. A Data Quality Score solves this problem by rolling up multiple metrics—like completeness, accuracy, and validity—into a single, straightforward number.
This composite score gives you an at-a-glance health check of a specific dataset or even your entire data ecosystem. For instance, you might see that your "Marketing Analytics Data" has a quality score of 98%, while "Product Usage Data" is lagging at 85%. Right away, you know where to focus your attention. For those looking to dive deeper, our guide on how to measure data quality offers more detailed strategies for creating these impactful scores. This makes communicating with stakeholders incredibly simple, turning technical details into clear business insights.
Achieving Automated Data Trust Across Your Organization
The whole point of finding data quality issues and putting a solution in place is to get to one crucial goal: achieving automated, organization-wide trust in your data. This isn't about reactive fixes and endless manual audits. It's about building a system where reliability is the default.
Think of an automated platform as the central nervous system for your analytics. It connects every team to a single source of truth and gives them the power to be proactive, not reactive.
Instead of wrestling with outdated, manually maintained tracking plans, a fully automated solution continuously discovers and monitors your entire data setup. This creates an always-up-to-date catalog of your analytics, completely cutting out the guesswork and manual labor that drains your team's time and energy.
Empowering Every Team with a Single Source of Truth
An automated data quality monitoring tool is fantastic at breaking down the silos that always seem to pop up between marketing, analytics, and engineering. By creating one unified view of data health, each team gets specific, actionable advantages that make a real difference in their daily work.
For Digital Analysts: The platform becomes the definitive source of truth. When a dashboard looks off or a metric seems fishy, analysts no longer have to chase down developers or marketers. They get immediate visibility into the data's entire journey, letting them confirm its integrity and build confidence with stakeholders.
For Marketers: Getting real-time alerts on issues like broken UTM parameters or malfunctioning ad pixels is a total game-changer. This stops you from throwing money away on campaigns with faulty tracking, ensuring every dollar is measurable and contributes to an accurate ROI.
For Developers: Automated root-cause analysis is a massive time-saver. Instead of spending hours digging through vague reports of "broken analytics," developers get precise alerts detailing exactly what went wrong, where it happened, and why. It turns a lengthy investigation into a quick fix.
From Monitoring to Proactive Improvement
True data trust isn't just about finding problems; it’s about building a system that prevents them from happening in the first place. For a complete approach, it’s essential to not only monitor but to actively implement strategies to improve data quality. This means establishing clear governance and fostering a culture where everyone feels accountable for data.
An automated platform makes this possible by providing the clear, objective evidence needed to drive real process improvements.
By automating discovery and monitoring, you shift your organization's focus from data validation to value creation. Teams spend less time questioning the numbers and more time using them to drive growth, confident that their decisions are based on a solid foundation.
This proactive stance also tightens up compliance. With automated monitoring for potential PII leaks or consent misconfigurations, you can spot and fix privacy risks before they blow up into serious liabilities. For a deeper look at maintaining this level of oversight, you can learn how to master data observability with Trackingplan's Daily Digests.
Ultimately, this automated approach ensures your data isn't just accurate—it's a reliable, strategic asset that fuels smarter decisions and maximizes business impact across the board.
Got Questions About Data Quality Tools? We Have Answers.
As you start digging into data quality monitoring, a few common questions always pop up. Getting these sorted out early on is key to understanding just how valuable these platforms can be. Let's tackle some of the most frequent ones.
The real goal here isn't just about spotting errors after the fact. It's about getting ahead of the curve with a proactive, complete picture of your data's health from start to finish.
Data Quality vs. Data Observability
People often get tangled up trying to separate data quality from data observability. They’re definitely related, but they’re two sides of the same coin.
Think of data quality as a snapshot in time—it tells you the state of your data right now. It answers questions like, "Is this data accurate? Is it complete?" It’s a static health check.
Data observability, on the other hand, is the live-action movie. It's the dynamic process of watching your systems in real-time to catch anomalies, figure out what went wrong, and trace the problem back to its source. It’s the "how" and "why" behind your data’s condition, letting you manage problems proactively instead of just cleaning up messes.
How Much Engineering Effort Does It Take to Maintain a Tool?
This is a big one. No one wants to saddle their engineering team with a tool that needs constant babysitting. The answer really depends on the kind of solution you choose.
Older, rules-based data quality tools can be a massive time sink. Your team has to manually write, update, and manage every single validation rule. In a complex data environment, that can easily turn into a full-time job.
But modern, automated platforms are built to avoid this headache entirely.
They use features like auto-discovery to map out your data on their own and come with pre-built integrations for tools like Google Analytics and Slack. This approach slashes the maintenance time, freeing up your engineers to actually build products instead of tending to a monitoring tool.
Can These Tools Help with Privacy and Compliance?
With regulations like GDPR and CCPA, this is a critical question. And the answer is a resounding yes.
Modern data quality monitoring tools are your first line of defense in spotting and fixing compliance risks before they blow up. They act as an automated safety net with features like:
- Automated PII Detection: They constantly scan your data streams to find and flag any personally identifiable information that might be getting collected improperly.
- Consent Misconfiguration Alerts: They’ll warn you if user consent signals aren't being captured correctly or passed along to your downstream analytics tools.
These capabilities help you steer clear of expensive fines and, just as importantly, build a foundation of trust with your users.
Ready to stop reacting to data problems and start preventing them? Trackingplan provides a fully automated data observability platform that gives you a single source of truth for your analytics. Discover, monitor, and validate your data in real time without the manual overhead. See how you can achieve complete data trust by visiting https://trackingplan.com.