
TL;DR:
- Verifying Google Analytics ensures that your GA4 property collects accurate data and reports genuine user behavior.
- Using multiple methods like network inspection, Realtime, DebugView, and tag auditing prevents tracking errors from corrupting your data.
Checking Google Analytics means verifying that your GA4 property collects accurate data, fires the right tags, and reports real user behavior on your website. Without that confirmation, every campaign decision you make rests on numbers you cannot trust. This guide covers how to check Google Analytics using four reliable methods: the GA4 Realtime report, DebugView, browser Developer Tools network inspection, and Google Tag Assistant. You will also learn which reports to review weekly and how to spot the tracking errors that silently corrupt your data.
What do you need before checking Google Analytics?
Verification requires the right access and tools before you touch a single report. Missing one of these prerequisites turns a five-minute check into an hour of dead ends.
Access and credentials you need:
- A Google account with at least Viewer access to the GA4 property
- Your GA4 Measurement ID, formatted as G-XXXXXXXXXX, found under Admin > Data Streams > Web Stream Details
- Google Chrome browser, which gives you the most reliable Developer Tools experience
- Google Tag Assistant Chrome extension for tag auditing
- GTM Preview mode access if your site deploys GA4 through Google Tag Manager
Technical tools to have open:
- Chrome DevTools (press F12 or right-click and select “Inspect”), with the Network tab ready
- The GA4 DebugView panel, found under Admin > DebugView in your GA4 property
- An incognito browser window for clean, ad-blocker-free testing
One detail that trips up many analysts: your Measurement ID must match exactly across every implementation point. A single character mismatch sends data to the wrong property, and the Realtime report shows nothing. Confirm the ID in your page source or GTM container before running any other check.
How to check if Google Analytics is working
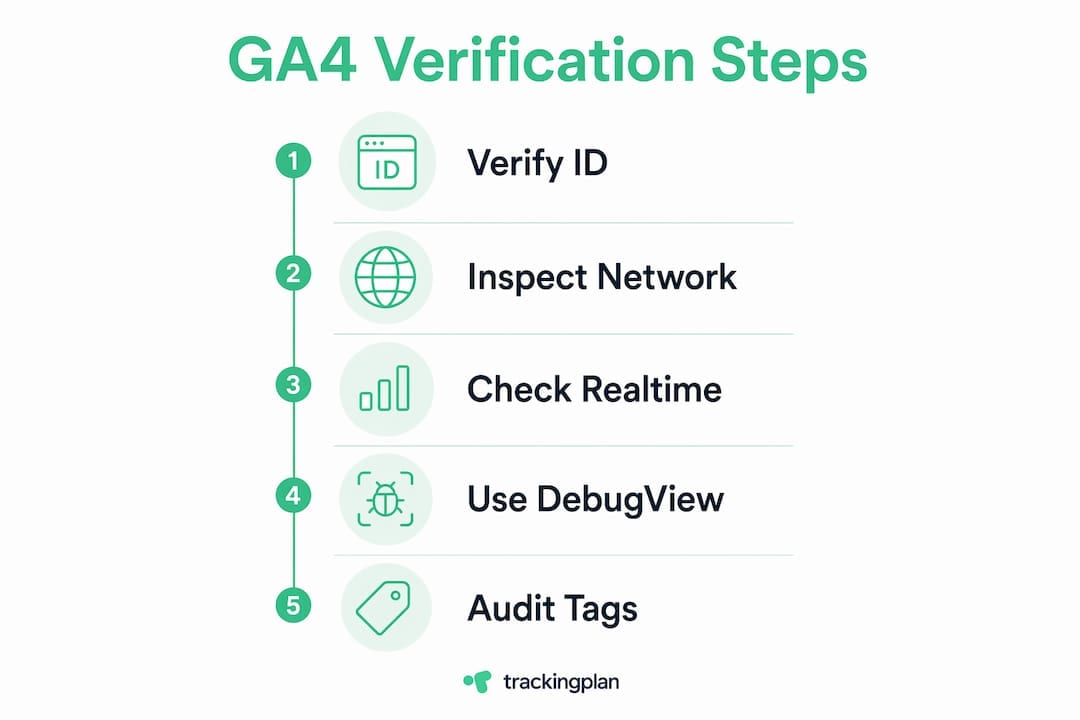
The most reliable approach combines multiple verification methods rather than relying on any single one. Professional auditors prioritize network request inspection over Realtime report checks because Realtime data can occasionally be delayed or filtered and may not represent actual data dispatch.
Step 1: Verify your Measurement ID in the page source
Open your website in Chrome, right-click anywhere, and select “View Page Source.” Press Ctrl+F and search for your Measurement ID (G-XXXXXXXXXX). If it appears once, your tag is present. If it appears twice or more, you have a duplicate tracking problem that needs immediate attention.

Step 2: Inspect network requests in Chrome DevTools
Open DevTools, click the Network tab, and reload your page. Filter requests by typing “/collect” in the search bar. You are looking for a request to “www.google-analytics.com/g/collect” with a status code of 204. A 204 status confirms your browser dispatched data to Google’s servers. This technique works for both direct GA4 implementations and GTM deployments.
Step 3: Confirm live data in the GA4 Realtime report
Go to your GA4 property and click Reports > Realtime. Visit your website in a separate tab. Your session should appear within 5–10 seconds. If nothing appears after 30 seconds, check your Measurement ID, disable any ad blockers, or switch to an incognito window to rule out browser extension interference.
Step 4: Use GA4 DebugView for event-level confirmation
DebugView shows every fired event and its parameters in real time, without waiting for standard data processing delays. GA4 DebugView is the best tool for confirming custom events, ecommerce data, and parameter accuracy. To activate it, install the GA4 Debugger Chrome extension or add “debug_mode: true” to your GA4 configuration tag in GTM.
Step 5: Audit tag firing with Google Tag Assistant
Open Tag Assistant in Chrome, click “Start Recording,” and navigate through your site. Tag Assistant shows which tags fired, in what order, and whether any errors occurred. This step is especially useful when you suspect a trigger condition is preventing a tag from firing.
Pro Tip: Run all five steps in sequence on a new page visit. The network inspection catches dispatch failures, DebugView catches parameter errors, and Tag Assistant catches trigger logic problems. No single method catches everything.
What common errors should you look for in GA4?
Most data quality problems fall into a small number of categories. Knowing what to look for cuts your diagnosis time significantly.
Duplicate tracking is the most damaging error. Duplicate tags inflate session and conversion counts and corrupt attribution data. Detect duplicates by searching your page source for multiple instances of your Measurement ID or by watching for multiple “/g/collect” requests firing on a single page load. Fix duplicates immediately.
No data in Realtime or DebugView usually points to one of three causes: the wrong Measurement ID, an ad blocker or privacy extension blocking GA4 requests, or a misconfigured trigger in GTM. Testing in incognito mode isolates browser extension interference quickly.
Missing or misfiring events often trace back to Enhanced Measurement settings. Check Admin > Data Streams > Enhanced Measurement and confirm that the interactions you expect (scroll depth, outbound clicks, video engagement) are toggled on. Configuring Enhanced Measurement early in your data stream setup captures user interactions without requiring custom event tags for every action.
Common errors to audit on every implementation:
- Measurement ID mismatch between GTM and the GA4 property
- GA4 tag firing on every GTM container load instead of only on page views
- Custom event parameters using reserved GA4 names, which GA4 silently rejects
- Conversion events (Key Events) not marked in Admin > Events
- Filters in Data Settings excluding traffic you actually want to measure
Pro Tip: Use GTM Preview mode alongside DebugView at the same time. GTM Preview shows you the trigger and tag firing sequence; DebugView shows you what GA4 actually received. The gap between the two reveals exactly where data goes missing.
How to use GA4 reports to monitor website performance
Understanding GA4 reports is where verification work pays off. Once you confirm your data is clean, you can read it with confidence and act on it.
Beginners should focus on four foundational GA4 report categories: Acquisition, Engagement, Conversions (Key Events), and Realtime. These four categories drive the majority of marketing decisions without requiring advanced configuration. Trying to master every GA4 metric at once slows you down. Start with these four and add complexity as your questions grow.
What each report category tells you:
- Acquisition: Where your traffic comes from. Use Traffic Acquisition to compare organic, paid, direct, and referral channels. This report is your first stop after launching a campaign.
- Engagement: What users do after they arrive. Average engagement time, engaged sessions per user, and top pages by views show whether your content holds attention.
- Conversions (Key Events): Which actions matter most. Any event you mark as a Key Event in GA4 Admin appears here. Track form submissions, purchases, and sign-ups.
- Realtime: What is happening right now. Use this during campaign launches or after publishing new content to confirm traffic is arriving and behaving as expected.
For most websites, reviewing these four reports once a week for 15–30 minutes gives you enough data to make informed decisions without drowning in numbers. That cadence works well unless you are running an active paid campaign, in which case daily Realtime and Acquisition checks are worth the extra time.
The Reports tab provides fixed dashboards for routine weekly checks. The Explore tab is for custom analysis: pivot tables, funnel exploration, path analysis, and user segment comparisons. Analysts should learn the Explore tab early because it surfaces insights that standard reports cannot show. Connecting Google Search Console to your GA4 property adds organic keyword data directly inside the platform, which makes SEO monitoring significantly more useful. Understanding website success metrics alongside GA4 reports gives you a fuller picture of what the numbers actually mean for your business.
Key Takeaways
Accurate GA4 data requires multi-method verification, a weekly review of four core report categories, and immediate correction of duplicate tags or Measurement ID mismatches.
| Point | Details |
|---|---|
| Verify before you analyze | Confirm your Measurement ID, network requests, and Realtime data before trusting any report. |
| Use all five verification methods | Network inspection, Realtime, DebugView, Tag Assistant, and page source checks each catch different errors. |
| Fix duplicates immediately | Duplicate Measurement IDs inflate sessions and conversions, corrupting attribution data across all reports. |
| Review four reports weekly | Acquisition, Engagement, Conversions, and Realtime cover most marketing decisions in 15–30 minutes. |
| Use Explore for deeper analysis | The Explore tab unlocks funnel analysis and segmentation that standard dashboards cannot provide. |
Why I always verify GA4 before reading a single report
The single most expensive mistake I see digital marketers make is skipping verification and going straight to the reports. The numbers look plausible. The charts go up and to the right. And then three months later, someone discovers a duplicate tag that has been doubling conversion counts since the site redesign.
My rule is simple: never trust a GA4 property you have not personally verified. The network inspection method is the one I run first, every time, because it confirms actual data dispatch rather than just tag presence. A tag can fire in GTM Preview and still fail to send data if the Measurement ID is wrong or a Content Security Policy blocks the request. The Realtime report alone would not catch that.
The verification workflow I recommend takes about 20 minutes the first time and about five minutes on repeat visits. Run it after every site deployment, every GTM container publish, and every time someone else touches the analytics configuration. Most data anomalies trace back to duplicate tags or GTM misconfigurations, and those happen most often right after a “small” change that nobody thought would affect tracking.
For report reading, the advice I give every analyst I work with is to resist the GA4 interface’s tendency to show you everything at once. Start with the four core GA4 categories and build a weekly rhythm before you touch the Explore tab. Once that rhythm is solid, the Explore tab becomes genuinely powerful rather than overwhelming. The analysts who get the most value from GA4 are not the ones who know every feature. They are the ones who check their data quality first and read their reports on a consistent schedule.
— David
Trackingplan keeps your GA4 data reliable automatically
Manual verification catches problems after they happen. Trackingplan catches them as they occur, before bad data reaches your reports.
Trackingplan’s AI-assisted debugger monitors your GA4 implementation continuously, alerting your team via Slack, email, or Microsoft Teams the moment a tag misfires, a Measurement ID breaks, or an event stops sending data. For teams managing multiple sites or frequent deployments, that real-time alerting replaces hours of manual spot-checking each week. Trackingplan also runs automated audits across your full digital analytics stack, surfacing schema mismatches, duplicate tracking, and missing conversions without requiring you to open DevTools. If you want clean GA4 data without building a manual verification routine from scratch, Trackingplan is built for exactly that.
FAQ
How do I check if Google Analytics is installed correctly?
Search your page source for your GA4 Measurement ID (G-XXXXXXXXXX) and confirm a “/g/collect” network request with status 204 fires in Chrome DevTools. Then verify a session appears in the GA4 Realtime report within 5–10 seconds of visiting your site.
Why is no data showing in my GA4 Realtime report?
The most common causes are a Measurement ID mismatch, an ad blocker or browser extension blocking GA4 requests, or a misconfigured GTM trigger. Test in an incognito window first to rule out browser extension interference.
What is GA4 DebugView and when should I use it?
DebugView is a real-time event log inside GA4 Admin that shows every event and parameter your site sends, without standard processing delays. Use it when verifying custom events, ecommerce tracking, or any implementation where parameter accuracy matters.
How often should I check my Google Analytics reports?
For most websites, a weekly review of 15–30 minutes covering Traffic Acquisition, Engagement, Conversions, and Realtime is sufficient. Increase to daily checks during active paid campaigns or major site launches.
What causes duplicate tracking in GA4?
Duplicate tracking occurs when the same Measurement ID fires more than once per page load, usually because GA4 is implemented both directly in the page code and through GTM simultaneously. Detect it by searching your page source for multiple instances of your Measurement ID or watching for repeated “/g/collect” requests in DevTools.