
TL;DR:
- Traffic spikes can be caused by algorithm updates, marketing efforts, or false artifacts from tracking errors. Proper diagnosis involves segmenting data, verifying infrastructure, and reviewing external factors like news or competitor activity. Analyzing traffic anomalies with multiple data streams ensures accurate insights and timely responses.
A sudden surge in website traffic should feel like good news. Often, it’s not that simple. Traffic spike causes explained properly require you to look well beyond the obvious triggers. A spike could signal a viral campaign win, a botnet attack, a broken analytics tag, or a Google algorithm shift that reshuffled rankings overnight. Most teams celebrate the number going up without asking whether the data is real, the users are valuable, or the infrastructure is quietly failing. This guide breaks down every major cause category so you can diagnose accurately and respond with confidence.
Table of Contents
- Key Takeaways
- Traffic spike causes explained: marketing and SEO drivers
- Technical factors that create fake or misleading spikes
- Infrastructure failures that spikes expose
- External and environmental influences on traffic patterns
- My honest take on investigating traffic spikes
- How Trackingplan helps you decode traffic anomalies
- FAQ
Key Takeaways
| Point | Details |
|---|---|
| Spikes aren’t always real | False traffic spikes from bot traffic or broken tracking tags require verification before drawing conclusions. |
| Algorithm updates drive sustained shifts | Major updates like the March 2026 Core Update affected 40-60% of sites, making algorithm timelines a key diagnostic layer. |
| Infrastructure fails non-linearly | Database connection pool exhaustion and memory leaks cause disproportionate damage during spikes, not just slower load times. |
| Segmentation reveals the truth | Breaking down traffic by source, device, and page exposes whether a spike is genuine or a tracking artifact. |
| External context reshuffles intent | News events, competitor activity, and hybrid work patterns shift user behavior in ways that standard analytics rarely surface automatically. |
Traffic spike causes explained: marketing and SEO drivers
The most straightforward traffic spikes come from things your team did on purpose. A product launch email goes out, a social post goes viral, or a paid campaign gets a budget increase on a Monday morning. These are easy to correlate. The more interesting and frequently misunderstood category involves search engine changes that happen without any action on your part.
How algorithm updates create sudden visibility shifts
The March 2026 Core Update reached a volatility score of 8.7 out of 10 and simultaneously affected between 40 and 60 percent of websites. That kind of ranking reshuffling can double your organic traffic overnight if competitors lose ground, or cut it in half if your site falls. Neither outcome is something you earned or lost through recent content decisions. It’s a systemic shift.

Google’s May 2026 AI-driven update moved ranking priorities toward trustworthiness and contextual relevance over keyword matching. Sites with strong authoritative citation patterns and multi-modal content saw gains. Sites that relied on high-volume, low-depth content saw unexplained drops paired with spikes on different pages. When you’re analyzing traffic spikes and you can’t tie the surge to a campaign, check whether an algorithm update date aligns with the change. You can track algorithm impacts using third-party ranking volatility tools alongside your analytics.
Marketing-driven vs. SEO-driven spikes
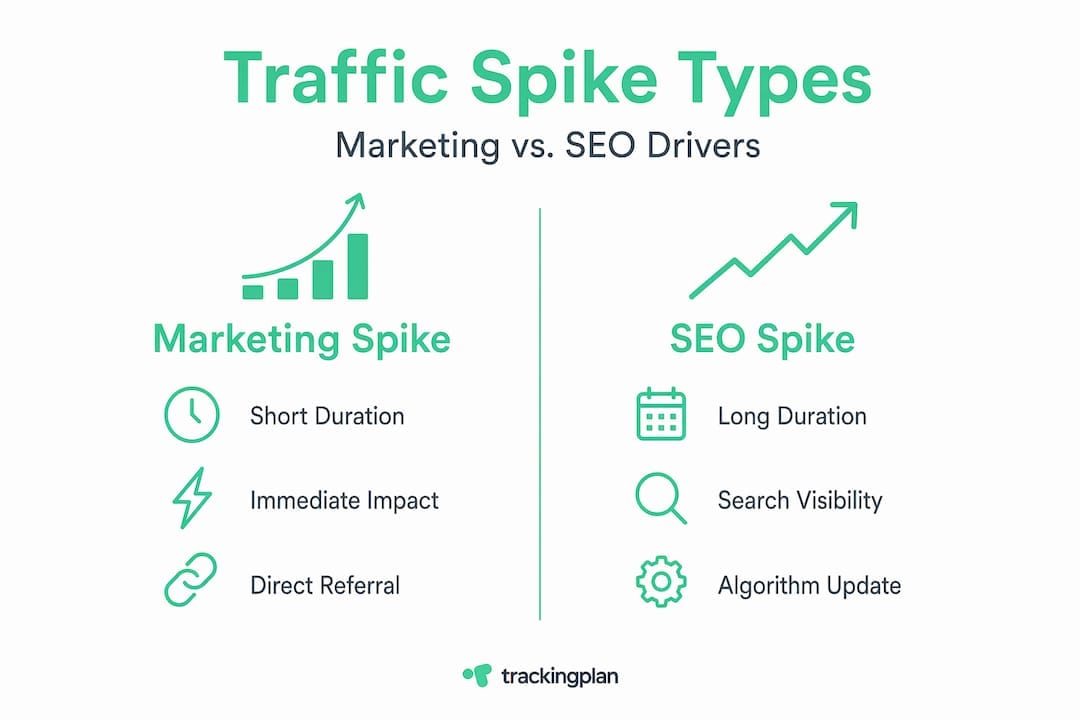
These two spike types behave differently, and recognizing the difference saves hours of wasted investigation.
| Characteristic | Marketing-driven spike | SEO-driven spike |
|---|---|---|
| Duration | Hours to days | Weeks to months |
| Traffic source | Direct, email, paid, social | Organic search |
| Referral path | Identifiable campaign UTMs | Keyword ranking changes |
| Bounce rate | Often higher (less intent alignment) | Lower when content matches intent |
| Reproducibility | Repeatable with same spend | Harder to replicate on demand |
| Leading indicator | Campaign launch date | Algorithm update or competitor drop |
Google’s introduction of AI Overviews and expanded featured snippets adds another variable. A page that earns a featured snippet can see a short-term click-through surge followed by a long-term plateau or decline. Users get their answer in the search results and don’t visit at all. Standard analytics won’t tell you that. You need to compare impressions and clicks in Google Search Console side by side to spot the divergence.
Seasonal promotions and media coverage belong in a separate diagnostic bucket. A mention in a major publication or a trending social moment creates a spike that looks organic because it often arrives through direct or referral channels. The duration is almost always under 48 hours unless the story gets picked up repeatedly.
Pro Tip: Keep a running log of algorithm update dates from sources like Google’s official announcements. When a traffic event occurs and you can’t explain it through campaigns or content changes, this log becomes your fastest diagnostic tool.
Technical factors that create fake or misleading spikes
Not every traffic spike is real. That statement deserves to land fully before you move on. A significant portion of the unusual traffic patterns that analysts investigate are artifacts of broken tracking, misconfigured analytics setups, or non-human traffic flooding your data layer.
Here’s what you should check systematically before attributing any spike to a real user behavior change:
- Broken or duplicated tags. A tag management system update that fires a pageview tag twice inflates session counts instantly. The spike looks real in your dashboard but reflects zero change in actual visits. Segmenting traffic by source and device is the fastest way to spot this because a duplication error usually affects all channels proportionally.
- Ghost spam and referral spam. Certain bots generate fake referral sessions that never actually visit your site. They hit your analytics endpoint directly. These appear as unfamiliar domains with perfect 0-second session times and 100 percent bounce rates.
- Misconfigured filters or view settings. A removed IP exclusion filter causes internal traffic to flood your reports. An incorrectly applied hostname filter can cross-pollinate data between separate properties.
- Sampling errors in high-volume reports. At sufficient scale, analytics platforms sample data rather than process every hit. Depending on how reports are configured, the sampled result can deviate significantly from reality.
- Bot traffic and DDoS-related volume surges. DDoS attacks start as sudden volume anomalies that are recognizable to network monitoring systems before they reach your application layer. At the analytics level, they appear as massive spikes in sessions with unusually uniform behavior patterns. Network anomaly detection systems typically flag a 5x increase over baseline as a threshold for potential attack activity.
Pro Tip: Before celebrating or panicking over any spike, spend five minutes in your analytics platform segmenting the traffic. Filter by new versus returning users, check session duration distributions, and look at the bounce rate on the spiking pages. Real user spikes have recognizable behavioral signatures. Bot traffic and tracking errors almost always look sterile by comparison.
Analytics-driven investigations benefit from treating traffic fluctuations within 10 to 15 percent as noise rather than signal. Year-over-year comparisons remove seasonality from the picture and let you focus investigation energy on shifts that genuinely warrant it. Trackingplan’s root cause analytics guide walks through this diagnostic framework in practical detail.
Infrastructure failures that spikes expose
Traffic spikes don’t create infrastructure problems. They reveal ones that already exist. Most systems are sized for average load, and the gap between average and peak load is where failures hide.
The failure modes follow a predictable but underappreciated pattern:
-
Database connection pool exhaustion. Your database is configured to handle a set number of concurrent connections, sized for typical traffic. When a spike arrives, connection pool exhaustion degrades response times exponentially, not linearly. The 200th concurrent connection doesn’t just wait a little longer. It often fails entirely, triggering cascading errors across dependent application layers.
-
Memory leak amplification. A memory leak that costs 50MB per hour under normal load can consume 500MB within minutes during a spike. The garbage collection system gets overwhelmed trying to free memory, creating storms of processing overhead that freeze threads and spike latency for everyone on the site simultaneously.
-
Cache stampedes. When a cache expires and thousands of concurrent requests all attempt to regenerate the same resource at the same time, the database gets hammered with identical queries. This is a well-known failure pattern that efficient cache warming strategies prevent, but many teams discover it only when a spike triggers it for the first time.
-
Misconfigured auto-scaling. Cloud auto-scaling sounds like the solution to spike-induced failures. But if scaling triggers are set too conservatively or the startup time for new instances exceeds the spike’s initial burst, performance degrades anyway during the warm-up window. Auto-scaling makes systems more resilient at sustained load. It doesn’t always protect against the first 90 seconds of a sudden burst.
-
Realistic load testing gaps. Most load testing simulates gradual traffic ramp-ups. Real spikes are bursts. Testing with burst patterns rather than gradual increases is the only way to surface failures like queue explosions and cache stampedes before they affect real users.
Pro Tip: Track Core Web Vitals and server response times during traffic surges alongside your session data. A spike that arrives with degraded performance metrics indicates infrastructure strain. A spike with stable performance metrics and clean user behavior is worth celebrating.
The practical monitoring metrics that matter during a spike are Time to First Byte, database query latency, error rate by endpoint, and memory utilization trends. If all four stay within normal ranges during the surge, the spike is healthy. If even one degrades, you have a problem worth finding before the next spike.
External and environmental influences on traffic patterns
Some of the most confusing traffic surges have nothing to do with your content, your campaigns, or your infrastructure. They come from outside forces that shift user behavior in ways your attribution models were never designed to capture.
-
Viral news coverage and social media mentions. A brand mention in a high-circulation newsletter or a tweet from an account with 500,000 followers creates a spike that arrives with no campaign UTMs and no paid referral source. It shows up as direct or organic traffic. Without a social listening layer running in parallel with your analytics, you’ll never connect the cause to the effect.
-
Competitor disruption. When a competitor goes down, launches a controversial product, or gets negative press, their audience starts searching for alternatives. That search intent shift can temporarily boost your rankings on comparison and category keywords and generate a spike that looks organic. It’s temporary, usually 48 to 72 hours, but it’s real traffic with real conversion potential if you recognize it in time.
-
Hybrid work and shifting behavioral patterns. Hybrid work has fundamentally changed peak traffic timing. Traditional daily peak patterns, built around 9-to-5 commuting behaviors, no longer apply the way they did. Traffic is now spread across more hours and more days, which means historical hourly benchmarks can misclassify distributed volume increases as spikes when they’re actually flattened patterns.
-
Seasonality versus true anomalies. Seasonality is predictable. True anomalies are not. The problem is they can look identical in a 30-day analytics view. Year-over-year comparisons remove seasonal variation from the picture. If a spike in November looks massive compared to October but matches last November exactly, it’s seasonality. If it exceeds last November by 40 percent without a campaign explanation, that’s an anomaly worth investigating.
-
Search result feature changes. Google regularly tests and rolls out new search features including shopping carousels, People Also Ask expansions, and AI-generated answer formats. Each change shifts which pages get clicks and which get impressions without clicks. A site can see a real increase in impressions alongside a real decrease in clicks, which shows up in analytics as a traffic drop. Understanding this dynamic is part of analyzing traffic spikes in the current search environment.
My honest take on investigating traffic spikes
I’ve reviewed how enough teams respond to traffic spikes to spot the consistent failure pattern. The instinct is to look at the headline number, see it went up, and attribute it to whatever the team did last. That’s not analysis. That’s confirmation bias with a dashboard.
The spikes that most often get mishandled are the ones with mixed signals. Traffic went up. But bounce rate also went up. Session duration dropped. Conversion rate fell. That combination usually means the traffic is real but unqualified, or it means a tracking change inflated the session count. Teams that skip the segmentation step and brief leadership on a “traffic win” create problems when the numbers revert and nobody can explain why.
What I find consistently underused is the combination of analytics data with network-level monitoring and algorithm update intelligence. Running these three data streams in parallel closes most of the diagnostic gaps. When analytics shows a spike, network monitoring tells you whether it’s accompanied by suspicious volume patterns. Algorithm update logs tell you whether rankings shifted. And if none of those explain it, you look at your tracking implementation.
The common analytics issues that distort spike data in 2026 are increasingly tied to AI-influenced search changes and broken attribution chains. Platforms like Trackingplan exist specifically to close this gap. But the mindset shift matters more than the tool. Treat every spike as a question, not an answer. The investigation is the work.
— David
How Trackingplan helps you decode traffic anomalies
Traffic spike analytics only delivers value when the underlying data is trustworthy. If your tags are misfiring, your filters are wrong, or your attribution is broken, every spike investigation starts on shaky ground.
Trackingplan’s web tracking monitoring detects broken pixels, duplicate event fires, schema mismatches, and campaign misconfigurations in real time, across your website, app, and server-side environments. When a spike arrives, you’ll know within minutes whether the data reflects real users or a tracking artifact. The AI-assisted debugger surfaces root causes without requiring manual tag audits, saving your team hours of guesswork on every traffic anomaly you investigate.
For teams that want to maintain digital analytics data quality at scale, Trackingplan connects directly with your analytics stack and sends alerts via Slack, email, or Teams the moment something breaks. Fewer false spikes. Faster diagnosis. Better decisions on the data that actually reflects your audience.
FAQ
What are the most common causes of a sudden traffic spike?
Traffic spikes most commonly result from marketing campaigns, SEO algorithm updates, viral content or news mentions, bot traffic, and tracking errors. Distinguishing between these requires segmenting traffic by source, checking campaign timelines, and verifying your analytics implementation.
How do I know if a traffic spike is real or a tracking error?
Check bounce rate, session duration, and conversion rate alongside the spike. Real user spikes show recognizable behavioral patterns, while tracking errors like duplicate tags or misconfigured filters typically inflate session counts without affecting behavior metrics. Segmenting by source and device exposes most false spikes quickly.
Can a traffic spike damage my website?
Yes. Database connection pools and memory systems sized for average load fail non-linearly under sudden burst traffic, causing cascading errors and degraded performance. Monitoring server response times and error rates during a spike tells you whether your infrastructure is holding.
How do algorithm updates relate to traffic spikes?
Major updates like the March 2026 Core Update can affect 40 to 60 percent of websites simultaneously, generating sudden shifts in organic traffic for sites that didn’t change their content at all. Tracking algorithm update dates alongside traffic changes is a reliable way to identify this as the cause.
What is the best way to analyze a traffic spike?
Start with year-over-year comparisons to remove seasonal noise, then segment by source, device, and page. Cross-reference campaign timelines, algorithm update dates, and your tracking implementation health. Analyzing website traffic with this three-layer approach closes most diagnostic gaps faster than any single-source investigation.