Defining what's a good click-through rate is tricky. Our guide breaks down CTR benchmarks by channel and industry to help you set realistic, data-driven goals.
Every marketer has asked it: "what's a good click-through rate?"
While you might hear numbers like 3.17% thrown around as the average for Google Search Ads, the truth is, a "good" CTR isn't a single number. It's a moving target that shifts dramatically depending on your industry, the marketing channel you're using, and what you're trying to achieve with your campaign.
Decoding Click-Through Rate
Click-Through Rate, or CTR, is one of the most foundational metrics in all of digital marketing. At its core, it simply measures the percentage of people who see your content—whether that’s a search ad, a social media post, or an email—and are interested enough to click on it.
Think of it this way: your content is a billboard on a busy highway. The number of cars that drive past is your impressions. The number of drivers who actually take the exit to visit your store is your clicks. CTR tells you exactly how effective your billboard is at grabbing attention and convincing people to act.
This visual perfectly illustrates the relationship between clicks, impressions, and the CTR that connects them.
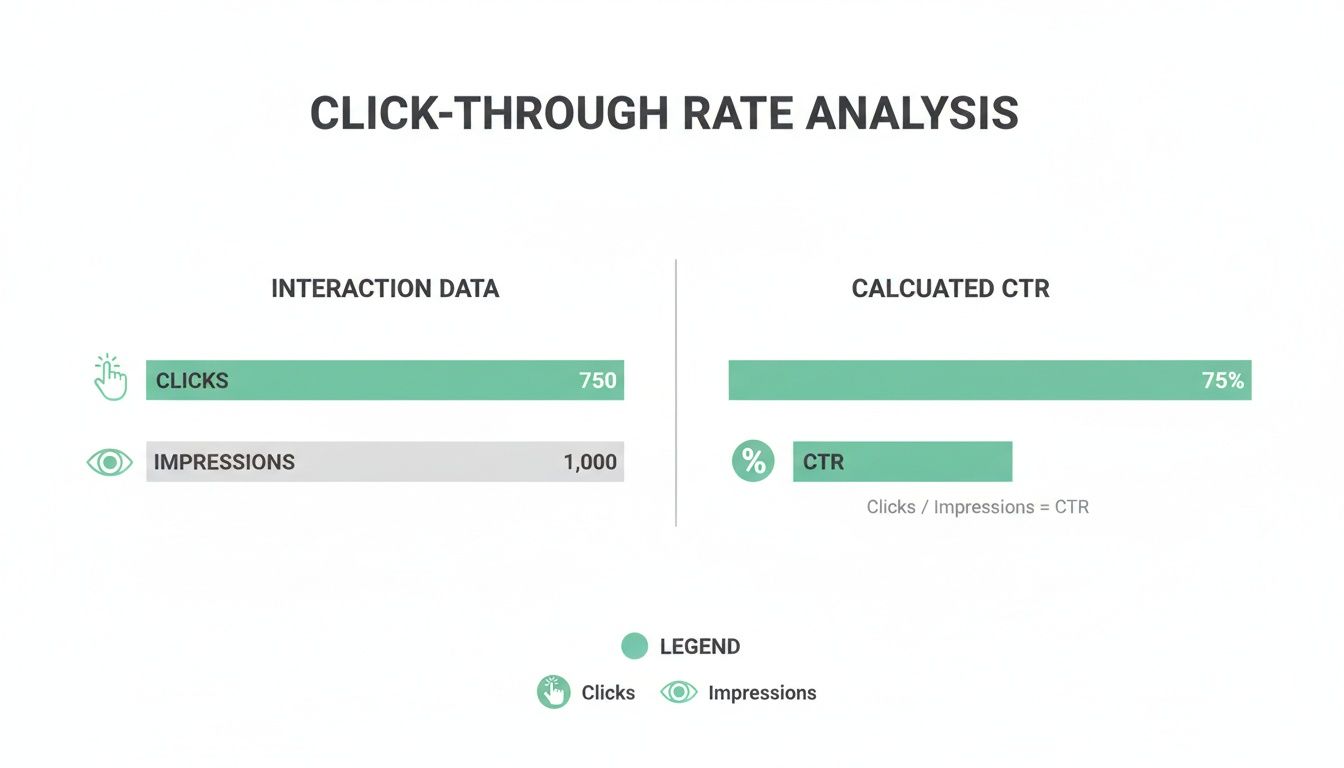
As you can see, CTR is a direct result of dividing your clicks by your impressions. It’s a simple but powerful measure of engagement.
The Basic Formula for CTR
Calculating CTR is refreshingly straightforward. You just divide the total number of clicks your content gets by the total number of times it was shown (impressions), then multiply that by 100 to express it as a percentage.
(Total Clicks ÷ Total Impressions) x 100 = Click-Through Rate (%)
For instance, if your Google Ad was shown 10,000 times and got 300 clicks, your CTR would be 3%. This calculation is the ultimate litmus test for how relevant and compelling your message is. A higher CTR usually means your ad copy, creative, and targeting are hitting the mark with your audience.
If you’re diving into engagement metrics, it's also worth understanding the subtle differences between click rate vs. click-through rate.
Average CTR Benchmarks at a Glance
To give you a starting point, here's a rough look at what typical CTRs look like across different channels. Keep in mind these are just ballpark figures—your own results will depend on dozens of factors we'll get into later.
These benchmarks help set expectations, but the real goal is to improve your own CTR over time, not just to beat an industry average.
Why CTR Varies Across Marketing Channels

If you’ve ever celebrated a 3% CTR on a Google Search campaign but felt a 1% CTR on a Facebook ad was a solid win, you’re not alone. It can feel confusing, but the answer boils down to one critical factor: user intent.
Think of it like this: you can cast a wide net in the open ocean or drop a line in a stocked pond where you know the fish are hungry. Both are valid fishing strategies, but you'd expect wildly different results. Each marketing channel is its own unique environment, and understanding the mindset of the audience there is the key to setting realistic benchmarks.
Trying to apply one universal "good" CTR across all your campaigns is like comparing a race car's track time to a bulldozer's efficiency on a construction site. They're built for completely different jobs.
The Power of Active Search Intent
Google Search Ads are the digital equivalent of a customer walking into your store and asking for a specific item. They are actively looking for something, and your ad pops up at the exact moment of need. This high-intent environment is why search ads almost always have the highest CTRs.
When someone types "best running shoes for flat feet," they aren't just browsing—they're on a mission. If your ad speaks directly to that problem, the click feels like a natural next step. You’re not interrupting their day; you're helping them solve a problem.
This is where relevance shines. A strong CTR on search is a direct signal that your ad is a perfect match for the user's query.
Passive Engagement on Display and Social Media
Now, let's flip the script and look at Display and Social Media ads. Here, users are in a totally different state of mind. They're scrolling through photos from friends, reading articles, or watching videos. Your ad is an interruption, much like a commercial during a TV show.
Because their primary goal isn't to shop or research, the bar for earning a click is much, much higher. Your creative and copy have to be compelling enough to pull their attention away from what they were already doing.
For this reason, you can't compare channels apples-to-apples. The context in which a user sees an ad fundamentally changes the definition of a "good" click-through rate for that platform.
To put this in perspective, Google Search Ads see an average CTR of 3.17% across all industries. In stark contrast, Google Display Ads average just 0.46%—that's 6.8 times lower. The gap is massive, and it's all driven by intent. You can dig into more benchmarks and discover additional insights about Google Ads performance.
CTR Benchmarks by Advertising Platform and Format
The difference in performance isn't just between search and display; it varies across every platform and even ad format. This table breaks down how user intent shapes the average CTR you can expect.
As you can see, the platforms where users are actively searching for something consistently outperform those where users are passively consuming content. It's a clear illustration of why context is everything.
Context Is King on Every Platform
Even within the same family of channels, like social media, context and format are critical. An ad on LinkedIn, where users are in a professional headspace, will perform differently than a visually-driven ad on Instagram.
To set yourself up for success, you need to think about the unique environment of each channel:
- Google Search: Your job is to nail keyword relevance and write ad copy that directly answers the searcher's question. Intent is high, so your CTR should be, too.
- Display Network: Focus on eye-catching visuals and sharp audience targeting. The goal here is often brand awareness, so even a lower CTR can be a win.
- Social Media: Create content that feels native to the platform. Use engaging formats like video or carousels and speak the language of your target audience.
Once you understand the "why" behind these performance gaps, you can move beyond generic benchmarks. This lets you evaluate each campaign on its own terms, leading to smarter optimizations and far more meaningful reports.
How Your Industry Shapes CTR Benchmarks
Just like a conversation shifts from a casual coffee chat to a formal boardroom meeting, what counts as a “good” click-through rate changes dramatically from one industry to the next. The channel you're on sets the stage, but your industry writes the script. It's the reason an ad for a new dating app can pull in a 6.05% CTR, while a campaign for B2B software might celebrate a 2.41% CTR.
Getting this context right is everything. Without it, you're just measuring your campaign against a generic, irrelevant average, which is a fast track to misguided strategies and unrealistic goals.
The real difference comes down to the customer's mindset and what you're selling. Industries that tap into powerful emotions, urgent needs, or personal desires—think dating, travel, or cars—tend to get much higher engagement. The click is often impulsive, driven by a spark of curiosity or a jolt of excitement.
On the other hand, you have industries with long, complex sales cycles, like B2B services or high-tech manufacturing, which naturally see lower CTRs. The decision to buy isn't made in a moment; it's a rational process involving multiple people, tons of research, and a serious financial commitment. A click is just one small step on a much longer path.
High-Urgency vs. High-Consideration Industries
Think about the difference between buying a concert ticket and buying enterprise software. One is an emotional, time-sensitive purchase that you jump on. The other requires careful thought and deliberation. This dynamic directly shapes how people interact with your ads.
High-Urgency/Emotional Industries: These are sectors like Dating & Personals (6.05% CTR) or Auto (4.00% CTR), which often rely on eye-catching visuals and emotional hooks. The call-to-action is simple and the payoff feels immediate, which makes clicking almost second nature.
High-Consideration/Rational Industries: In fields like Technology (2.09% CTR) or B2B (2.41% CTR), you have to work harder to earn that click. Users are looking for hard data, case studies, and proof of ROI. Your ads need to build trust and scream authority, making the click a much more calculated decision.
Exploring the Nuances in Performance
You simply can’t judge a "good" click-through rate in a vacuum. Take the projected $1.04 trillion global ad market for 2026. Display advertising has one of the lowest benchmarks, with an average CTR of just 0.06%. Yet, on Facebook, a fitness campaign can see a 14.29% conversion rate, while a tech campaign might only hit 2.31%. It’s a perfect example of how industry-specific appeal wins out, even on the same platform.
It gets even more granular. Using specific long-tail keywords in search marketing can boost CTR by 3-5%, proving that being hyper-relevant to a niche audience is often more powerful than casting a wide net. For a deeper look at the numbers, you can explore the ultimate marketing statistics for 2026.
B2C vs. B2B: A Tale of Two Audiences
The clearest divide is often between business-to-consumer (B2C) and business-to-business (B2B) marketing. Their audiences, motivations, and buying journeys are worlds apart, and that directly impacts what you can expect from your CTR.
A B2C ad might appeal to someone's dream of a better lifestyle. A B2B ad has to appeal to a company's need for better profits. The emotional hook gets replaced with a logical one.
This table breaks down the key differences that influence why someone clicks:
At the end of the day, a good CTR isn't about hitting some universal magic number. It's about understanding the specific field you're playing on. By benchmarking against your direct competitors and truly getting the unique psychology of your audience, you can set meaningful goals and know what success actually looks like for your business.
Unpacking Email Marketing Click-Through Rates

In email marketing, your click-through rate is more than just a number—it’s a direct signal of how well you're connecting with your audience. A strong CTR tells you that your subject lines are hitting the mark, your content is resonating, and your call-to-action is compelling enough to act on.
But just asking, "what's a good CTR?" is like asking "how long is a piece of string?" The answer isn't a single magic number. It all depends on the type of email you’re sending. Comparing a generic weekly newsletter to a hyper-relevant abandoned cart email is an apples-to-oranges mistake that leads to bad analysis.
Understanding this difference is the first step to benchmarking your performance correctly and finding real opportunities to improve.
Triggered Emails vs. Promotional Broadcasts
The biggest performance divide you'll see is between standard newsletters (or "broadcasts") and automated, triggered emails. The magic is all in the timing and relevance. A broadcast goes out when you decide, but a triggered email lands in the inbox right when the subscriber expects or needs it.
Industry data shows the average email CTR hovers between 2.3% and 2.5%, with anything in the 2% to 5% range considered pretty solid. But that’s just the baseline. Welcome emails, for example, often see a massive open rate of 68.59%, which naturally leads to much higher click rates.
Abandoned cart emails are another powerhouse, boasting open rates near 49%—almost 2.3 times the industry average. That massive gap drives home a critical lesson: relevance gets the click.
When an email is a direct response to a user's action—like signing up or adding an item to their cart—it feels less like marketing and more like a helpful part of their experience. This contextual relevance is why triggered emails are engagement powerhouses.
Why Segmentation Is Your Secret Weapon
Beyond automation, segmenting your audience is the single most effective way to make your broadcast campaigns feel more relevant and boost your CTR. Instead of blasting one generic message to everyone, segmentation lets you talk to smaller, specific groups based on their interests, behaviors, or demographics.
Think about these common approaches:
- Purchase History: Group customers who bought similar items. Now you can send them cross-sells or upsells they’ll actually find useful.
- Engagement Level: Split your most active subscribers from those who've gone quiet. This lets you send targeted re-engagement campaigns to the dormant segment without burning out your best fans.
- Demographic Data: Use info like location or job title to send personalized offers, like invites to local events or content tailored to their industry.
Every layer of segmentation makes your message feel more personal and less like junk mail, which is exactly how you earn more clicks. Of course, a click can't happen without an open, so it's also worth knowing what is a good open rate for emails to get the full picture. For more specific tactics, check out our deep dive on how to improve your email CTR.
Proven Strategies to Improve Your Click-Through Rate

Knowing what your CTR is and what influences it is a great start. But the real growth happens when you start actively improving it. There isn't a single magic button you can press, but a focused, systematic approach built on relevance, appeal, and clarity can deliver some serious wins.
It’s all about moving past the guesswork and putting proven tactics to work. The mission is simple: stop the scroll and earn that click. Whether we’re talking about a PPC ad, an email subject line, or an organic search result, the core principles don't change. You need to craft a message that resonates so deeply with your audience that clicking feels like the only logical next step.
Once you’ve got these fundamentals down, you can really dig into specific tactics. For a super detailed breakdown of channel-specific strategies, this guide on How to Improve Click Through Rate is an excellent resource.
Craft Magnetic Headlines and Ad Copy
Think of your headline as your one and only shot to make a first impression. It has to be compelling enough to hook someone in an instant. The best headlines grab attention because they hit a pain point, spark a little curiosity, or make a bold promise that’s hard to ignore.
For example, it's well-documented that headlines with numbers tend to get more engagement because they set clear expectations for the reader. Interestingly, odd numbers often outperform even ones. One experiment even found that just adding the number 7 to a title boosted its CTR by a solid 20%.
Before: "Ways to Improve Your Marketing"
After: "7 Simple Tricks That Will Double Your Marketing ROI This Quarter"
See the difference? The second version is specific, promises a real, tangible benefit, and even creates a subtle sense of urgency. The same thinking applies to your meta descriptions and ad copy—they’re your mini-pitch for why your content is worth someone’s time.
Leverage Powerful Visuals and Ad Formats
In the sea of content out there, generic stock photos are basically invisible. Your images and videos need to be high-quality, relevant, and genuinely eye-catching. A powerful visual can communicate value in a split second, long before someone reads a single word of your copy. This is especially true on social media and display networks.
Don't be afraid to play around with different ad formats to see what clicks with your audience. For instance:
- Carousel Ads: These are fantastic for showcasing multiple products, highlighting different features, or even telling a story with a sequence of images or testimonials.
- Video Ads: A short, punchy video can capture attention and convey emotion in a way that static images just can't.
- GIFs and Animations: Even a little bit of subtle motion can be enough to draw the eye and make your ad pop in a crowded feed.
The right format makes your ad more engaging and gives people more reasons to be curious enough to click.
Refine Audience Targeting and Personalization
You could have the most beautifully crafted, persuasive ad in the world, but if it's shown to the wrong people, it's going to fall flat. This is why getting your audience targeting right is one of the most powerful levers you can pull to improve CTR. The more relevant an ad is to the person seeing it, the more likely they are to click.
It’s time to go deeper than basic demographics. Segment your audience based on their behaviors, their stated interests, and how they've interacted with your brand in the past. Set up retargeting campaigns for people who checked out your site but didn't convert, or build lookalike audiences to find new people who are just like your best customers. Personalization is what turns a generic broadcast into what feels like a one-on-one conversation.
And this is exactly where data integrity becomes non-negotiable. Without accurate analytics, you're just guessing. Clean data gives you the real insights you need to sharpen your targeting and make sure your message lands with the people who actually want to hear it.
Why You Can't Improve What You Can't Measure Accurately
All the strategies, benchmarks, and A/B tests in the world won’t move the needle if your underlying data is garbage. Making decisions on bad CTR numbers is like trying to navigate a ship with a broken compass—sure, you’re moving, but you have no clue if it’s in the right direction. Real improvement starts with data you can actually trust.
Imagine you launch a brilliant new ad campaign and your analytics dashboard shows a dismal CTR. Your first instinct might be to kill the ad, chalking it up as a failure of copy or creative.
But what if the ad was a winner? What if a broken tracking pixel failed to record thousands of impressions, artificially tanking your CTR and tricking you into scrapping a great campaign? This happens more often than you'd think.
This is where data integrity becomes non-negotiable. Click-through rate is a simple formula, but its inputs—clicks and impressions—are surprisingly fragile. They can get corrupted without you ever knowing.
The Silent Killers of Accurate Analytics
A handful of common, often invisible issues can quietly sabotage your data, making your CTR metrics dangerously misleading. These aren't just minor glitches; they're fundamental breakdowns in your measurement foundation that can completely distort how you see your campaign performance.
Some of the most frequent culprits include:
- Broken Tracking Pixels: When an ad pixel doesn't fire correctly, you get a massive undercount of impressions. The result? A falsely inflated CTR that makes a campaign look better than it is.
- Messy UTM Conventions: Inconsistent or broken UTM tags scramble your attribution, making it impossible to tell which campaigns are actually driving clicks.
- Consent Mode Errors: A misconfigured consent management platform can block analytics from firing for a huge chunk of your users, leaving you with incomplete and unreliable data.
Without a system to monitor for these errors, you’re flying blind. You might be celebrating a 4% CTR that’s really a 2%, or panicking over a performance drop that doesn’t even exist—all because of a technical issue hiding in the shadows.
The Importance of Analytics Observability
This is exactly where an analytics observability platform becomes your safety net. Think of it as a 24/7 quality control system for your data. Instead of manually auditing tags or just crossing your fingers and hoping everything works, automated monitoring actively scans your entire analytics setup.
When an issue like a broken pixel or a schema mismatch pops up, the platform catches it in real time and alerts you immediately. This proactive approach keeps the foundation of your analytics solid, so you can trust your numbers and make decisions with confidence.
Ultimately, you can't truly answer "what's a good click-through rate?" for your business if you can't be sure your measurement is accurate in the first place.
Common Questions About Click-Through Rate
Once you start digging into click-through rate, you'll find a few common questions always seem to surface. It's one thing to know the definition, but it's another to understand how CTR really connects to the other metrics that drive your business. Let's clear up some of the most frequent sticking points.
Is a High CTR Always a Good Thing?
Not necessarily. It’s easy to get excited about a high CTR, but that number is only telling you part of the story.
Think of it this way: CTR is the metric that tells you how many people you convinced to walk through your front door. If they all turn around and walk right back out without buying anything, you haven't actually accomplished your goal. A high CTR paired with a low conversion rate is a classic red flag. It often means there's a disconnect between what your ad promised and what your landing page delivered. You might have written some killer, click-worthy copy that got tons of attention but didn't attract the right people—and now you're paying for clicks that go nowhere.
The real goal isn't just to get clicks; it's to get the right clicks from people who are actually likely to convert. Always look at your CTR next to your conversion rate to get the full picture of your campaign's health.
How CTR Affects Google Ads Quality Score
In the world of Google Ads, your click-through rate isn't just a performance metric—it's a critical factor that directly influences your Quality Score. Google’s main job is to give users the most relevant results, and a high CTR is a huge signal that your ad is a great match for what someone is searching for.
When people consistently choose to click your ad over others on the page, you're essentially telling Google that your message is hitting the mark. This "expected CTR" is a major piece of the Quality Score puzzle. A higher Quality Score pays off in very real ways:
- Lower Ad Costs: Google rewards relevance. A better score often means a lower cost-per-click (CPC).
- Better Ad Positions: A strong Quality Score can bump your ad higher up the results page, even if your bid isn't the highest.
Simply put, improving your CTR is one of the most direct routes to boosting your Google Ads performance and making your budget work harder.
How Often Should I Check My CTR?
There's no single magic number here—the right frequency for checking your CTR really depends on the campaign's age and budget. The best rule of thumb is to match your monitoring schedule to how much your campaign is changing.
For brand-new campaigns or those with a hefty daily spend, checking in daily is a smart move. This lets you catch any big problems—like an ad with a disastrously low CTR—before they burn through too much of your budget. For more mature, stable campaigns that have settled into a predictable rhythm, a weekly check-in is usually plenty. This gives you enough data to spot long-term trends and make strategic tweaks without getting bogged down by normal day-to-day fluctuations.
Your data is the bedrock of your marketing strategy. Don't let tracking errors lead you astray. With Trackingplan, you can ensure every click and conversion is measured accurately, giving you the confidence to optimize your campaigns effectively. Discover how to safeguard your analytics today.