Unlock the power of anomaly detection Adobe Analytics. This guide shows you how to configure alerts, use contribution analysis, and find real-time insights.
Anomaly detection in Adobe Analytics is an AI-driven feature that automatically flags statistically significant deviations from your normal data patterns. Think of it as a 24/7 data watchdog, alerting you to critical issues like sudden conversion drops or unexpected traffic spikes the moment they happen.
Why Anomaly Detection Is Your Data Watchdog

Imagine logging in on a Monday morning only to find your weekend conversion rate mysteriously plummeted by 60%. Without an automated system, you're already two days behind, scrambling to figure out what went wrong while the damage continues. This reactive scramble is precisely what anomaly detection is built to prevent.
Instead of manually sifting through dashboards and hoping you spot a problem, this feature automatically builds a baseline of what "normal" looks like for your key metrics. When a data point falls outside this expected range, it gets flagged as an anomaly.
This proactive approach fundamentally transforms your relationship with data. It moves you from a state of periodic, manual review to one of real-time insight, preventing the costly disasters that manual checks often miss. Implementing robust anomaly detection allows organizations to react quickly to unusual trends and gain deeper insights into their data performance.
Shifting from Reactive to Proactive Analytics
The real magic of using anomaly detection within Adobe Analytics is the strategic shift it enables. You are no longer just reporting on past performance; you are actively safeguarding future results.
This AI-driven capability is critical for a few key reasons:
- Trust in Your Data: It validates that your analytics are performing as expected, giving you confidence in the dashboards you share with stakeholders.
- Early Issue Resolution: By catching problems early, you can fix them before they snowball into significant revenue loss or user experience failures.
- Competitive Advantage: Faster detection and resolution mean your digital experience remains stable and reliable, keeping you ahead of competitors who might be slower to react.
The real power of anomaly detection isn't just in finding problems—it's about building a culture of data confidence. When your team trusts the data, they can make faster, smarter decisions without second-guessing every report.
The Technology Behind the Alerts
Since its prominent rollout, Adobe Analytics' anomaly detection has become a game-changer for businesses spotting unexpected data shifts. For instance, if an e-commerce retailer sees a sudden 35% spike in orders on a random Tuesday, Adobe’s AI-powered system flags it instantly.
The system uses statistical models trained on up to 90 days of historical data, comparing deviations against baselines that are even adjusted for major holidays. This capability ensures that ensuring data integrity is an automated, continuous process. The feature even employs distinct statistical techniques for different time granularities—from advanced time-series algorithms for hourly data to regression models for daily data—achieving high accuracy in separating true signals from noise. You can learn more about Adobe’s detection accuracy and statistical models to understand just how effective it is.
Configuring Alerts in Analysis Workspace

Turning on the native anomaly detection Adobe Analytics offers is surprisingly simple. The real magic, though, happens when you configure it strategically. Your journey starts in Analysis Workspace, the heart of ad-hoc analysis in Adobe.
The first step is always to visualize the metric you're interested in. Just drag a key metric—let's say 'Orders'—onto a Line Chart. Once your data is plotted, click the little gear icon for the visualization settings and check the "Show Anomaly Detection" box. That’s it. Adobe instantly calculates and plots an expected range (that gray confidence band) around your metric, even highlighting past data points that fell outside the norm.
Choosing the Right Training Period
With detection enabled, you’ll face your first critical decision: the training period. This setting dictates how much historical data Adobe's algorithm uses to define what "normal" looks like. You get three choices: 30, 60, or 90 days.
- 30 Days: This is your go-to for volatile metrics or those heavily influenced by recent, short-term campaigns. The model stays nimble and sensitive to the latest trends.
- 60 Days: Think of this as the balanced, "just right" option. It works well for most standard business metrics, capturing recent shifts without getting thrown off by every little spike.
- 90 Days: This is for your stable, high-volume metrics or businesses with long seasonal cycles. It creates the most robust baseline but will be slower to adapt to new, sustained changes in behavior.
Making the right call here is crucial. For example, using a 90-day period for a brand-new product launch would be a mistake—the model has no relevant history to learn from. On the flip side, a 30-day window for year-over-year revenue growth could trigger false alarms by failing to account for established seasonal patterns.
Crafting Intelligent and Actionable Alerts
Seeing anomalies on a chart is one thing, but getting notified the moment they happen is what turns this from a passive analysis tool into an active monitoring system. This is where the alert builder comes in.
Inside the builder, you define the rules that trigger a notification. Here, you can move beyond basic "metric is above/below" logic and apply real statistical rigor. The most important setting is the confidence threshold, which is all about sensitivity.
Think of the threshold as your alert's tolerance for weirdness. A 95% confidence level is super sensitive and will flag minor fluctuations, which can quickly lead to alert fatigue. At the other extreme, 99.9% should be reserved for your most critical, "all hands on deck" metrics, as it only fires for truly massive deviations.
For most of your core KPIs, starting with a 99% threshold is a solid move. It’s tight enough to catch meaningful problems but forgiving enough to ignore the minor, inconsequential data jitters that happen every day.
When you're creating an alert, you're essentially programming a watchdog for your data. The table below breaks down the key settings you'll encounter in the Adobe Analytics alert builder.
Anomaly Detection Alert Configuration Settings
Using these settings thoughtfully is the key to creating alerts that your team will actually pay attention to, rather than just another email to be archived.
A Real-World Alert Configuration Example
Let's make this tangible. Imagine you’re an e-commerce analyst, and your top priority is the checkout funnel. A sudden drop in 'Add to Cart' events could mean a broken button or a nasty bug, costing you real money every minute it goes unnoticed.
Here’s how you’d set up a smart alert for that:
- Metric: 'Add to Cart' events
- Granularity: Daily (this lets you catch issues within a single business day)
- Training Period: 90 days (carting behavior is usually pretty stable over time)
- Threshold: Trigger if the metric is anomalous at a 99% confidence level
- Direction: Only alert when the anomaly is below the expected value. A huge spike in 'Add to Carts' is a reason to celebrate, not panic.
This configuration is specific and actionable. You won't be pinged about normal ebbs and flows, but the moment a statistically significant drop happens, you'll know. Of course, knowing how to manage and customize these notifications is just as important. You can learn more about best practices for handling various alerts to ensure your team's response is swift and effective. This focused approach means that when an alert does hit your inbox, everyone knows it’s time to act.
Finding the Root Cause with Contribution Analysis

An alert hits your inbox. The system did its job and flagged a statistically significant drop in a key metric. Now what? This is where the real work—and the real value of an analyst—begins. It’s time to move from detection to diagnosis.
The next immediate question is always the "why." This is exactly where Contribution Analysis, one of the most powerful features in Analysis Workspace, comes into play. In just a couple of clicks, it shifts the conversation from "what happened?" to "what caused it?"
Contribution Analysis automates what used to be a tedious, manual process of slicing and dicing data. Instead of you having to grind through dozens of dimensions, its machine learning algorithms do the heavy lifting. They analyze hundreds, sometimes thousands, of segments to pinpoint the exact factors that drove the anomaly.
From Alert to Actionable Insight
Let's walk through a real-world scenario. You're the lead analyst for an e-commerce brand. An alert fires on Monday morning: mobile conversions dropped by 40% over the weekend. Panic could set in, but with the right tools, you can tackle this systematically.
Without Contribution Analysis, you'd be stuck doing a manual deep-dive. You’d have to start digging:
- Segment by device type. Is it isolated to iOS or Android?
- Break it down by browser. Did a new Chrome update break something on the site?
- Filter by marketing channel. Is a specific paid campaign suddenly sending junk traffic?
- Analyze by geography. Is the drop concentrated in a single country?
This kind of manual investigation can take hours, if not days. And even then, you might miss the real cause.
Contribution Analysis flips this script entirely. It turns hours of manual guesswork into minutes of guided discovery, letting you give stakeholders immediate, data-backed answers. This is how you solidify your role as a strategic problem-solver, not just a report-puller.
Running a Contribution Analysis in Practice
The process itself is refreshingly simple. Inside your line chart in Analysis Workspace, you just right-click on the anomalous data point—that dot that fell outside the gray confidence band—and select "Run Contribution Analysis."
That's it. The system gets to work, automatically examining every dimension available in your report suite to identify the top items that explain the deviation. When the report is ready, you get a clean, ranked list of factors.
In our 40% drop in mobile conversions scenario, the analysis might reveal something like this:
- Top Contributor: Users on the latest Android OS version had a conversion rate 90% lower than the average.
- Second Contributor: Traffic from a specific weekend marketing campaign had a near 100% bounce rate.
Boom. The root cause is suddenly clear. It's likely either a recent Android update created a compatibility issue with your checkout page, or the marketing team launched a campaign with a broken link. You now have a precise, actionable insight to share with your development and marketing teams.
The Speed and Scale of Automated Root Cause Analysis
The efficiency gained here is massive. With one click, Contribution Analysis breaks down the 'why.' In a classic example from the Analysis Workspace team, a 28% drop in landing page views was traced back to a single broken UTM campaign that accounted for 62% of the deviation. That discovery led to a same-day redirect that salvaged the traffic.
On average, Adobe users can detect and diagnose anomalies 5x faster than with manual methods. This speed is critical for data teams handling huge volumes of data across web and app properties. It's even a lifesaver for developers and QA teams monitoring for JavaScript tag failures, which can plague roughly 25% of implementations and silently corrupt your data.
This process transforms you from a data reporter into a data detective, equipped to solve problems in real-time. You can learn more about how to pinpoint the root cause of data anomalies on Adobe's Experience League.
Advanced Strategies and Common Pitfalls
Once you've got the basic alerts running in Adobe Analytics, the real fun begins. This is where you move past simple monitoring and start building a smart, efficient system that generates serious value. The goal shifts from just catching fires to anticipating them, tuning out the noise, and uncovering subtle shifts in customer behavior.
But this is also where many analytics teams get tripped up. It's easy to fall into common traps that either bury you in useless alerts or, even worse, cause you to miss the events that actually matter. Steering clear of these pitfalls is what separates a novice setup from a mature one.
Sidestepping the Trap of Alert Noise
One of the quickest ways to make your anomaly detection useless is by setting thresholds too low or tracking metrics that are naturally all over the place. When every little bump triggers an email, your team starts suffering from alert fatigue. Before you know it, every notification gets ignored—including the critical ones.
Think about setting a 95% confidence threshold on a metric like 'Page Views' for a major news site. The daily news cycle is so volatile that you'd be getting pinged constantly, turning your alerts into background noise. The whole point is to create a clear signal, not more static.
A much better way to go about it is to be incredibly selective:
- Reserve high-sensitivity alerts (99.9%) for your most sacred, stable metrics. We're talking about core business outcomes like completed orders or new account sign-ups.
- Use annotations proactively. If you know a big marketing campaign is kicking off on Tuesday, drop an annotation on the timeline. This gives the algorithm—and your future self—a heads-up that a traffic spike is coming, preventing a false alarm.
- Audit your alerts regularly. At least once a quarter, look at which alerts fired and which ones actually led to someone taking action. If an alert has been going off every week but everyone just ignores it, it's time to raise the threshold or just turn it off.
Using Calculated Metrics to Uncover Hidden Friction
Sure, watching raw metrics like 'Orders' or 'Visits' is table stakes. But the seasoned pros know that the real gold is often found in the relationship between metrics. This is where calculated metrics become your secret weapon for more sophisticated anomaly detection.
Instead of just keeping an eye on 'Add to Cart' events, create a calculated metric that tracks the 'Add to Cart' to 'Order' ratio. A sudden nosedive in this ratio is a classic sign of friction in your checkout flow. Maybe a promo code field is broken, or a new shipping option is confusing everyone.
Monitoring a ratio metric like this is like having a sensitive early warning system. The total number of orders might look fine for a day or two, but a sinking conversion ratio tells you that a higher percentage of motivated buyers are bailing. It signals a problem you need to jump on now.
This approach helps you graduate from spotting obvious, site-wide outages to catching those subtle points of user frustration that quietly eat away at your bottom line.
Accounting for Known Business Events
Another classic blunder is forgetting that the algorithm has zero context for your business calendar. It sees a massive traffic spike and flags it as an anomaly, completely unaware that you just launched the biggest product of the year. These kinds of false positives can quickly kill your team's trust in the system.
This is where annotations become your best friend. They're just simple notes you add directly to your charts in Analysis Workspace to mark important events.
Think about all the scenarios where annotations are a lifesaver:
- Marketing Campaigns: Mark the start and end dates of major promotions, email blasts, or paid media pushes.
- Site Changes: Note the deployment dates for big code releases, A/B test launches, or redesigns.
- External Events: If you're in e-commerce, you better be marking Black Friday. If you're a news outlet, mark major world events.
By making annotations a regular habit, you're feeding crucial context to Adobe's machine learning model. This doesn't just cut down on false alarms; it also creates a rich historical log that makes it infinitely easier to analyze performance shifts months or even years later. Your analytics platform transforms from a simple reporting tool into a living business diary.
Connecting Analytics Alerts to Technical Fixes
An alert from Adobe Analytics is a fantastic first signal. It tells you what happened—conversions suddenly dropped, or a key user segment vanished. Contribution Analysis might even give you a solid hint as to where the problem is.
But for most analytics and marketing teams, this is where the trail goes cold.
The most frustrating anomalies are almost always rooted in silent, technical implementation bugs that Adobe simply isn't built to see. Was it a malformed dataLayer push in the latest code release? Maybe a third-party script started conflicting with your checkout event. Adobe is great at flagging the business impact, but the technical root cause remains a complete mystery.
This is the critical gap that separates detection from resolution. You've got a clear business problem, but your developers have no clear technical starting point. What follows is usually hours of guesswork, painful code reviews, and a lot of finger-pointing. To fix this, you have to connect the world of business metrics with the world of technical implementation.
Bridging the Gap Between Business Impact and Code-Level Cause
The ideal workflow is a seamless handoff: Adobe detects the business problem, and another system provides the immediate, code-level diagnosis. This is exactly where an analytics observability platform like Trackingplan comes in. It acts as a specialized monitoring layer focused entirely on the health of your analytics implementation itself.
Think of it this way: Adobe Analytics is your car's dashboard telling you the engine temperature is critically high. An observability platform is the onboard diagnostic system that tells you why—because a specific sensor has failed.
Let's say you get an Adobe alert showing a 40% drop in 'purchase' events. Instead of guessing, you can pivot to an observability tool and see a correlated alert: "The 'purchase' event schema is malformed; 'product.price' property is now sending a string instead of a number."
This immediately changes the conversation with your development team. It's no longer a vague "something's wrong with conversions." It becomes a specific, actionable bug report: "The price variable in the purchase event broke in the last deployment."
This integration creates a powerful partnership. Adobe excels at monitoring the business outcomes of your data. An analytics observability platform excels at monitoring the health and integrity of the data collection process itself. Together, they provide end-to-end visibility.
This process highlights the key stages of refining your anomaly detection strategy, from annotating events to creating insightful ratios.
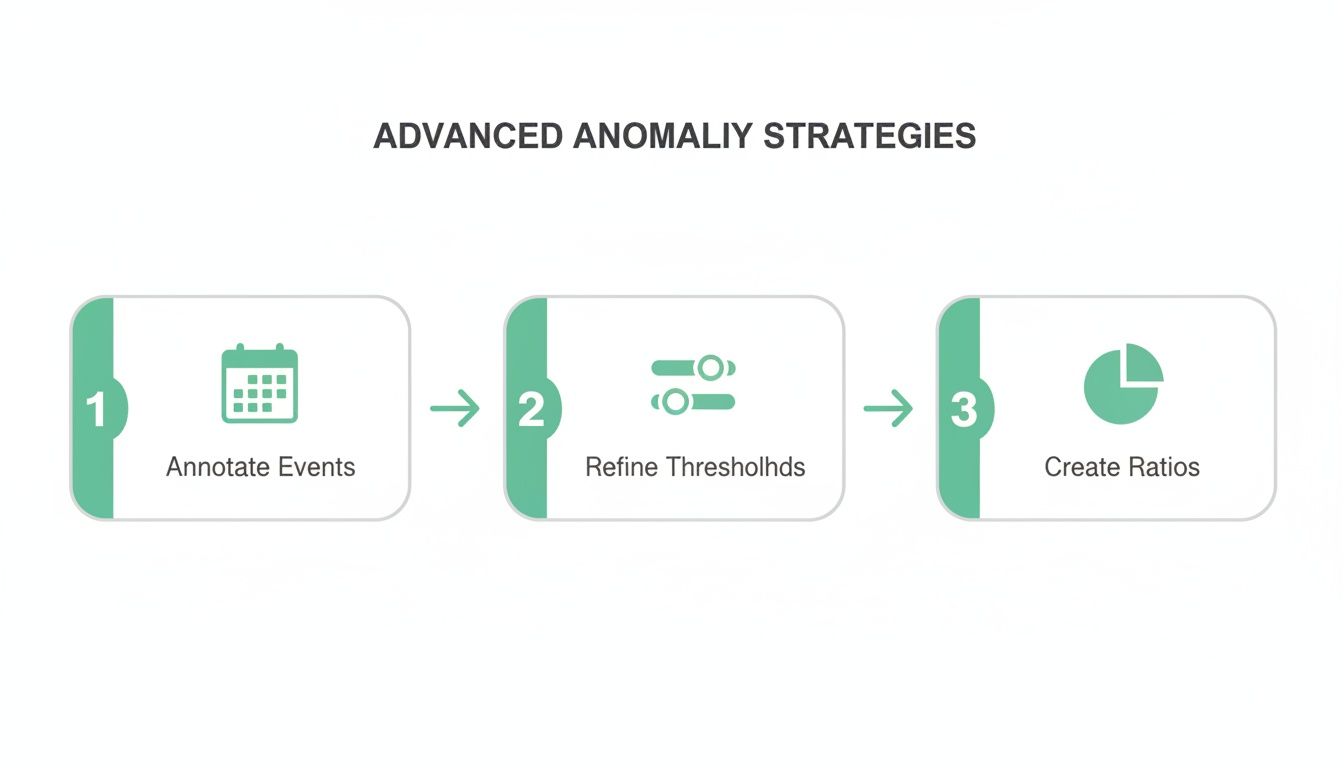
As the flow shows, a mature strategy involves more than just setting up alerts; it requires proactively providing context and focusing on the metrics that truly matter.
Empowering Developers and QA with Concrete Evidence
Without this direct connection, developers and QA teams are often forced to debug analytics issues with very limited information. They might not even be able to reproduce the error, which leads to the dreaded "works on my machine" response.
An observability platform provides the concrete evidence needed to fix things fast. It automatically captures every event, its properties, and its schema as it happens in production, allowing for powerful diagnostics that are impossible with Adobe alone.
Here are a few common scenarios where this combined approach is a lifesaver:
- Broken Third-Party Tags: Adobe reports a drop in affiliate-driven revenue. An observability platform can confirm that the affiliate marketing pixel stopped firing correctly right after a recent update to your consent management platform.
- Schema Mismatches: You notice a key segment has stopped populating in Adobe. The root cause could be that a 'user_id' property is now being sent with the wrong data type (e.g., an integer instead of a string), which a monitoring tool would flag instantly.
- Missing or Rogue Events: A new feature is launched, but you see zero data in Adobe. Instead of wondering if users are ignoring it, you can confirm whether the corresponding tracking event is even firing at all.
This workflow turns your QA and development teams from reactive guessers into proactive problem solvers. For a deeper look at this process, check out our guide on how to debug analytics problems with Trackingplan.
Creating a Single Source of Truth for Data Integrity
Integrating anomaly detection in Adobe Analytics with an observability platform creates a resilient and trustworthy data ecosystem. It establishes a single source of truth that aligns marketing, analytics, and engineering teams around the same facts.
When an alert fires, everyone is on the same page. Marketers see the business impact in Adobe, while developers see the precise technical failure in the observability platform. This alignment drastically reduces the mean time to resolution (MTTR) for any data-related incidents.
Ultimately, this integrated strategy ensures your data integrity from end to end. You can be confident not only that your metrics are being monitored for business anomalies but also that the underlying data collection is technically sound and reliable. This builds trust in your dashboards and empowers your entire organization to make decisions based on data they can actually depend on.
Anomaly Detection FAQs
When you start digging into anomaly detection in Adobe Analytics, a few questions always seem to pop up. Let's tackle some of the most common ones that analysts and marketers run into when fine-tuning their setup.
Think of this as your go-to reference for clarifying key concepts and sorting out any snags you hit along the way.
How Does Adobe Handle Seasonality and Holidays?
Great question. Adobe's algorithm is smart enough to recognize the natural ebb and flow of your business. It looks back at up to 90 days' worth of historical data to build a sophisticated baseline of what "normal" looks like for any given day, week, or season.
This means it already anticipates things like weekend traffic spikes or holiday lulls. For massive, predictable events like Black Friday, the model has learned from past years and bakes those expected surges into its training data.
This is a huge deal because it stops the system from crying wolf over a massive—but completely normal—holiday sales rush. It ensures the alerts you get are for genuinely weird deviations, not just the regular rhythm of your business.
What’s the Difference Between Confidence Levels?
The confidence level is basically your sensitivity dial. It tells the system how "strict" to be when deciding if something is an anomaly.
- 95% Confidence: This is the most sensitive setting. It'll flag even minor blips outside the normal range. It's great for catching small issues early but can also be noisy.
- 99% Confidence: This is the sweet spot and the best place to start for most of your important metrics. It flags significant deviations that are much less likely to be random noise.
- 99.9% Confidence: This is the least sensitive. Save this for your absolute, mission-critical KPIs. It only triggers for extreme, highly unlikely events that need all-hands-on-deck, right now.
My advice? Start with 99% for your core metrics and see how it feels. If you're drowning in alerts, tighten it to 99.9%. If you think you're missing things, you can loosen it to 95%—just be ready for more notifications.
Can I Use Anomaly Detection on Calculated Metrics?
Yes, you absolutely can—and you should. This is a seriously powerful, pro-level move. Anomaly Detection works on just about any metric you can chart in Adobe, from standard stuff like Page Views to custom events like 'Form Submission' and, yes, your own calculated metrics.
Running it on a metric like 'Conversion Rate' (Orders ÷ Visits) or 'Add to Cart Rate' can expose subtle problems in your funnel that you'd completely miss by just looking at the raw numbers. A quiet dip in a key ratio is often the first sign of a real problem with user experience.
Why Do I Need Another Tool for This?
Here's the thing: Adobe is fantastic at telling you the what and the where. It'll say, "Hey, your Revenue dropped 30%" and even "it happened on Android devices." But it hits a wall when it comes to the technical why.
Was it a broken analytics tag? A mangled dataLayer? A conflict with your consent management platform? Adobe just can't see that far.
That’s exactly where an analytics observability tool fits in. It’s watching your implementation’s health in real-time. So when Adobe flags the business problem, an observability platform gives you the immediate, code-level root cause. It tells your developers exactly what broke and where. The two tools work hand-in-hand to close the loop from detection to resolution, giving you true end-to-end data integrity.
Stop guessing and start fixing. Trackingplan provides the missing technical context to your Adobe Analytics alerts, giving you the complete picture from business impact to code-level root cause. Ensure your data is trustworthy and empower your teams to resolve issues faster. Discover a smarter way to manage your analytics at https://trackingplan.com.