
You launched an A/B test on a checkout flow. Traffic was healthy. The variant looked promising in the first few days. A few weeks later, the result still says inconclusive.
That outcome frustrates almost every analyst at some point. The usual reaction is to blame the tool, the stakeholders, or the users. But very often, the actual issue is simpler. The test was never built to reliably detect the kind of change you cared about.
That's where statistical power matters. If you want to explain statistical power in plain English, start here: it tells you how likely your test is to notice a real effect when that effect exists. In practice, it's one of the main differences between an experiment that produces a decision and one that burns time, traffic, and confidence.
Why Your A/B Tests Are Inconclusive
A junior analyst once asked me why a test with “so much traffic” still didn't produce a clear answer. They had changed a call-to-action, split traffic evenly, and waited patiently. Nothing broke. Nothing looked obviously wrong. But there still wasn't enough evidence to call a winner.
That's a classic power problem.
Most inconclusive tests aren't failures in the dramatic sense. They're failures in setup. The team wanted to detect a modest change, but the experiment didn't have enough ability to separate a real signal from normal user noise. The result sits in limbo, and everyone leaves the meeting with a different interpretation.
Think of power as your test's eyesight
A useful mental model is this: statistical power is your experiment's eyesight. If the effect is large and the data is clean, the test can see it clearly. If the effect is subtle, the sample is thin, or the data is noisy, the test squints.
That's why “we ran the test for weeks” doesn't automatically mean much. Runtime alone doesn't guarantee clarity. If the design is weak, more waiting may only extend uncertainty.
Why analysts miss this early
Teams often focus on launch mechanics first:
- Variant setup: Did the experience render correctly?
- Platform choice: Did we use the right A/B test platform?
- Primary metric: Did we agree on the KPI?
- Reporting cadence: Who gets updates and when?
Those are important. But they don't answer the harder question: was this test designed to detect the effect we care about?
If the answer is no, an inconclusive result isn't surprising. It's the expected outcome. Power helps you spot that risk before you send traffic into the experiment.
The Core Concept of Statistical Power
When analysts first hear the term, they often get a short definition and move on. That's not enough. Power only clicks when you connect it to the decisions you're making during experiment design.
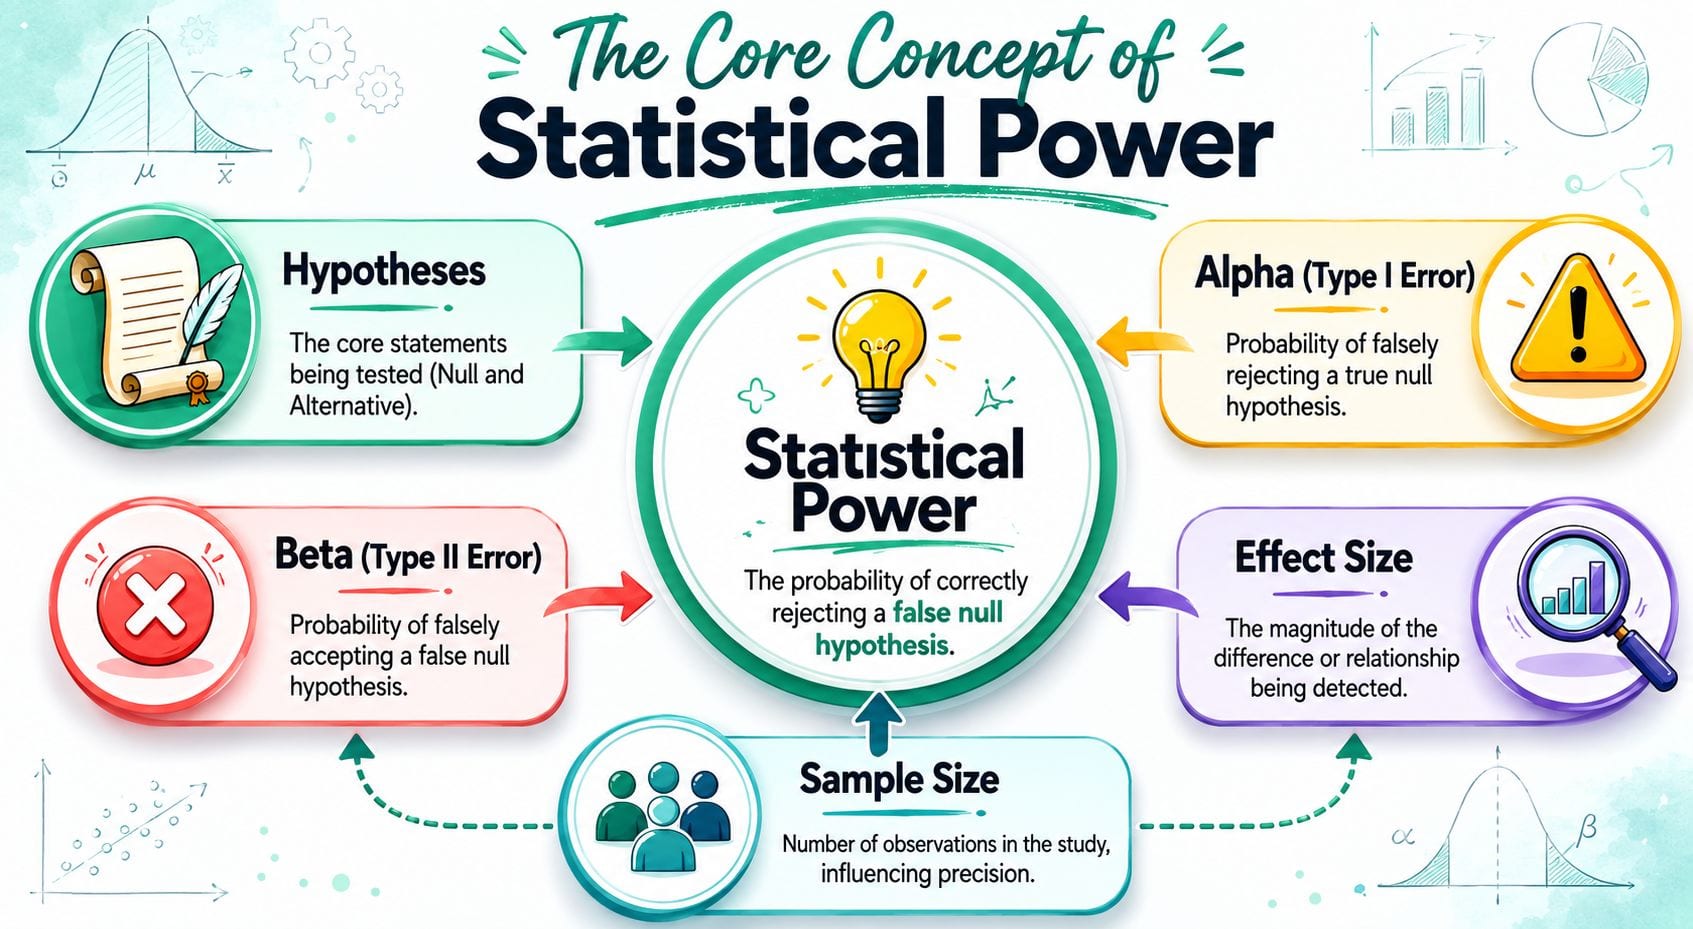
Start with the two claims in every test
Every A/B test begins with a pair of competing ideas:
- Null hypothesis: there's no meaningful difference between control and variant.
- Alternative hypothesis: there is a difference worth detecting.
Your statistical test tries to decide whether the data give you enough reason to reject the null.
That's where errors enter the picture.
The smoke detector analogy
Think about a smoke detector in an office kitchen.
If it goes off because someone burned toast, that's annoying, but it isn't a real fire. In statistics, that's like a Type I error. You think you found an effect when none exists. Your tolerance for that mistake is tied to alpha, your significance level.
If the detector stays silent during an actual fire, that's much worse. In statistics, that's a Type II error. A real effect exists, but your test fails to detect it. The probability of that miss is called beta.
Statistical power is the flip side of that second mistake.
Statistical power is the probability of correctly rejecting the null hypothesis when it is false.
In notation, power is 1 - β.
Why this matters in plain language
Suppose your new signup flow improves conversion. A high-power test has a good chance of noticing that improvement. A low-power test may shrug and report no clear difference, even though the variant really is better.
That's why power matters so much to working analysts. It's not an abstract academic metric. It's your protection against wasting effort on tests that can't answer the question they were asked.
Power is about design, not retrospective storytelling
A lot of confusion starts because people treat power as something they can inspect after results come in. That's not the right frame. Power is mainly about how you set up the test before data collection starts.
Here are the ingredients that shape it:
- The test you use: Different statistical tests detect effects differently.
- Sample size: More observations usually make detection easier.
- Effect size: Bigger changes are easier to detect than subtle ones.
- Significance level: Stricter false-positive control makes detection harder.
- Variability: More noise makes true effects harder to distinguish.
Mentor's shortcut: Power answers, “If the change is real, how likely is this experiment to notice it?”
That's the version you should keep in your head when someone asks you to explain statistical power during test planning.
The Four Levers That Control Your Test's Power
A test can have plenty of traffic and still struggle to detect a real lift.
That usually happens because one or more power levers were set poorly, or because the measurement itself is unstable. In A/B testing, power is not only about statistics on paper. It depends on whether your analytics setup is clean enough for those assumptions to hold in production.
Sample size
Sample size is the easiest lever to see because it answers a practical question: how many chances does the test get to notice a difference?
A homepage experiment might collect data fast because nearly every visitor qualifies. A test on a niche checkout path might take weeks because only a small subset of users ever reaches it. If both tests use the same minimum runtime or the same traffic thresholds, one of them is likely being judged with far less evidence.
More observations usually shrink uncertainty. They do not fix bad tracking, though. If purchase events are missing for part of your traffic, your effective sample is smaller than the dashboard suggests.
Effect size
Effect size is the size of the change you care about detecting.
Often, planning gets fuzzy. A team says, “we want to catch any improvement,” but that is not a planning target. A better question is: what is the smallest lift that would change a decision? If a tiny conversion gain would not justify rollout effort, QA risk, or engineering follow-up, there is no reason to design the test around detecting it.
A small effect works like a faint signal in a noisy room. You can hear it, but only if the room is quiet enough or you listen for long enough.
Significance level
The significance level, alpha, sets how cautious you want to be before calling a winner.
A stricter alpha lowers the chance of a false alarm. It also raises the bar for detection. In practical terms, you are asking the test for stronger evidence before you act.
That matters when many people are watching the results, slicing the data, and hoping to move quickly. It also matters when the business cost of a false positive is high, such as shipping a checkout change that looks helpful but harms revenue.
Variance
Variance is the noise around your metric.
Some of that noise comes from user behavior. Some comes from the measurement system itself. Delayed events, duplicate fires, inconsistent naming, broken identities across devices, and schema drift all add wobble. That wobble makes true differences harder to separate from random movement.
This is the lever many articles treat as abstract. In digital analytics, it is operational. If your event stream is messy, your test has less power than the calculator predicted. A power analysis assumes the metric is being measured consistently. Missing events break that assumption unnoticed.
A quick reference table
| Factor | How to Adjust It | Impact When Increased |
|---|---|---|
| Sample size | Run longer, send more eligible traffic, reduce unnecessary exclusions | Power generally increases |
| Effect size threshold | Focus on larger changes that matter to the business | Power increases because larger effects are easier to detect |
| Significance level | Use a less strict alpha if the context allows it | Detection becomes easier, but false-positive risk also rises |
| Variance | Improve measurement quality, reduce noise, tighten experiment design | Lower variance improves power |
The part many teams miss during planning
These four levers do not operate in isolation. They interact.
Suppose a team plans a test around overall conversion rate, assumes stable tracking, and estimates a reasonable sample size. Halfway through the experiment, a schema change causes one variant to lose some checkout events on Safari. Nothing about the planned sample size changed, but the test just became noisier and weaker. On paper, the experiment still looks adequately powered. In reality, the measurement quality dropped, so the ability to detect the true effect dropped with it.
That is why analytics QA belongs in power planning. Automated observability is not a nice extra for experimentation programs. It is part of preserving the assumptions behind the test. If your instrumentation can drift during the run, your original power calculation can stop matching the experiment you are running.
This also becomes more complicated when teams segment results by device, region, customer type, or funnel stage, or when they test multiple variants at once. If you have worked with multi-armed bandit testing in experimentation programs, you have already seen the operational version of this problem. Traffic allocation can change quickly, but you still need clean measurement for each audience and each outcome you care about.
Practical rule: Ask whether you have enough clean, relevant observations to detect the smallest effect that would change a real business decision.
Common Mistakes When Dealing With Statistical Power
A lot of power mistakes start with a simple misunderstanding. Teams treat power like a score they can inspect after a test finishes, instead of a planning tool that helps shape the test before traffic arrives.

Mistake one: calculating observed power after the test ends
This is one of the most common traps in experiment reviews.
Once the test is over, you already have the estimate, the interval around it, and the result of the significance test. Adding “observed power” on top usually does not clarify anything. It often just restates that the estimate was noisy. For a junior analyst, a good rule is simple: use power to design the test, then use the actual results to interpret the test.
An A/B testing analogy helps here. If a campaign underdelivers because tracking broke on the purchase event, you would not repair the decision by renaming the reporting metric. You would examine what happened in the measurement process. Post hoc power has a similar problem. It sounds technical, but it rarely fixes the underlying weakness in the study design.
Mistake two: treating higher power as an automatic win
Higher power is useful only when it helps answer a worthwhile business question.
A team can raise power by making the minimum detectable effect tiny, extending the test far beyond what the business needs, or loosening decision standards in ways that increase false positives. Those choices can make a test more likely to detect something, but not more likely to detect something that matters.
In practice, the goal is not “maximum power at any cost.” The goal is enough sensitivity to catch a meaningful change with measurement you trust.
Mistake three: acting like one threshold fits every test
Some analytics teams inherit a default target and apply it everywhere. That is convenient, but it is not disciplined.
A homepage redesign, a pricing experiment, and a checkout bug fix do not carry the same risk. Missing a small effect in one case may be acceptable. Missing it in another may mean weeks of wasted engineering time or a bad rollout decision. Good analysts set power targets in context. They ask what kind of miss the business can tolerate, how expensive the test is, and whether the metric is stable enough to support the plan.
Mistake four: reading “not significant” as “no effect”
This mistake creates false confidence.
A non-significant result often means the experiment could not distinguish signal from noise under the conditions that occurred. Maybe the effect was smaller than expected. Maybe the sample was too small. Maybe the metric got polluted.
That last point gets overlooked in many experimentation programs. A practical challenge in modern experimentation is that power calculations assume the measurement system stays consistent. But production analytics rarely behaves that neatly. Missing events, duplicate fires, schema drift, attribution changes, or one browser dropping a key step in the funnel all make the data noisier than the original plan assumed. On paper, the test may still look adequately powered. Operationally, its ability to detect a true effect has weakened.
That is why analytics QA belongs in this conversation. If your team is seeing warning signs that analytics tracking is broken, treat that as a power problem too, not just a data hygiene problem. Automated observability helps catch those failures early, before a broken event stream turns an otherwise sensible experiment into an inconclusive one.
Low power rarely means “nothing changed.” It often means the experiment, or the measurement behind it, was too weak to show the change clearly.
How to Calculate Power and Sample Size
Once you understand the concept, the practical question is straightforward: how do you use it before launching a test?
The answer is an a priori power analysis. You choose the inputs you care about, then solve for the missing piece, which is often the sample size.

The workflow analysts actually use
You don't need to memorize formulas to work responsibly. You do need a disciplined workflow.
Pick the primary metric
Decide what outcome will drive the decision. Conversion rate, revenue per user, signup completion, retention event, or something similar.Define the minimum effect that matters
This is the smallest change worth acting on. If the effect is smaller than that, would anyone still ship the variant?Set alpha and desired power
These choices reflect your tolerance for false positives and false negatives.Estimate variability or baseline behavior
Your tooling will need assumptions about the underlying data.Solve for sample size
The output tells you how much data the experiment needs under those assumptions.
Popular tools
Different teams prefer different tools:
- G*Power: Useful when you want a graphical interface and guided inputs.
- R with
pwr: Handy for analysts who already work in notebooks or scripts. - Python with
statsmodels: A common choice for experimentation pipelines and reproducible analysis.
The important part isn't the brand of tool. It's whether the inputs reflect the actual experiment.
What the tools are really doing
At a high level, these tools help you answer a question like this:
- Given a target effect,
- a chosen alpha,
- a desired level of power,
- and assumptions about variability,
how many observations do I need?
Or, if traffic is fixed, they can help answer the reverse:
What size of effect could this test realistically detect?
That second question is often more useful when you're traffic-constrained.
A short visual walkthrough can help if you prefer learning by example:
Keep the assumptions honest
The biggest mistake in sample size planning isn't arithmetic. It's optimism.
Analysts often assume stable traffic, clean implementation, and one simple readout. Real tests rarely behave that neatly. Variants may split unevenly. Instrumentation may drift. Stakeholders may ask for device-level or market-level cuts after launch. Every one of those realities can make the original calculation less representative of the actual decision environment.
A practical checklist before you trust the output
Before you accept any sample size estimate, ask:
- Is the effect threshold meaningful? Detecting a tiny change isn't useful if nobody would act on it.
- Is the metric trustworthy? If event collection is unstable, the math may look cleaner than the data.
- Will people segment the result later? If yes, plan for that before launch.
- Are there multiple variants or multiple primary questions? If yes, the design gets more demanding.
Good power analysis doesn't guarantee a clean result. It gives your test a fair chance to earn one.
Power in the Real World of Analytics QA
Your team launches an A/B test on Monday. By Friday, the result looks noisy, the segments do not line up across tools, and nobody is sure whether the variant failed or the tracking did.
That is the version of statistical power analysts run into in daily work.
On paper, power assumes a clean measurement system. In production, experiments depend on tags firing correctly, event names staying stable, traffic splitting as planned, and downstream tables preserving the same logic from collection to reporting. If any of those pieces slip, the test can lose practical power even when the original sample size looked reasonable.
How analytics issues reduce power without looking like power issues
A missing conversion event works like a microphone full of static. The signal is still there, but it is harder to hear.
Schema drift causes a different problem. If signup_complete becomes sign_up_complete halfway through the test, one part of the pipeline may count the event while another drops it. The experiment report then mixes clean and broken data, which adds noise and can shrink the difference you are trying to measure.
Uneven traffic allocation has the same effect. So do broken campaign parameters, duplicate events, and warehouse transformations that redefine a metric after launch. None of those errors arrive labeled "low power," but they all make real effects harder to detect.
Why QA belongs in the power conversation
Power calculations are only as trustworthy as the measurement layer underneath them.
That matters in analytics operations because experimentation is not a standalone math exercise. Teams are shipping app releases, updating GTM containers, changing server-side mappings, adding new destinations, and revising dashboards while tests are still running. Every change creates a chance for silent measurement drift. If the data collection changes mid-test, the original power plan describes an ideal setup, not the system you currently have.
This is why observability should sit next to experimentation, not somewhere else on the org chart. Automated checks for event presence, payload consistency, and schema changes help protect the assumptions behind the test. A process for data validation for digital analytics gives analysts a way to catch missing events and broken mappings before those issues distort the readout.
The same lesson applies outside classic product experiments. Teams working on broader reporting problems, including mastering Telegram data analysis, still depend on complete and consistent underlying events before any statistical conclusion is worth trusting.
A practical way to explain this to stakeholders is simple: a power calculation does not guarantee detectability on its own. It assumes the instrumentation behaves. If tracking breaks, your actual chance of detecting a meaningful effect drops, even though the spreadsheet never changed.
If your team wants more trustworthy experiments, Trackingplan is one way to monitor analytics implementations across web, app, and server-side stacks so missing events, schema drift, and broken pixels don't subtly undermine your test results.