Learn how to increase conversion rates with our analytics-driven guide. We share proven strategies to turn clean, reliable data into sustainable revenue growth.
If you want to truly increase conversions, you have to stop guessing and start building a system on data you can actually trust. Sustainable growth isn't about chasing the latest shiny tactic; it's about making smart decisions backed by clean, reliable analytics. This process is what ensures your optimization efforts are effective and deliver real results.
Your Blueprint for Analytics-Driven Conversion Growth
So many conversion rate optimization (CRO) efforts fall flat. I've seen it countless times: teams launch A/B tests based on a gut feeling or a "best practice" article, only to see inconclusive results. The hidden culprit is almost always flawed data from broken tracking, which dooms experiments from the start and wastes a ton of time and resources.
This guide lays out a repeatable playbook for growth that moves you away from unreliable dashboards and siloed teams. It’s all about creating a unified strategy where every marketing and product decision is validated by analytics you can count on. The core idea is simple but powerful: solve your data quality issues first to build a rock-solid foundation for everything else.
The Core Pillars of Data-Driven CRO
To really nail this, you need a mental model that shifts from the old way of doing things to an analytics-first approach. It's about changing where you focus your energy.
| Pillar | Traditional CRO Focus | Analytics-Driven Focus |
|---|---|---|
| Foundation | Quick wins and UI tweaks | Data integrity and a single source of truth |
| Hypothesis | "Best practices" or hunches | Insights derived from clean behavioral data |
| Validation | A/B testing as the first step | Analytics QA and tracking validation before testing |
| Outcome | Inconclusive or misleading test results | Statistically significant wins tied to business KPIs |
This table really highlights the fundamental difference. The analytics-driven method isn't just a process; it's a mindset that prioritizes certainty over speed, leading to much more reliable outcomes in the long run.
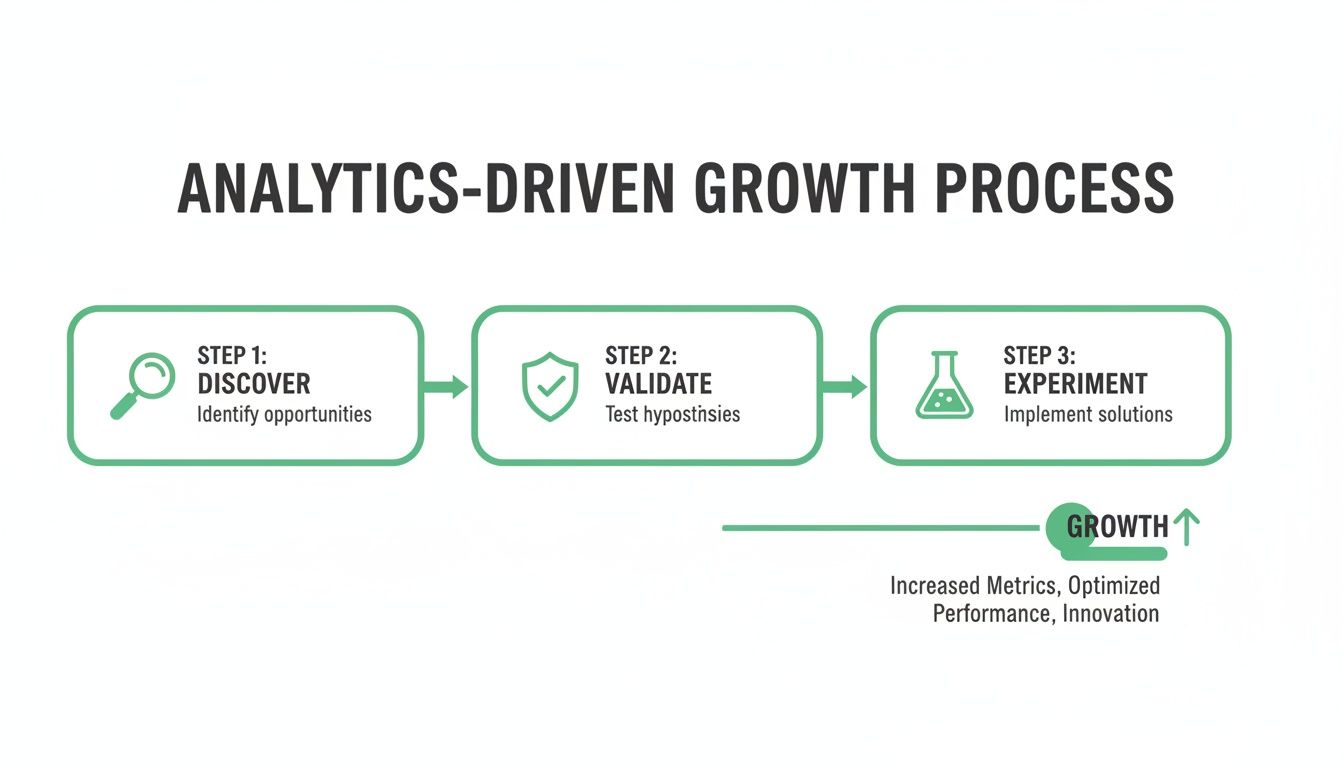
The Cycle of Sustainable Growth
The most successful growth teams I've worked with all follow a clear, repeatable cycle. This is what transforms optimization from a series of random shots in the dark into a systematic process that builds momentum. It’s a continuous loop of discovery, validation, and experimentation.
This approach ensures that every experiment you run is built on a foundation of accurate data, which dramatically increases its chances of success.
From Unreliable Data to Actionable Insights
The primary goal here is to establish a single source of truth. When your entire organization trusts the numbers, you can move faster and with much more confidence. It means getting beyond vanity metrics and focusing on the KPIs that truly reflect user behavior and hit your business objectives.
The journey to higher conversions begins not with a new button color, but with a commitment to data integrity. When you can trust your numbers, you can trust your decisions.
For some practical strategies on achieving those significant gains, there are great insights on how to improve sales conversion rate.
This entire blueprint works because it gets to the root cause of most failed CRO: bad data. Once you fix your analytics foundation, you unlock the ability to:
- Stop Wasting Resources: End the frustrating cycle of running flawed A/B tests that only produce misleading or inconclusive results.
- Build Team Confidence: Align your developers, marketers, and analysts around a shared, trusted dataset, which eliminates so much friction.
- Drive Real Revenue: Make changes that are statistically proven to positively impact your bottom line.
This analytics-first methodology is the key to unlocking consistent, predictable growth and finally getting a clear answer to how you can meaningfully increase conversions.
Establishing a Single Source of Truth for Your Data
You can't fix what you can't measure. It’s a simple truth, but one that gets overlooked all the time. Before you can even think about lifting conversion rates, you have to get your data house in order. That means moving from a mess of disconnected spreadsheets and platforms to a single source of truth that everyone—from marketing to product to the dev team—can actually trust.
This isn’t just about a data cleanup project. It’s about building the entire foundation for how you make decisions. When your data is a mess, your conclusions will be, too. If your analytics are broken, you might kill a new feature thinking it's a failure, when the real problem is that the "purchase" event isn't firing correctly on iOS. This leads to wasted resources, frustrated teams, and a complete loss of faith in your own reporting.
From Business Goals to Measurable KPIs
The first move is to translate those big, high-level business goals into specific, measurable Key Performance Indicators (KPIs) that are tied to real user actions. A goal like "increase user engagement" is far too vague to be useful. You have to break it down.
For an e-commerce business, it might look like this:
- Goal: Increase repeat purchases.
- Percentage of customers making a second purchase within 30 days.
- Average time between the first and second purchase.
- Conversion rate of post-purchase email campaigns.
And for a SaaS platform:
- Goal: Improve trial-to-paid conversion.
- Percentage of trial users who complete the onboarding checklist.
- Number of key features adopted during the trial.
- Drop-off rate at the payment submission step.
When you define these KPIs, you create a shared language. Suddenly, every team is on the same page about what success looks like and how we're measuring it. That alignment is the first real milestone on the path to meaningfully increasing conversion rates.
Auditing Your Existing Analytics for Errors
With your KPIs locked in, it’s time to take a hard look at your current analytics setup. This is usually where the skeletons come out of the closet. You're hunting for the common issues that poison your data and make it completely untrustworthy.
I've worked with countless teams who were confident in their data, only to discover that over 30% of their key conversion events were either misconfigured or missing entirely. They were making critical business decisions based on a dangerously incomplete picture.
Keep an eye out for these classic red flags:
- Inconsistent Naming Conventions: One developer tracks
product_viewedwhile another implementsViewProduct. Your data is now split, and building a simple funnel is impossible. - Missing or Incorrect Properties: A
purchaseevent fires, but thepriceproperty is missing. Good luck tracking revenue accurately. - Rogue Events: Old, unplanned, or deprecated events are still firing, cluttering your analytics with noise and confusing your reports.
- DataLayer Mismatches: The data being passed from your site's data layer to your analytics tools is incomplete or formatted incorrectly.
Trying to audit this manually is a complete nightmare. It means digging through code, inspecting network requests, and clicking through endless tag manager setups. It's a tedious, thankless job that's obsolete the moment you finish.
Building Your Data Constitution: The Tracking Plan
The answer is a comprehensive tracking plan. Think of it as the constitution for your company's data—a living document that defines every single event, property, and user trait you track. It becomes the definitive guide for developers implementing analytics and the go-to manual for analysts trying to make sense of the data.
A solid tracking plan clearly specifies:
- Event Name: What user action is tracked (e.g.,
SignUp Complete). - Trigger: When and where the event fires (e.g., "On successful submission of the registration form").
- Properties: The contextual data included with the event (e.g.,
plan_type: "Pro",signup_method: "Google"). - Owner: The team responsible for maintaining the event.
But here’s the catch: creating and maintaining a tracking plan by hand is a massive undertaking. This is where automation becomes a true game-changer. Instead of that grueling manual discovery process, a tool like Trackingplan can automatically generate a perpetually updated map of your entire analytics implementation.
It discovers every event and property, identifies its origin, and shows you exactly where the data is flowing. You get a live tracking plan without the weeks of manual labor. This automated approach ensures your single source of truth stays true, freeing up your team to focus on what actually matters—using that reliable data to drive conversions.
Automating Analytics QA to Protect Your Data

Having a solid tracking plan is a great first step, but it’s only half the battle. The real challenge comes from keeping your data clean and accurate through the constant chaos of development cycles. This is where automated analytics Quality Assurance (QA) becomes your essential safety net against bad data.
Let's be realistic: manual checks just don't scale. A single developer could unknowingly break your add_to_cart event during a routine release, and your sales data would be useless overnight. By the time you spot the problem in a weekly report, the damage is already done, and you’re stuck digging through old commits and tickets to find the source.
Moving from Reactive Fixes to Proactive Monitoring
To genuinely improve conversions, you must have complete trust in your data. Proactive monitoring flips the script entirely. Instead of discovering problems days after they occur, you catch them the moment they happen. It's the difference between analyzing a car crash after the fact and getting an alert that your brakes are about to fail.
Consider this common scenario: a developer pushes a small update to your checkout page. An automated QA system immediately flags that the begin_checkout event is now missing its currency property.
Within minutes, an alert hits the engineering team's Slack channel.
- The Alert Details: It pinpoints the exact event (
begin_checkout), the missing property (currency), the page where it broke, and even links to the code release that likely caused the issue. - The Result: The team rolls out a fix in under an hour, long before it can corrupt financial reporting or derail a live A/B test.
This is the real power of automation. It turns data quality from a tedious, manual chore into a continuous, real-time process that protects your entire operation.
Safeguarding Your Attribution and Business Health
Analytics QA goes far beyond just validating events. It also acts as a critical line of defense for your marketing attribution and overall business integrity. A new campaign launch, for example, could easily introduce malformed UTM parameters, which would completely skew your attribution models and lead to poor budget decisions.
Direct traffic, for instance, often converts at a high rate—averaging 3.3%—but it's notoriously difficult to track accurately without the right tools. Platforms like Trackingplan solve this by automatically discovering your entire data implementation and alerting you to tagging errors, ensuring every visit is properly credited. We've seen marketers achieve up to a 20% lift in tracked direct conversions just by fixing these kinds of schema mismatches.
Your conversion experiments are only as good as the data they're built on. Automated QA isn't just a technical nice-to-have; it's the bedrock of every successful optimization effort.
Beyond marketing, automated monitoring is fundamental for data governance. You can configure it to watch for critical issues that carry serious business risks. For a deeper dive on this, our guide on how to bulletproof your digital analytics with data validation offers a comprehensive look.
This includes setting up alerts for:
- PII Leaks: Get notified instantly if personally identifiable information (like an email) is accidentally sent to a third-party analytics tool, preventing a potential privacy disaster.
- Consent Violations: Monitor whether tracking pixels fire before a user gives consent, helping you stay compliant with regulations like GDPR and CCPA.
By automating this protective layer, you not only ensure your conversion data is clean but also shield your company from major financial and reputational damage. This clean data foundation gives you the confidence to design and run experiments that will actually move the needle.
Designing and Running Experiments You Can Trust
Alright, you’ve put in the hard work to get your data clean and reliable. You’re no longer just playing defense, fixing broken tracking and chasing down rogue events. Now it’s time to go on the offense.
This is the moment where your pristine analytics turn into action. You can finally design and run conversion experiments with confidence, knowing the results will be trustworthy. No more guesswork. It's all about data-driven hypotheses from here on out.

Uncovering Opportunities in Your Funnel
First things first: dive into your validated analytics and find where users are hitting a wall. With data you can actually trust, your funnel analysis transforms from a confusing report into a treasure map, pointing directly to the problem areas that are killing your conversions.
Instead of just staring at a low conversion rate and shrugging, you can start asking incredibly precise questions:
- At which specific step in the checkout flow are most of our mobile users dropping off?
- Do we have product categories with a high "add to cart" rate but a surprisingly low "begin checkout" rate?
- Are users who use the search bar more likely to convert than those who navigate with the main menu?
The answers, backed by reliable event data, are the starting point for powerful optimization ideas. You’re not just looking at numbers anymore; you’re spotting real user behavior patterns that signal friction and frustration.
Forming Hypotheses from Behavior, Not Best Practices
Forget about generic "best practices." Your users are unique, and their behavior on your site is the only truth that matters. The best hypotheses aren't pulled from a blog post; they connect a real observation to a proposed solution and a predicted outcome.
Let's walk through a real-world scenario. Your validated funnel analysis reveals a massive 40% drop-off between the shipping information and payment steps in your checkout.
- The What (Observation): A huge chunk of users are bailing right after they see the shipping costs.
- The Why (Behavioral Insight): Your hypothesis is that unexpected shipping costs are creating sticker shock and breaking trust at a critical moment.
- The Fix (Hypothesis): By displaying a shipping cost estimator on the product page before checkout even starts, we can set expectations, reduce surprise costs, and improve the final checkout completion rate by 15%.
See the difference? This is worlds away from, "Let's test a green button because someone on Twitter said it works." Your hypothesis is specific, measurable, and directly tied to a problem you found in your own data.
The most successful experiments don't come from brilliant ideas pulled from thin air. They come from methodical, data-driven sleuthing that uncovers a genuine customer pain point.
Measuring the True Impact of Social Proof
Another classic conversion tactic is using social proof and user-generated content (UGC)—think customer reviews, case studies, or embedded social media posts. The challenge has always been knowing if it actually works. With validated tracking, you can finally get a clear answer.
UGC can be a game-changer. For example, some studies show it can boost conversion rates by over 100% when users interact with it. For a B2B SaaS company, this might be embedding G2 reviews or showcasing a tweet thread about a feature. But if your analytics are a mess, you can't trust the data that "proves" the UGC is working.
Continuous monitoring ensures that you can believe the numbers you're seeing, giving you confidence in both your social proof and the analytics measuring its impact. You can see more compelling stats like this in Wordstream’s conversion optimization roundup.
The Role of an A/B Testing Platform
Of course, to run these experiments, you need a solid A/B testing framework. There are plenty of great tools out there, but every single one of them is completely dependent on the quality of the data you feed it. A good platform will help you segment audiences, roll out variations, and measure the results.
Choosing the right tool is an important decision on its own. If you're in the market, our guide on how to choose the best A/B test platform for your needs can help you sort through the options.
Ultimately, the success of any experiment—a small UX tweak, a new feature, a pricing change—comes down to your ability to accurately track what happens next. That analytics foundation you built isn't just a safety net; it's the engine that powers your entire optimization program and makes sure every test delivers a clear, trustworthy result.
Analyzing Results and Preventing Conversion Regressions

Getting an A/B test live is exciting, but it’s really just the starting line. The real wins are found in the analysis that follows, and you can only do that when you’re certain your data is free from tracking errors. Interpreting experiment results with confidence is the backbone of any strategy for how to increase conversion.
Once you have that foundation of clean analytics, you can go way beyond just checking for statistical significance. You can start digging up actionable insights that will power your next wave of optimizations. You can confidently point to a specific change and say, "That's what drove the lift in sales," instead of wondering if it was just a fluke or a data glitch.
Interpreting Your Experiment Data with Confidence
Once your experiment wraps up, the first thing to do is validate the results. Since you've already put in the work to ensure your tracking is rock-solid, you can trust the numbers flowing into your A/B testing platform. This lets you focus on the story the data is telling.
Look past the primary conversion goal. Did the winning variation have any ripple effects on secondary metrics?
- Positive Side Effects: Maybe simplifying your sign-up form not only boosted sign-ups but also improved downstream activation rates. That's a double win.
- Negative Side Effects: Perhaps a new homepage design increased clicks to product pages but tanked the average order value.
Understanding these nuances is everything. A change might look like a winner on one metric but could be hurting the business overall. Clean data gives you the full picture so you can make a smart call, not just declare a premature victory based on a single KPI.
For instance, Stripe found that offering local payment methods can skyrocket conversion—they saw a boost of up to 91% when offering Alipay in China. This kind of granular, localized testing is only possible when you can precisely track which payment methods are presented and selected, without data noise clouding the results.
Moving Beyond a Single Winning Test
The goal here isn’t just to find one winning variation and call it a day. It’s to build a library of learnings about your customers. Every single experiment, whether it wins or loses, teaches you something valuable about what makes your audience tick.
An experiment that "fails" to produce an uplift is not a failure. It's a successful discovery of what doesn't work, and that insight is incredibly valuable. It prevents you from making a bad decision and points you in a new direction.
Document every single test outcome with obsessive detail.
- Hypothesis: What did you think would happen?
- Result: What actually happened, with all the supporting data?
- Learning: What does this reveal about your users' preferences or behaviors?
This internal knowledge base becomes your most valuable CRO asset. It guides future hypotheses, helps get new team members up to speed, and stops you from re-running tests that have already given you a clear answer. This systematic approach is the only way to achieve long-term, sustainable conversion growth.
The Silent Killer of ROI: Conversion Regression
Here's a painful scenario I’ve seen play out far too many times: a team celebrates a 10% uplift from a new checkout flow. The winning variation gets rolled out to 100% of traffic. A few weeks later, a developer pushes a seemingly unrelated site update that accidentally breaks the JavaScript powering that new checkout.
Conversions tank, but no one notices right away. The drop gets lost in the day-to-day noise until someone pulls the end-of-month report. By then, you’ve torched weeks of revenue and completely erased all your hard-won gains. This is conversion regression, and it’s a silent killer of ROI.
Your only real defense is continuous, automated monitoring. You have to "lock in" your gains by setting up alerts on your key conversion funnels. An analytics observability platform like Trackingplan can watch these critical user journeys in real time.
If your 'add_to_cart' to 'purchase' funnel completion rate suddenly plummets by 25% right after a new code release, you get an instant alert via Slack or email. The notification will pinpoint the problem, letting your team ship a fix in minutes, not weeks. This transforms your analytics QA from a defensive chore into a powerful system for protecting revenue and making sure your optimization efforts deliver lasting value.
Your Top Conversion Optimization Questions, Answered
When you're deep in the weeds of conversion optimization, a lot of the same questions tend to pop up. Below, we've tackled some of the most common hurdles teams face when trying to move the needle on their conversion rates.
If you're just getting started, you might find yourself asking the fundamental question, What is Conversion Rate Optimization? That’s the perfect place to begin. The answers that follow build on that foundation, with a sharp focus on using reliable data to drive real, measurable results.
What Is a Good Conversion Rate to Aim For?
This is the million-dollar question, and the honest answer is: it depends entirely on your context. There’s simply no universal benchmark for a "good" conversion rate. An e-commerce store might shoot for a 3% rate from visitor to purchase, while a B2B SaaS company could be ecstatic with a 1% trial signup rate from their blog traffic.
Instead of getting hung up on industry averages, your first job is to establish your own baseline with data you can actually trust. Once you have a clean, validated number, your goal becomes clear: beat that number. Aiming for a 10-20% relative lift from your verified baseline is a solid, achievable target for your first round of optimization efforts.
How Long Should I Run an A/B Test for Reliable Results?
The right test duration hinges on two main factors: your traffic volume and reaching statistical significance, which is typically set at a 95% confidence level. More practically, you should always run a test for at least one full business cycle—usually one or two weeks—to account for natural variations in user behavior between weekdays and weekends.
The single biggest mistake teams make here is calling a test early because one variant pulls ahead. This is a textbook trap for acting on a false positive.
The most critical factor, however, has nothing to do with duration. Your event tracking must be fully validated before you launch. If your data is broken, your test results will be meaningless, no matter how long it runs.
My Conversions Dropped Suddenly. What Should I Check First?
When conversions take an unexpected nosedive, your first instinct should be to investigate for a technical error, not a marketing one. Before you start pulling campaign reports or blaming market trends, you absolutely must confirm that your core conversion events are still firing correctly.
This is exactly where automated analytics observability becomes a game-changer. A platform like Trackingplan can alert you the moment a new code deployment breaks your add_to_cart event or a marketing pixel gets misconfigured. Adopting this "data-first" mindset saves teams countless hours of panicked guesswork and stops them from trying to solve a marketing problem that's actually a technical bug. Always check your analytics QA alerts first.
Can I Increase Conversions Without Expensive A/B Testing Tools?
Absolutely. In fact, many of the most impactful conversion wins don't come from complex multivariate tests but from nailing the fundamentals. The highest-leverage investment you can make is ensuring your data is 100% accurate and reliable.
Once your analytics are solid, you can use a free tool like Google Analytics to identify the biggest points of friction in your user funnel. You'll often find that simple, low-cost fixes can produce outsized results.
Here are a few high-impact areas to focus on:
- Clarifying your value proposition on your homepage and landing pages.
- Improving site speed and core web vitals.
- Adding social proof like customer testimonials, reviews, or case studies.
You can even run basic tests without a dedicated platform. By deploying sequential changes and closely monitoring performance against your validated analytics, you can confidently measure impact and build the momentum your optimization program needs.
Ready to stop guessing and start trusting your data? Trackingplan provides the automated analytics QA and observability you need to build a rock-solid foundation for conversion growth. Discover how you can protect your data and drive real results today.